PENDLE – Bullish Continuation Setup from Key Support ZonePENDLE remains one of the standout performers in the crypto space, maintaining its bullish market structure even amid broader market uncertainty. With price currently holding well above key support, this presents a favorable opportunity for a swing long position, especially if the broader market stabilizes.
📥 Entry Zone:
$3.50 – $4.30
🔹 Confluence with previous resistance turned support
🔹 Demand zone within bullish structure
🔹 Ideal for scaling in
🎯 Take Profit Targets:
🥇 $5.45
🥈 $6.30
🥉 $6.85
🛑 Stop Loss:
Daily close below $3.00
Structure breakdown
PENDLEUSDT trade ideas

PENDLE ranging = preparing for a movePENDLE is in a nice range. The price is currently in the middle of the range; however, if it gets overbought, it is likely that the price will visit the top of the range. If this range ultimately forms a bull flag, there is upside potential to consider.
Full TA: Link in the BIO

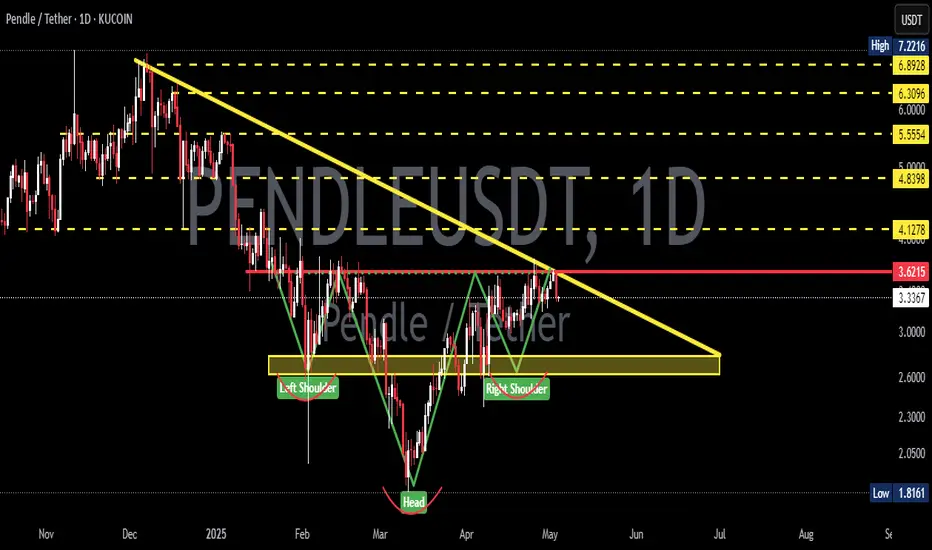
PENDLE/USDT Technical Analysis – April 9, 2025🔍 Market Structure & Price Action
PENDLE has recently bounced from a significant demand zone around the $2.00–$2.20 area, highlighted by the thick blue box at the bottom of the chart. This area has acted as strong support in the past and shows renewed buying interest, evident from the bullish reversal and increased volume around mid-March.
Price action suggests the formation of a potential reversal structure, with the most recent swing low marking a possible higher low compared to the previous downtrend. The chart shows multiple black horizontal lines representing historical support/resistance zones.
🧠 My Perspective & Additional Insight
This chart suggests an early-stage reversal with bullish momentum building. The fact that price bounced cleanly from a macro support zone and is attempting to break above key EMAs strengthens the bullish bias.
With this head&shoulder should give to the price a real boost!
However, volume confirmation will be critical—look for a breakout above $3.25 with strong buying volume to confirm the move.
If planning to enter:
Entry: On reclaim of $3.20 with volume.
Stop Loss: Below $2.60 (or tighter depending on risk).
Targets: $4.25 → $5.42 → $7.50.
Patience is key. If price consolidates above EMAs, the bullish structure will remain intact.
Good trading :-)

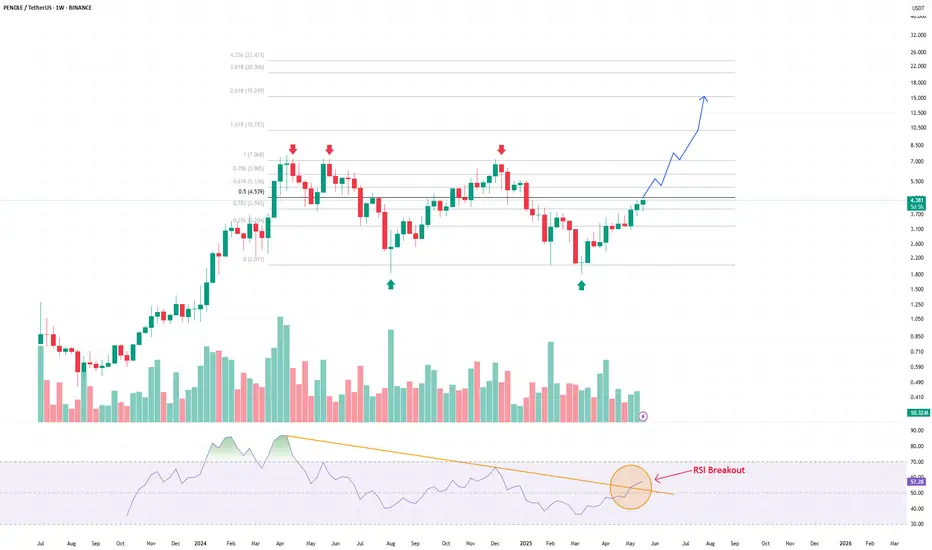
PENDLE – Bullish Continuation?After months of consolidation, PENDLE appears ready to break out of its weekly range.
RSI breakout: Momentum has finally pushed through a long-term descending trendline — a potential shift in trend strength.
Technical structure: Clear higher lows, repeated resistance tests — bulls may be gaining control.
Key Fibonacci levels:
0.618 reclaimed ($5.12),
Next potential targets: $6.50 – $10.19 (1.618 extension),
Higher extensions: $15.24 and $20.30 if bullish momentum continues.
If this breakout confirms with a strong weekly close, PENDLE could enter a new trend phase and aim for price discovery.
PENDLEUSDT → Resistance retest. One step away from distributionBINANCE:PENDLEUSDT is preparing for distribution after a prolonged consolidation. The price is testing a key resistance level, which, if broken, will trigger a rally...
The coin is breaking through the flat resistance and consolidating above the upper border of the range. The key level is 4.400. If the bulls hold their ground above this level, the growth may continue.
Bitcoin is showing bullish dynamics, which supports the altcoin market. The bullish trend may continue in altcoins as well. Pendle may move from consolidation to distribution.
Resistance levels: 4.32, 4.400
Support levels: 4.024, 3.622
If the coin manages to consolidate above the key resistance level, thereby confirming the breakout, the price may move to aggressive growth. In this case, the target could be 4.800.
Best regards, R. Linda!

Pendle New ATH, Resistance & Support —Highest Ever Within MonthsWatch the same price range alternate between resistance and support, the blue line/space on the chart.
There is also a long-term double-bottom and the Adam & Eve formation, all together in the same chart.
This paints a picture of a changing cycle. The recovery from the A&E is quite strong. From the 11-March low we have two long months of painful recovery, slow and steady growth. But PendleUSDT now trades above resistance/support.
The chart is self-explanatory, once on the bullish zone, PENDLEUSDT can grow. This is the situation now. Resistance was conquered 9-May. The proceeding days it was tested as support and holds.
We can expect some consolidation above this level and then boom! A strong advance hitting new highs. Pendle is set to hit its highest prices ever in 2025 and then some more. $11 and $16 are the main targets.
Thank you for reading.
Namaste.

PENDLE Bearish Head and Shoulders – Potential Pullback at the Ne CRYPTOCAP:PENDLE Bearish Head and Shoulders – Potential Pullback at the Neckline 📉
CRYPTOCAP:PENDLE has formed a bearish head and shoulders pattern. We could see a potential pullback at the neckline before the price moves down to the green line level as the next target. 📊

PENDLEUSDT 📈 PENDLEUSDT 4H Analysis:
Price rebounded from the 2.444 demand zone after a short-term breakdown and is now stabilizing above the 200 EMA, with the bullish trendline still intact. Key resistance lies at 3.219, and breaking it could open the path to 3.602. However, a drop below 2.626 and the trendline may trigger a deeper correction.

PENDLEUSDT 2D AnalysisPENDLE ~ 2D Analysis
#PENDLE Buy when re -testing this support block or buy after successfully penetrating this resistant line with a short -term target of at least 10%+.
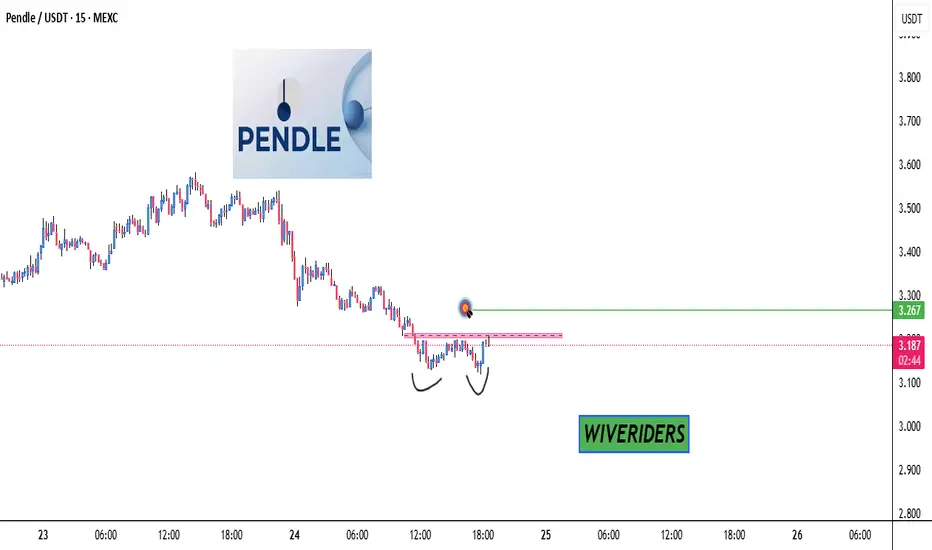
Double Bottom Breakout Watch! 📈 CRYPTOCAP:PENDLE - Double Bottom Breakout Watch! 👀
⏳ On the lower timeframe, CRYPTOCAP:PENDLE has formed a double bottom pattern.
🔴 Confirmation needed: Break and close above the red resistance zone.
🎯 Target: Green line level on a successful breakout! 🚀
PENDLEUSDTshort selling set up 📉
DISCLAIMER:
what I share here is just personal research, all based on my hobby and love of speculation intelligence.
The data I share does not come from financial advice.
Use controlled risk, not an invitation to buy and sell certain assets, because it all comes back to each individual.

It's time the ETH ecosystem gets some love. Leveraged beta plays
I'm going to go long ETH, and as a leveraged beta I'm taking a bet on PENDLE. It's like hating on D----ey world, Sometimes you might not like the decisions being made by the higher ups, but its still the top dawg L1.

PENDLEUSDTPossible long after the retest on the support level.
RED = support
GREEN = recistance
YELLOW = trendlines + support/recistance

PENDLEI'm take short selling, cancel close position if break above strong high
RR 1 : 2
DISCLAIMER:
what I share here is just personal research, all based on my hobby and love of speculation intelligence.
The data I share does not come from financial advice.
Use controlled risk, not an invitation to buy and sell certain assets, because it all comes back to each individual.

#PENDLE/USDT#PENDLE
The price is moving within a descending channel on the 1-hour frame and is expected to continue upward.
We have a trend to stabilize above the 100 moving average once again.
We have a downtrend on the RSI indicator, which supports the upward move with a breakout.
We have a support area at the lower boundary of the channel at 2.63.
Entry price: 2.85
First target: 3.07
Second target: 3.20
Third target: 3.40

long PENDLEPendle broke through the resistance level and the descending trendline. Bullish movement to $5.55 is expected to happen.

#PENDLE: Unlocking Yield Tokenization in DeFi**Description**:
This trading idea focuses on **PENDLE**, a DeFi protocol that introduces yield tokenization, allowing users to separate and trade future yield from underlying assets. By enabling a secondary market for yield-bearing tokens, **PENDLE** provides investors with new opportunities for maximizing returns and managing risk exposure in decentralized finance. With the growing demand for innovative yield strategies, **PENDLE** has positioned itself as a key player in the evolving DeFi landscape, attracting liquidity and institutional interest.
Despite its potential, the cryptocurrency market remains highly volatile, with factors such as regulatory developments, macroeconomic conditions, and investor sentiment influencing price movements. As always, a cautious approach and proper risk management are essential when trading **PENDLE** or any digital asset.
**Disclaimer**:
This trading idea is for educational purposes only and should not be considered financial advice. Trading cryptocurrencies like **PENDLE** carries significant risk, including the possibility of losing your entire investment. Always conduct thorough research, assess your financial situation, and consult with a financial advisor before making any investment decisions. Past performance is not indicative of future results.

PENDLEUSDT 1DPENDLE ~ 1D Analysis
#PENDLE Buy gradually after successfully penetrating this resistant line with a short -term target of at least 10%+.


PENDLEUSDT 1WTechnical Analysis
The price has reached the lower boundary of a descending channel structure, accompanied by suitable reversal candlesticks. It appears that with the beginning of the new month, we may witness an upward movement in this chart.

Trading opportunity for PENDLEUSDTBased on technical factors there is a Buy position in :
📊 PENDLEUSDT
🔵 Buy Now
🪫Stop loss 1.800
🔋Target 2.550
📏 R/R 2
💸RISK : 1%
We hope it is profitable for you ❤️
Please support our activity with your likes👍 and comments📝

PENDLEUSDT CHART ANALYSİS - EDUCATIONAL POSTThe NFT Concept
You may already know that each unit of value in a blockchain is called a token. In an open blockchain, all tokens are equal and interchangeable. For example, one bitcoin can be easily replaced with another, and nothing will change.
Non-fungible tokens are a game-changer, which work differently. An NFT is a digital asset that cannot be replaced with another token without changing the value and basis of the object.
Like cryptocurrency, NFTs are created on a blockchain, which acts as a database to record all transactions. The blockchain guarantees the uniqueness, safety, and anonymity of non-fungible tokens. Thanks to this system, any user can verify the originality and transparency of the history of a particular NFT through the blockchain.
When you buy an NFT token, you are obtaining a certificate for a digital or real object. However, the work itself doesn’t move anywhere. You only use its digitized file or a certificate of ownership. Once created or purchased, the token sits in perpetual storage. This certificate is just lines of code that confirm it is the token owner who has the original copy of the object.
An NFT token can be compared to a painting, which may belong to a gallery, museum, or individual, but the audience can see it in a catalog or exhibition.
NFT tokens are sold in online marketplaces that operate like Amazon. The creators put them on marketplaces and wait for bids from buyers.
An NFT token can be created by you or by anyone for that matter. To do this, you need to take a digital object (picture, music, photo, etc.), register in a particular marketplace on a platform such as Rarible or OpenSea, and upload the object with a description and price. You will have to pay a fee for creating a blockchain entry on many platforms. However, the costs pay off in most cases, as NFTs are #1 in the crypto world today.

READDY FOR PENDLE PUMPPENDLE is ready for pump. its in major daily demand zone, We can see a good positive move from here.
