PENGU still has room!?If you find this information inspiring/helpful, please consider a boost and follow! Any questions or comments, please leave a comment!
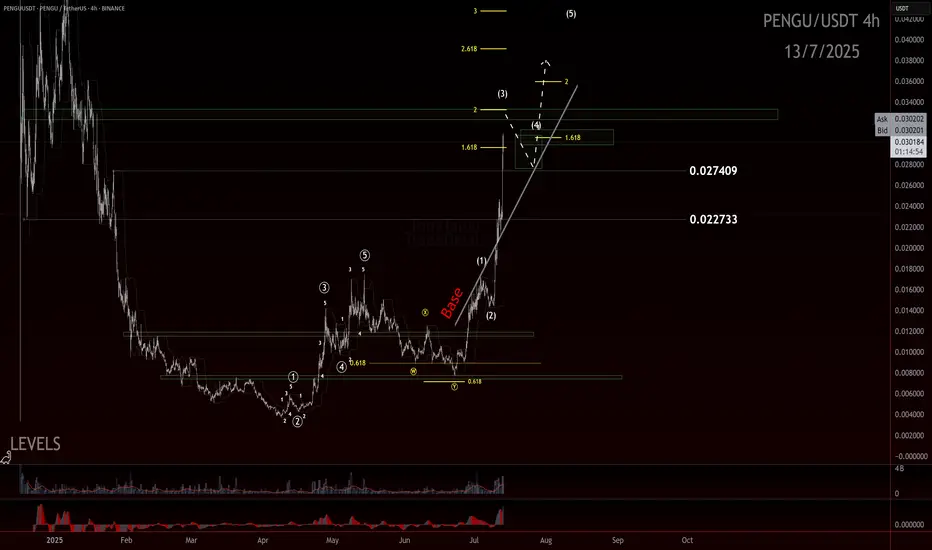
The move off the low looked like a clean, completed impulse—sharp, decisive, and well-structured. After that, we got a double zigzag retracement. It ran a bit deeper than the textbook version, but still landed right in the normal range you’d expect for a healthy correction. From there, we saw another smaller-degree impulse form off the .007 pivot, suggesting bullish momentum was building again.
Since the last update, PENGU has come a long way—more than doubling in price and now hovering around a most likely target for a wave 3. What’s notable is how it got there: not just by breaking above the 0.017 resistance, but by blowing through multiple base channels on solid momentum and healthy volume.
We didn’t get the ideal depth for a retrace for a wave 2 before that breakout, but that doesn’t disqualify the larger count. In fact, from an Elliott Wave perspective, I still believe we haven’t seen a proper wave 4 to balance out the earlier wave (2). So I’m holding off on calling a top to this wave 3 just yet.
Here’s what we’re watching closely now:
The secondary impulse off .007 continues to build structure
Ideally, the next pullback holds above the 0.027 or .022 region, signaling respect for previous support and AOIs
That pullback needs to unfold correctively, not impulsively, to confirm bullish continuation
The next trade setup I’m eyeing is that wave 4 into wave 5 move. I’ll be stalking this ticker closely as structure unfolds.
Trade safe.
Trade clarity.
PENGUUSDT.P trade ideas
PENGU Just Triggered a Massive Breakout! Key Levels to WatchYello, Paradisers! Are you watching what’s unfolding with #PENGU after months of quiet accumulation? Because this chart is finally waking up, and it’s happening right now.
💎After a prolonged bottoming phase that lasted approximately 162 sessions, PENGU has completed a classic cup and handle formation, and we’re now seeing the start of what could be a powerful breakout.
💎#PENGUUSDT has surged above the neckline resistance at $0.01680, and—more importantly, this breakout is backed by strong volume, giving the move real credibility. It’s not just a wick; it’s a genuine push.
💎Now that the neckline is broken, PENGU has room to push higher. But let’s be clear, price is likely to face moderate resistance at the $0.02280 level. That’s a spot where some short-term profit-taking can’t be ruled out, especially from early entries. It’s a natural reaction zone and a moment to watch for how price behaves under pressure.
💎Still, if momentum holds, the pattern suggests a potential move toward the $0.02820 to $0.03200 region. That zone is no joke. It includes the 61.8% and 78.6% Fibonacci retracement levels, two of the most powerful technical resistance points in any market cycle. This makes that area a major decision zone and one that should be approached with caution.
💎On the other side, support is now established between $0.01680 and $0.01500. This is the previous resistance zone, and any retest into this range is likely to see strong demand stepping in. It would not be surprising to see buyers defend this area aggressively, especially if the retest is clean and orderly.
Strive for consistency, not quick profits. Treat the market as a businessman, not as a gambler. This is the only way you will make it far in your crypto trading journey. Be a PRO.
MyCryptoParadise
iFeel the success🌴

PENGU = ETF Catalyst + Whale Accumulation = +30% More Upside?Today, on the weekend, I want to analyze the Pudgy Penguins project with the PENGU ( BINANCE:PENGUUSDT ) token from a fundamental and technical perspective .
Please stay with me.
Why did PENGU surge nearly 40% in just 48 hours? Here’s what’s driving it:
------------------------------------------
Fundamental Analysis:
1. ETF Momentum via Cboe:
On June 26, Cboe officially filed a 19b-4 form for a new ETF that includes Pudgy Penguins and PENGU as major components.
Although not yet approved, this single move has fueled strong institutional anticipation, similar to what happened with Bitcoin ETFs in early 2023.
The market often prices in future narratives — and this ETF storyline has been a powerful one.
2.Whale Accumulation Signals
According to Nansen data, large holders have increased their balances by 11.37%, and notable wallets linked to public figures by 7% over the last 30 days.
Such coordinated accumulation often precedes major price moves, and that pattern seems to be repeating here.
3.NFT Ecosystem Boost
The Pudgy Penguins NFT collection saw a 400%+ surge in sales volume.
This sharp increase in NFT activity has reignited attention toward the broader Pudgy ecosystem, which naturally benefits its native token, PENGU.
Risk Note:
The ETF is not yet approved — we're still in the hype phase.
Volatility remains high, and strong pullbacks are common in low-liquidity tokens like PENGU.
If whale activity continues and institutional narratives grow, the upside potential remains — but so does the downside risk.
------------------------------------------
PENGU token started to rise from the Support zone($0.01-$0.0076) . One of the signs of a continuation of the uptrend was the break of the upper line of the descending channel .
Educational Note: One of the price targets after a channel break can be as wide as the width of the broken channel.
In terms of Elliott Wave theory , it seems that the PENGU token has completed the Double Three Correction(WXY) , and we can wait for the next impulsive waves .
I expect the PENGU token to attack the Resistance zone($0.0128-$0.0118) again, and if this zone is broken , it can increase to at least $0.0137(+30%) .
What is your idea about the Pudgy Penguins project?
Note: If the PENGU token drops below $0.01, we can expect a break of the Support zone($0.01-$0.0076).
Please respect each other's ideas and express them politely if you agree or disagree.
Pudgy Penguins Analyze (PENGUUSDT), 4-hour time frame.
Be sure to follow the updated ideas.
Do not forget to put a Stop loss for your positions (For every position you want to open).
Please follow your strategy and updates; this is just my Idea, and I will gladly see your ideas in this post.
Please do not forget the ✅' like '✅ button 🙏😊 & Share it with your friends; thanks, and Trade safe.

i am bearish for PENGUUSDT for now Key Observations & Analysis
Structure & Trend
You can see a clear downtrend in June.
Price formed an inverted head and shoulders pattern:
Left Shoulder: Early June low.
Head: Deeper low mid-June.
Right Shoulder: Late June higher low.
This is a bullish reversal pattern.
Trendline Breakout: After the right shoulder formed, price broke the diagonal trendline resistance (marked “trendline breakout”)—signaling bullish momentum.
Breakout & Rally
Strong volume increase confirmed the breakout.
Price trended up rapidly after the breakout, forming higher highs and higher lows.
Recent Price Action
The current price is consolidating in a key supply zone (gray shaded area).
Marked order block: a potential supply zone where smart money may sell.
Price has also made a Market Structure Shift (MSS)—suggesting the uptrend could be losing steam.
HTF POI (Higher Timeframe Point of Interest)
The upper gray box labeled HTF POI between ~0.0167–0.0175.
This is likely a major resistance area.
Price is testing this zone repeatedly.
Liquidity & Target
Trend liquidity has been swept, meaning stops above recent highs have likely been taken.
There is a blue shaded box indicating a potential short scenario:
Entry near the order block.
Target near the prior consolidation support around ~0.008–0.009.
This implies a bias toward a corrective move or retracement.
Volume & RSI
Volume spiked during breakout and has since decreased—often a sign of buyer exhaustion.
RSI around ~58—neutral but no overbought signal yet.
✅ Interpretation Summary
Bullish Arguments:
The inverted head and shoulders broke out cleanly.
Strong trend continuation into higher timeframe resistance.
Bearish Arguments:
Price is consolidating under significant resistance (HTF POI).
Order block + liquidity sweep suggest potential distribution.
Market structure shift indicates sellers are stepping in.
The blue target box shows a potential retracement target near 0.008–0.009.
✅ What This Likely Means
Scenario 1 (Continuation):
If price breaks cleanly above 0.0175 with strong volume, continuation higher is likely.
Scenario 2 (Rejection):
If price keeps rejecting this order block, a short-term pullback toward 0.009 becomes probable.
✅ Tip if You’re Trading This
Watch for a clear reaction in the gray order block area.
Confirmation of rejection could trigger shorts.
A strong close above the HTF POI invalidates the bearish scenario.

Penguusdt Buy opportunityPENGUUSDT is exhibiting a potential bullish pennant formation, with price making a strong breakout from the consolidation zone.
It recently found resistance near the top of the pennant pole around the $0.0176 level, which aligns with the Immediate Internal Resistance Level (IIRL).
The current plan is to watch for a pullback into the designated buy-back zone, offering a possible re-accumulation opportunity. If the structure holds, the projected pennant target sits around the $0.043 zone, as illustrated on the chart.

PENGU SHORT UPDATE ,Anything above $0.015 is a Perfect shortPENGU SHORT UPDATE
Anything above $0.015
is a Perfect short
Targeting $0.012500 or Down
Not a Financial advice

PENGU short X10Entry $0.03
Once hit $0.028 place B/E
1st target $0.027 sell 1/2
Stop Loss $0.0315
Final Target - $0.023

PENGU Crypto Futures Trade Plan 2025-07-13PENGU Crypto Analysis Summary (2025-07-13)
Comprehensive Analysis of PENGU Cryptocurrency Trading Models
1. Summary of Each Model's Key Points
Grok/xAI Report:
Technical Indicators: Price above key moving averages indicating a bullish trend. However, the RSI is at 85.84, suggesting overbought conditions, and the price is touching the upper Bollinger Band. Resistance at $0.03 and support at $0.02. Market Sentiment: Bullish sentiment with recent price changes but signaling potential exhaustion. Direction: Moderately Bearish, recommending a short trade at $0.03, stop-loss at $0.031, and take-profit at $0.02.
Claude/Anthropic Report:
Technical Indicators: Similar to the Grok/xAI report, emphasizing the overbought RSI and position at the upper Bollinger Band. The price trend is recognized as unsustainable due to parabolic movement. Market Sentiment: Acknowledges extreme euphoria in recent gains and anticipates a potential correction. Direction: Moderately Bearish, suggesting a short position with entry at $0.03, stop-loss at $0.032, and a take-profit level targeting $0.025.
Gemini/Google Report:
Technical Indicators: Consistent with other reports, highlighting decent bullish momentum yet extremely overbought indicators signify imminent pullback risks. Market Sentiment: Observation of speculative rationales driving prices, highlighting risk factors in liquidity and broader market sentiment. Direction: Moderately Bearish; recommending a short trade with entry price at $0.03, stop-loss at $0.032, and take-profit at $0.025, sharing similar parameters with previous reports.
DeepSeek Report:
Technical Indicators: Emphasizes overbought conditions with a risk of a 20-40% correction. The current price is significantly above key averages, indicating parabolic action. Market Sentiment: Low funding rates indicate lopsided long positioning, foreseeing potential liquidation events. Direction: Strongly Bearish, supporting short position ideas with similar entry, stop-loss, and take-profit recommendations.
Llama/Meta Report:
Technical Indicators: Highlights resistance at the current price point and overbought indications based on RSI and Bollinger Bands metrics. Market Sentiment: Recognizes caution due to lack of news and low funding rates, suggesting potential for a reversal. Direction: Moderately Bearish; recommending a short position with similar parameters to the other reports.
2. Areas of Agreement and Disagreement Between Models
Agreement:
All models identify the price as overbought with an RSI above 85, signaling an imminent potential correction. A collective sentiment of caution prevails, leading to a recommendation for short trades given the exhaustion of the current bullish momentum. They recognize the price level at $0.03 as key resistance, along with suggesting a stop-loss around $0.031 to $0.032 and a take-profit around $0.025.
Disagreement:
The Grok/xAI report emphasizes a “Moderately Bearish” sentiment where others like DeepSeek classified the trend as “Strongly Bearish.” Some reports recommend modest leverage (50x), while others suggest higher leverage (up to 100x).
3. Conclusion
Overall Market Direction Consensus: The consensus among all models is a Moderately to Strongly Bearish outlook for PENGU, backed by overbought technical indicators and recent rapid price increases without fundamental support.
Recommended Trade:
Trade Direction: Short Entry Price/Range: $0.03 Stop Loss Level: $0.0315 (offering a buffer against outlier volatility) Take Profit Level: $0.025 Position Size Recommendation: Based on account size, aiming for a maximum risk of 1% per trade (e.g., 1 contract for a $100 account). Adjust size appropriately for larger accounts. Confidence Level in Recommendation: 0.70 (overall strength of indicators). Key Risks and Considerations: Risks include further bullish momentum despite technical indicators, potential slippage in volatile conditions, and market liquidity constraints. High leverage could amplify losses. Trade Entry Timing: Enter at market open.
TRADE_DETAILS (JSON Format)
{ "instrument": "PENGU", "direction": "short", "entry_price": 0.030, "stop_loss": 0.0315, "take_profit": 0.025, "size": 1, "confidence": 0.70, "entry_timing": "market_open" }
This concise trade plan consolidates insights from various analyses, aligning on key indicators and market sentiment to create a robust trading strategy for PENGU.
📊 TRADE DETAILS 📊 🎯 Instrument: PENGU 📉 Direction: SHORT 💰 Entry Price: 0.03 🛑 Stop Loss: 0.0315 🎯 Take Profit: 0.025 📊 Size: 1 💪 Confidence: 70% ⏰ Entry Timing: market_open
Disclaimer: This newsletter is not trading or investment advice but for general informational purposes only. This newsletter represents my personal opinions based on proprietary research which I am sharing publicly as my personal blog. Futures, stocks, and options trading of any kind involves a lot of risk. No guarantee of any profit whatsoever is made. In fact, you may lose everything you have. So be very careful. I guarantee no profit whatsoever, You assume the entire cost and risk of any trading or investing activities you choose to undertake. You are solely responsible for making your own investment decisions. Owners/authors of this newsletter, its representatives, its principals, its moderators, and its members, are NOT registered as securities broker-dealers or investment advisors either with the U.S. Securities and Exchange Commission, CFTC, or with any other securities/regulatory authority. Consult with a registered investment advisor, broker-dealer, and/or financial advisor. By reading and using this newsletter or any of my publications, you are agreeing to these terms. Any screenshots used here are courtesy of TradingView. I am just an end user with no affiliations with them. Information and quotes shared in this blog can be 100% wrong. Markets are risky and can go to 0 at any time. Furthermore, you will not share or copy any content in this blog as it is the authors' IP. By reading this blog, you accept these terms of conditions and acknowledge I am sharing this blog as my personal trading journal, nothing more.

PENGU: Bullish Falling Wedge Formation.Hello Traders,
Today, let’s analyze PENGU on the daily timeframe.
PENGU is currently forming a falling wedge pattern, which is typically a bullish setup. However, this will only be confirmed if we see a breakout above both the 50 EMA and the resistance trendline. PENGU has proven to be a profitable meme coin for many traders, and so far, the price action looks promising.
Strategy:
~ Long Entry: $0.0108 (after breakout confirmation)
~ Target: $0.015 – $0.017
~ Holding Period: Q3 2025
~ Trade Type: Spot / 2–3x Leverage
Note: Always conduct your own research and analysis before investing.


The best-looking HTF meme chart, hands down is $PENGUThe team behind the crypto mascot accomplished a lot over the last couple of weeks, and the TA is showing;
- CBOE filing for PENGU ETF
- Appeared at @Nasdaq
- Listed on @eToro
- Listed on @RevolutApp
- Listed on @Official_Upbit
- Listed on @WebullGlobal Pay
- @NASCAR Partnership
- PEZ x Pudgy Penguins Partnership
- Miles & More Partnership
- @PenguClash reached 2M+ on waitlist
- 1B views per day
All this and much more!
@pudgypenguins are doing it the right way 🐧

Pudgy Penguins (PENGU): Looking For Break of StructurePengu is forming another BOS (possibly), which will give us a good opportunity for a further movement to upper zones.
We are waiting for the clean breakout from here; after that, we want to see the retest and another BOS, which will be our final confirmation, so our attentions are here right now.
Swallow Academy

PENGU SHORT UPDATE Added more Shorts from $0.017000 (Dump time PENGU SHORT UPDATE
Added more shorts from $0.017000
Expecting huge drop soon
Dumping time soon
Target $0.012600 0r Down
Not a Financial advice

PENGU. Main trend. Trend reversal zone. 04 07 2025Logarithm. Main trend. Fresh cryptocurrency, which is being driven into hype.
Locally now. Price at the median of the bowl.
Buyer volume dominates. Most likely, there will be a large pump in case of a breakout.
The chart is somewhat reminiscent of the Bitcoin chart, the reversal zones of this secondary trend, after the first local wave of growth. The first local, significant target is shown.
There is a possibility of a helicopter, that is, to collect stops in both directions, and thereby dump passengers before a potential pump.
Such cryptocurrencies (low liquidity, monopoly over the price due to the concentration of cryptocurrency in “one hand”) at a good time "the hamster is not scared", will be pumped up conditionally, like Shiba Inu (SHIB), driving the hype (raising the price over and over again, and coming up with positive news) and 0.5 million Twitter subscribers (X). Medium-term — long-term level zones are shown on the chart.

$PENGUUSDT: Bullish trend with solid catalystsCSECY:PENGU is about to stage a sharp advance from here. The chart is coiling up and looks ready to send it.
If you still haven't acquired your 88,888+ CSECY:PENGU bag to get the multiplier for the Abstract Chain airdrop, you might as well do it now before it costs a lot more. The airdrop isn't a direct handout; holding the tokens gives you an XP boost, so you've still got to get on-chain and play the game, but it's a critical edge. Most users minted 6 badges, if you can mint more, you're ahead of the pack, still quite under-farmed in my opinion.
Just recently, we got news about progress on a CSECY:PENGU ETF listing. This is a massive development and could seriously add fuel to the fire as well.
Abstract Chain stats are looking solid. The chain is already pulling in over $30M in TVL and doing nearly $6M in daily volume. People are actively using it, and dapps are generating real revenue.
For example, the highly successful scratch card game, Gacha, pulled in over 1.6mm in fees so far.
It just makes sense. Look at Robinhood launching their own L2 with Arbitrum tech. If you have an app with a real user base, you own the chain. The Pudgy Penguins team is a force of nature when it comes to real-world adoption and building a brand people love. They've already managed to attract a bunch of interesting apps that are bringing in solid numbers. It's a smart play by a team that knows how to win.
The whole setup looks incredibly bullish and with Ethereum's trend turning bullish vs CRYPTOCAP:BTC and CRYPTOCAP:USDT , these are the plays that have my attention. Don't sleep on this one.
Best of luck!
Cheers,
Ivan Labrie.

PENGU Above the Cloud – Bullish Momentum BuildsPENGU is maintaining a position above the Ichimoku Cloud on the daily chart — a signal that bullish momentum is in play. The cloud’s Leading Span A and B now act as dynamic support at $0.0154 and $0.0140, respectively, suggesting that the uptrend remains protected for now.
The Ichimoku Cloud indicator helps track trend direction and potential support/resistance zones. With PENGU trading above it, the bias remains bullish, pointing to increasing demand and fading bearish pressure. Should this accumulation phase hold, the price could push toward $0.0203 in the near term.
That said, caution is warranted. If buyers begin to exit and profit-taking sets in, PENGU risks falling close to the cloud’s upper boundary. Traders should watch for a change in volume or momentum that could signal a potential reversal.

PENGU/USDT Breakout Power — Start of a New Bullish Wave?
📌 Technical Overview:
The chart of PENGU/USDT on the daily timeframe has just printed a very strong bullish signal. After months of downward movement, the price has successfully broken out from a well-formed Falling Wedge — a classic bullish reversal pattern.
🧠 Pattern Analysis:
📉 Falling Wedge:
The wedge started forming since January 2025, marked by a series of lower highs and lower lows. Price action was squeezed into a narrowing range, indicating weakening bearish pressure.
The breakout in early July came with strong momentum, confirming bullish intent.
🟨 Key Demand Zone (Highlighted Box):
Between 0.0113 – 0.0124 USDT, this area aligns with key Fibonacci retracement levels:
0.5 @ 0.01248
0.618 @ 0.01138
0.786 @ 0.00981
This zone now acts as critical support, offering a possible buy-the-dip opportunity.
📏 Major Resistance Levels (Targets):
TP1: 0.02520 USDT – Minor resistance, first breakout confirmation
TP2: 0.03044 USDT – Structural mid-level resistance
TP3: 0.04316 USDT – Major psychological and structural barrier
TP4: 0.07000 USDT – Former high, potential long-term target
🟢 Bullish Scenario:
Price has cleanly broken above the wedge resistance and is now retesting or consolidating above the prior resistance zone.
As long as the price holds above 0.012 USDT, the bullish structure remains intact.
The ideal bullish path would be:
1. Minor pullback or retest to the yellow box area (demand)
2. Strong rally toward 0.025 USDT, followed by gradual climb toward 0.030 – 0.043 USDT
3. With sustained volume, 0.07 USDT becomes a realistic mid-term target
🔴 Bearish Scenario:
Failure to hold the 0.012 – 0.011 USDT demand zone would trigger a warning sign.
Breakdown below 0.0098 USDT (Fibo 0.786) would invalidate the breakout, and potentially resume the bearish trend.
If this happens, watch for price to revisit lower supports around 0.0075 – 0.0050 USDT
🧩 Volume and Momentum Watch:
The breakout was supported by a clear uptick in volume – a strong confirmation signal.
Keep an eye on RSI and MACD on your platform — if bullish divergence continues, it could fuel a sustained breakout.
💬 Summary:
> “PENGU is no longer hibernating — the breakout from a long-term falling wedge pattern signals the beginning of a new trend. With a confirmed breakout, solid support at Fibonacci levels, and clearly defined targets ahead, PENGU/USDT could be setting up for a powerful bullish leg — but caution remains essential at support levels.”
📣 Join the Momentum Early!
If the bullish scenario plays out, this could be a high-reward setup — but always manage your risk!
#PENGU #AltcoinSeason #CryptoBreakout #FallingWedge #BullishCrypto #CryptoTA #TradingViewAnalysis #USDT #AltcoinAlert #ChartPattern #TechnicalBreakout

Pengu Long to $0.017735Just went long on Pengu. Targeting $0.017735
Stop: $0.015480
Almost 3RR
Time sensitive

PENGU SELL SETUP ,Sold From $0.013500PENGU SELL SETUP
Currently $0.013600
Sold From $0.013500
(Trading plan If PENGU go up to $0.014600
will add more shorts)
Expecting target $0.012050 OR DOWN
In the event of an early exit,
this analysis will be updated.
Its not a Financial advice

PENGU's RSI Signals Possible Pullback AheadPENGU may be at risk of a short-term correction as buying pressure cools off. The RSI currently sits at above 70, placing the altcoin firmly in overbought territory.
RSI values above 70 typically signals unsustainable momentum and hints at an upcoming pullback or consolidation phase.
Trader are advised to watch for weakening momentum as buyers become exhausted. Once selloffs commence, the token's price could fall to $0.0037.
On the other hand, if demand swells, the meme coin's price could reach $0.018.

Pudgy Penguins PENGU price analysis🪙 It seems that #PENGU is being sold off, and the price of OKX:PENGUUSDT has been stuck in consolidation at conditional highs for several days now, where positions are likely being redistributed.
Nevertheless, if at the beginning of the year, after listing, the price of the #PudgyPenguins token was released into not even “free float,” but simply into “free fall,” now, for several months, it has been “held” in a controlled manner.
🐻 If our assumption is correct, then the price of #PENGUUSDT should adjust to $0.01 or, in the worst case, to $0.0065-0.0070
📈 And if we are wrong, then the price of #PENGU has every chance of breaking out through to $0.02 in the coming days. With a global target of $0.03
⁉️ What is your opinion
Is this a fundamental project that is doomed to grow, or just a manipulative memecoin toy?
_____________________
Did you like our analysis? Leave a comment, like, and follow to get more

Care for a cup of tea? And this goes like this.
Cup with a handle. Perfect example?
Lets see how does this develop.

PENGU Price Outlook: Bullish Momentum BuildsPENGU shows signs of bullish strength on the charts. The MACD line is currently above the signal line, signaling positive momentum and increasing buying pressure. This crossover is typically viewed as a buy signal, suggesting bulls are gaining control.
A continued rally could send PENGU toward $0.0189.
However, failure to sustain this momentum might see the price drop back to $0.0037.
