PENGU Crypto Futures Trade Plan 2025-07-13PENGU Crypto Analysis Summary (2025-07-13)
Comprehensive Analysis of PENGU Cryptocurrency Trading Models
1. Summary of Each Model's Key Points
Grok/xAI Report:
Technical Indicators: Price above key moving averages indicating a bullish trend. However, the RSI is at 85.84, suggesting overbought conditions, and the price is touching the upper Bollinger Band. Resistance at $0.03 and support at $0.02. Market Sentiment: Bullish sentiment with recent price changes but signaling potential exhaustion. Direction: Moderately Bearish, recommending a short trade at $0.03, stop-loss at $0.031, and take-profit at $0.02.
Claude/Anthropic Report:
Technical Indicators: Similar to the Grok/xAI report, emphasizing the overbought RSI and position at the upper Bollinger Band. The price trend is recognized as unsustainable due to parabolic movement. Market Sentiment: Acknowledges extreme euphoria in recent gains and anticipates a potential correction. Direction: Moderately Bearish, suggesting a short position with entry at $0.03, stop-loss at $0.032, and a take-profit level targeting $0.025.
Gemini/Google Report:
Technical Indicators: Consistent with other reports, highlighting decent bullish momentum yet extremely overbought indicators signify imminent pullback risks. Market Sentiment: Observation of speculative rationales driving prices, highlighting risk factors in liquidity and broader market sentiment. Direction: Moderately Bearish; recommending a short trade with entry price at $0.03, stop-loss at $0.032, and take-profit at $0.025, sharing similar parameters with previous reports.
DeepSeek Report:
Technical Indicators: Emphasizes overbought conditions with a risk of a 20-40% correction. The current price is significantly above key averages, indicating parabolic action. Market Sentiment: Low funding rates indicate lopsided long positioning, foreseeing potential liquidation events. Direction: Strongly Bearish, supporting short position ideas with similar entry, stop-loss, and take-profit recommendations.
Llama/Meta Report:
Technical Indicators: Highlights resistance at the current price point and overbought indications based on RSI and Bollinger Bands metrics. Market Sentiment: Recognizes caution due to lack of news and low funding rates, suggesting potential for a reversal. Direction: Moderately Bearish; recommending a short position with similar parameters to the other reports.
2. Areas of Agreement and Disagreement Between Models
Agreement:
All models identify the price as overbought with an RSI above 85, signaling an imminent potential correction. A collective sentiment of caution prevails, leading to a recommendation for short trades given the exhaustion of the current bullish momentum. They recognize the price level at $0.03 as key resistance, along with suggesting a stop-loss around $0.031 to $0.032 and a take-profit around $0.025.
Disagreement:
The Grok/xAI report emphasizes a “Moderately Bearish” sentiment where others like DeepSeek classified the trend as “Strongly Bearish.” Some reports recommend modest leverage (50x), while others suggest higher leverage (up to 100x).
3. Conclusion
Overall Market Direction Consensus: The consensus among all models is a Moderately to Strongly Bearish outlook for PENGU, backed by overbought technical indicators and recent rapid price increases without fundamental support.
Recommended Trade:
Trade Direction: Short Entry Price/Range: $0.03 Stop Loss Level: $0.0315 (offering a buffer against outlier volatility) Take Profit Level: $0.025 Position Size Recommendation: Based on account size, aiming for a maximum risk of 1% per trade (e.g., 1 contract for a $100 account). Adjust size appropriately for larger accounts. Confidence Level in Recommendation: 0.70 (overall strength of indicators). Key Risks and Considerations: Risks include further bullish momentum despite technical indicators, potential slippage in volatile conditions, and market liquidity constraints. High leverage could amplify losses. Trade Entry Timing: Enter at market open.
TRADE_DETAILS (JSON Format)
{ "instrument": "PENGU", "direction": "short", "entry_price": 0.030, "stop_loss": 0.0315, "take_profit": 0.025, "size": 1, "confidence": 0.70, "entry_timing": "market_open" }
This concise trade plan consolidates insights from various analyses, aligning on key indicators and market sentiment to create a robust trading strategy for PENGU.
📊 TRADE DETAILS 📊 🎯 Instrument: PENGU 📉 Direction: SHORT 💰 Entry Price: 0.03 🛑 Stop Loss: 0.0315 🎯 Take Profit: 0.025 📊 Size: 1 💪 Confidence: 70% ⏰ Entry Timing: market_open
Disclaimer: This newsletter is not trading or investment advice but for general informational purposes only. This newsletter represents my personal opinions based on proprietary research which I am sharing publicly as my personal blog. Futures, stocks, and options trading of any kind involves a lot of risk. No guarantee of any profit whatsoever is made. In fact, you may lose everything you have. So be very careful. I guarantee no profit whatsoever, You assume the entire cost and risk of any trading or investing activities you choose to undertake. You are solely responsible for making your own investment decisions. Owners/authors of this newsletter, its representatives, its principals, its moderators, and its members, are NOT registered as securities broker-dealers or investment advisors either with the U.S. Securities and Exchange Commission, CFTC, or with any other securities/regulatory authority. Consult with a registered investment advisor, broker-dealer, and/or financial advisor. By reading and using this newsletter or any of my publications, you are agreeing to these terms. Any screenshots used here are courtesy of TradingView. I am just an end user with no affiliations with them. Information and quotes shared in this blog can be 100% wrong. Markets are risky and can go to 0 at any time. Furthermore, you will not share or copy any content in this blog as it is the authors' IP. By reading this blog, you accept these terms of conditions and acknowledge I am sharing this blog as my personal trading journal, nothing more.
PENGUUSDT.P trade ideas

$PENGU - Short-term OutlookBINANCE:PENGUUSDT | 4h
Price is now trading above previous resistance. If this level holds as new base support, we could see a retest of the 0.028–0.032 zone
Key local support to hold: 0.0175–0.014
Possible TPs:
.0218-.0233 (scalp)
.0262-.0282
.0295-.0326

PENGUUSDT 50%-150% potentialBINANCE:PENGUUSDT is showing a classic cup and handle breakout on the daily chart, supported by a strong upward move and a bullish structure. Price has successfully broken out of key resistance around 0.0173, and volume is picking up. If momentum continues, the projected target points toward the $0.045 level, suggesting a potential upside of 50%-150%. The setup remains valid as long as price stays above the handle low around 0.0141.
Regards
HExa

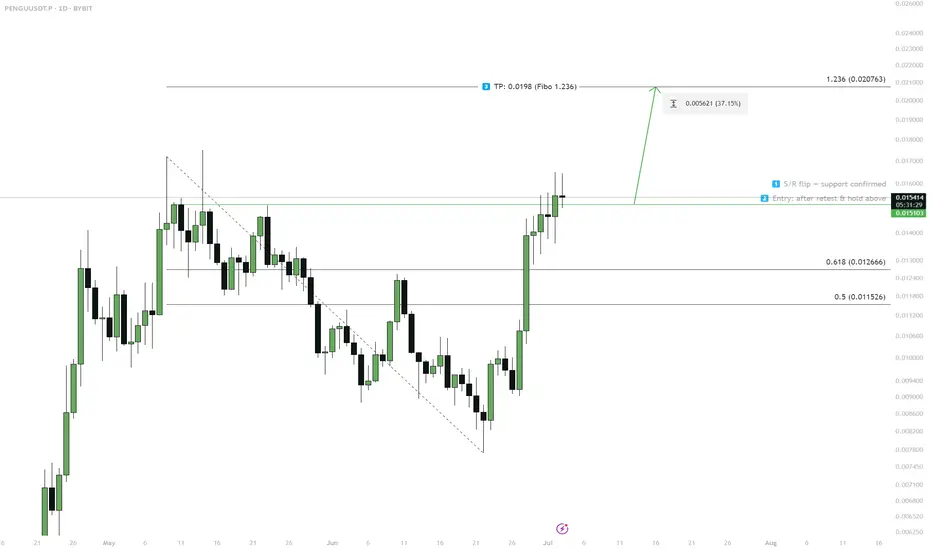
PENGU — S/R Flip & Breakout Scenario1. S/R flip at 0.0151 — wait for retest
2. Enter on successful hold above 0.0151
3. Target: 0.0198 (Fibo 1.236)
4. If fails to hold above 0.0151 — scenario invalid
PENGUUSDT Forming Powerful Bullish SetupPENGUUSDT is quickly emerging as one of the standout crypto pairs to watch, with its chart showing signs of a powerful bullish setup. The price action indicates that buyers are steadily gaining control, supported by healthy trading volume that hints at strong investor confidence. With expectations for a potential gain of 90% to 100%+, traders are closely monitoring this pair for a breakout that could deliver significant profits in the short to mid-term.
Technical analysis reveals that PENGUUSDT has been consolidating within a clear structure, allowing accumulation at lower levels before a potential surge. As the market sentiment continues to shift towards more risk-on assets, coins like PENGUUSDT are seeing renewed buying interest from retail and institutional traders alike. The confluence of strong volume, consistent higher lows, and a breakout-ready structure provides a solid foundation for a substantial price move.
What makes PENGUUSDT particularly attractive is the growing attention it’s receiving across crypto communities and trading circles. Investors recognize that such setups, combined with good liquidity and project fundamentals, can yield impressive returns once the market confirms a decisive move. Keeping an eye on breakout levels and sustained volume spikes will be crucial for traders looking to capitalize on this promising opportunity.
Given the current market dynamics, PENGUUSDT is positioning itself as a potential leader among altcoins poised for explosive growth. Traders are advised to apply solid risk management and follow the price action closely as momentum builds up. A successful breakout could pave the way for PENGUUSDT to deliver one of the best percentage gains in the coming weeks.
✅ Show your support by hitting the like button and
✅ Leaving a comment below! (What is You opinion about this Coin)
Your feedback and engagement keep me inspired to share more insightful market analysis with you!

PENGU/USDT: The Penguin's Journey to Recovery!📊 CURRENT SITUATION 🔔
🎯 THE BIG PICTURE: "Penguin Waddle Pattern"
PENGU is currently executing what I call the "Antarctic Slide Recovery" - a classic bounce pattern after a significant correction from the 4H Fair Value Gap (FVG).
🟢 BUY ZONE (Support Cluster)
* Primary Support: 0.008
* Fibonacci 0.786 Level: 0.0075
* 1D FVG: Providing strong foundational support
🚀 TRADING SCENARIO ⭐⭐⭐
- Target 1: 0.0095
- Target 2: 0.0114
- STOP LOSS: 0.007
- Ultimate Support: 1D FVG zone
🎯⚡ RISK MANAGEMENT
* Position Size: Risk only 2-3% of portfolio
* Time Horizon: 5-10 days for full target achievement
* Exit Strategy: Scale out at each resistance level
Remember: Trade what you see, not what you think! The market is the ultimate teacher. 🎓
Happy Trading! 🚀🐧

Penguins Can’t Fly, But This Chart Might If you find this information inspiring/helpful, please consider a boost and follow! Any questions or comments, please leave a comment!
The move off the low looks like a clean, completed impulse wave sharp, decisive, and showing solid structure. After that, we had a double ZZ retracement. While it was a bit deeper than the textbook ideal, it still fits perfectly within the normal range you’d expect for a healthy correction. Now, we’re seeing another smaller-degree impulse forming from the .007 pivot, suggesting that the market is gaining momentum again.
Here’s what we’re watching closely:
The secondary impulse off .007 continues to build structure.
We want to see a pullback after impulse completion that ideally holds above the .011 region, showing the market respects previous support and AOIs.
The structure of this potential pullback needs to be corrective rather than impulsive to confirm bullish continuation.
A clean move above prior swing highs would confirm that the larger wave 3 or C is underway.
Overall, this chart is ticking the boxes for a potential larger upside push if the market respects key levels and continues to print impulsive structure higher.
Trade Safe!
Trade Clarity!

PENGUUSDT Forming Strong BreakoutPENGUUSDT is showing signs of a strong breakout pattern, which often indicates the end of a consolidation phase and the beginning of a new bullish trend. With good volume accompanying this breakout, the setup looks promising for traders looking to capture a significant upward move. This breakout could pave the way for a gain of 90% to 100%+, which aligns with how similar patterns have performed historically in the crypto market.
The PENGU ecosystem has been drawing increasing attention from investors who are keen on innovative community-driven tokens. As the crypto space continues to reward fresh narratives and strong communities, PENGU could benefit from renewed investor sentiment and social media hype, fueling further upside potential. A well-timed entry around the breakout zone can help traders maximize the reward-to-risk ratio on this high-potential move.
Technically, the breakout pattern is being validated by consistent higher lows and a decisive push above key resistance levels. Sustained volume and follow-through buying are critical to confirm the move, so traders should watch closely for a retest and bounce, which could act as an ideal entry point. This structure suggests that bullish momentum could accelerate quickly once the breakout is confirmed.
Overall, PENGUUSDT is a chart worth keeping on the radar for anyone interested in trading breakouts in altcoins. With its strong community backing and attractive chart setup, this pair could offer a compelling swing trade or even a short-term momentum play for those seeking robust gains.
✅ Show your support by hitting the like button and
✅ Leaving a comment below! (What is You opinion about this Coin)
Your feedback and engagement keep me inspired to share more insightful market analysis with you!

PENGU | Waiting for Trendline BreakPENGU/USDT is forming a classic descending triangle pattern with price consolidating near the lower support zone around 0.0060-0.0080. The key resistance level is the descending trendline (blue line) that has been capping recent rallies. RSI shows recovery from oversold conditions, suggesting selling pressure may be exhausting.
A decisive break above the trendline would signal a shift in momentum and potentially trigger the bullish scenario outlined by the red arrow projection. This breakout could target the upper resistance zone around 0.0220, representing significant upside potential.
The current consolidation near support provides a favorable risk-to-reward setup for patient traders. However, failure to break the trendline could see price retest the lower support levels. Volume confirmation on any breakout attempt will be crucial for validating the bullish thesis. Risk should be managed with stops below the recent lows around 0.0050.

$PENGU Breakout RetestCSECY:PENGU broke above the downtrend and is now retesting the breakout zone.
Holding this support could trigger a 28.91% move higher. Structure remains bullish above this level.
DYRO, NFA

PENGUUSDT Forming Falling WedgePENGUUSDT is currently showing a textbook falling wedge pattern on the daily chart, which is a bullish technical setup often signaling a trend reversal. The price has been compressing within downward-sloping resistance and support lines, and with the wedge tightening, a breakout is becoming more likely. This setup is particularly appealing when paired with the recent increase in trading volume, suggesting accumulation and growing market interest. If a breakout confirms, the projected upside could be in the range of 90% to 100%+ based on historical wedge breakouts and current technical targets.
From a volume and sentiment perspective, the coin has seen consistent liquidity, and investor chatter is increasing across forums and social platforms. The consolidation after a previous strong uptrend adds further strength to the setup — a classic "bullish continuation" after a healthy correction phase. Traders often look for such patterns to catch early momentum before a full-scale rally unfolds. In the case of PENGUUSDT, once resistance breaks convincingly, a strong wave upward could follow swiftly.
The breakout zone to watch sits slightly above the upper descending trendline, and with price already nudging against it, traders should keep an eye on confirmation candles with strong volume. Given the relatively clean overhead structure, any successful breakout could lead to a quick retest of previous highs, providing significant upside. The 100% profit projection marked on the chart highlights the measured move target, aligning with prior resistance zones.
Technically sound and backed by rising interest, PENGUUSDT presents a high-potential opportunity for short-term and swing traders. If momentum continues, this could become one of the top-performing micro-cap plays in the coming weeks.
✅ Show your support by hitting the like button and
✅ Leaving a comment below! (What is You opinion about this Coin)
Your feedback and engagement keep me inspired to share more insightful market analysis with you!

Pengu to Propel Upside to $0.02BYBIT:PENGUUSDT.P
A demand block has formed around $0.01.
Price is now attempting to push above this level.
There may be some pullbacks into the block, but I still expect the uptrend to continue.
The next price target is $0.02.

$PENGU - S/R FlipBINANCE:PENGUUSDT | 1D
The price has retested the support/resistance level at 0.008, potentially indicating a support/resistance flip.
A break above the local resistance at 0.012 could lead to a retest of the 0.020–0.026 range.

$PENGU Breakout Alert!After days of tight consolidation, PENGU has finally broken out of the falling wedge structure.
Price is pushing through resistance with strong momentum — our entry was right on the breakout!
Targeting the 0.0145 zone
Invalidated below 0.0092
This is a textbook breakout play — wait patiently, strike with precision.
Stay disciplined and let the setup do the work!

Pudgy Penguins PENGU Gearing Up for a +100% Move! 🐧 BINANCE:PENGUUSDT has completed its 5-wave advance from the April low (wave 1) and corrected with a 3-wave Zigzag structure in wave (2), reaching the buying area at equal legs $0.009 - $0.008.
🚀 Now, it's setting up for wave (3) higher, with an initial target at $0.022.
🌊 Are you positioned to catch the next wave higher?

$PENGU Approaching Apex – Breakout Watch On!CSECY:PENGU is forming a symmetrical triangle on the 4H chart, and price is getting close to the apex.
It’s currently holding above the support trendline and the 200 EMA a key zone to watch.
A breakout above the triangle could push the price toward the $0.022–$0.023 range.
I’m watching closely. If it breaks out with strong volume, it could be a solid setup.
Use a tight stop-loss and manage your risk properly.

PENGU 12H – System Entry Triggered
PENGU just gave a system entry on the 12H time frame.
📌 The black line represents entry points from the 3D and 1W time frames. It has acted as a key level in the past and has now been flipped into support again.
📈 Price is currently pushing into the pink box, which may act as short-term resistance. Keep an eye on how long it takes to break through this zone—if it lingers too long, we might see a temporary rejection.
🟢 OBV is rising
🟢 MACD is turning bullish
🟢 Fundamentals look very strong
I believe PENGU still has upside potential from here.
✅ Stick to the system—no guessing tops. Let price action guide the decisions.

PENGUUSDT 12H#PENGU is moving inside a bullish rectangle pattern on the 12H timeframe.
The midpoint of the rectangle, along with the 12H EMA200, is currently acting as strong support. A breakout above the rectangle resistance could ignite a bullish rally.
Short-term targets:
🎯 $0.017118
🎯 $0.019127
🎯 $0.021681
Mid-term targets:
🎯 $0.023014
🎯 $0.024929
🎯 $0.028516
⚠️ Use a tight stop-loss.

Pengu (PENGU): HUGE CME might result a big drop...We are seeing a good chance for Pengu coin to dip after a huge upward movement, which brought a lot of volatility into the coin.
Despite all that, we do need some sort of correction here so that's what we are seeking. We opened a smaller trade with 20x leverage but 0.5% sizing.
Swallow Academy

$PENGU is prepared for a bounce! CSECY:PENGU is prepared for a bounce!
Price is still moving inside the rising channel and just touched the lower support line.
As long as it stays above the $0.0128–$0.0132 zone, we could see a bounce toward the top of the channel near $0.018.
This setup offers a good risk-reward.
Entry: $0.0130
Stop-loss: $0.0119
DYOR, NFA
#cryptocurrencies

Pudgy Penguins (PENGU): 23.05.2025Seeing signs of weakness on PENGU coin, where recently we've been having a few short squeeze candles near the same area, which is showing that soon we might see the reversal of the trend.
We are looking for another squeeze to happen after what we will be looking for short here, but we might not see that squeeze as well. In that case, we will be looking for proper MSB.
Swallow Academy

$PENGU Breakout!!#PENGU is showing signs of strength after breaking out of the falling wedge and reclaiming the support zone.
🔹 Breakout from wedge confirmed
🔹 Holding above 200 EMA – a sign of strength
🔹 Clean bounce from support zone with rising volume
🎯 Target: $0.0156
🛑 Stop-loss: $0.0110 (below wedge & support)
Structure looks bullish, but wait for a proper retest or follow-through candle before entry.
SL is a must. Let the setup come to you.

PENGUUSDT Breaking Bullish Flag – Eyes on 0.03PENGUUSDT is breaking out of a bullish flag pattern, a classic continuation signal in an uptrend. The breakout is occurring with strong momentum, supported by the RSI crossing above the 50 zone on the 8H timeframe, adding further confidence to bullish bias.
📊 Key Levels:
TP1: 0.382 Fibonacci – $0.020
TP2: 0.5 Fibonacci – $0.025
TP3: 0.618 Fibonacci – $0.030
Stop Loss: $0.012 (below recent swing low)
This breakout may mark the beginning of a new bullish leg. Keep an eye on volume for confirmation and adjust risk accordingly.
Trade safe and always use proper risk management.
#PENGUUSDT #Crypto #BullishFlag #RSI #Fibonacci #Breakout #Altcoins
