PEPE RSI Cools After Overbought Surge — Is a Pullback on the TabPEPE’s market cap currently stands at $3.77B, up 1.59% on the day. After a sharp upward move, the RSI (14) spiked above 75, signaling overbought conditions, and has now pulled back to the 44–58 range, indicating waning bullish pressure.
Quick breakdown:
RSI Peak: ~75.38 (recent top)
Current RSI: ~58.14 (yellow), ~44.81 (purple)
Market Cap Range: $3.35B (low) – $3.77B (current)
Volume: Healthy at $1.24B vs. 30D avg of $685.72M
Unless buyers step in soon to push RSI back above 60, PEPE could retest previous consolidation zones. Watch for RSI holding above 40 as a support line to maintain the uptrend structure.
PEPE trade ideas

PEPE Market Cap Approaches Key Fib Resistance — Will the 0.236 LPEPE’s market cap is testing the 0.236 Fibonacci retracement level ($3.76B) after a strong upward move from ~$2.91B. The price is consolidating near the swing high at $3.91B, indicating possible exhaustion or gearing up for a breakout.
The MACD remains bullish for now, but the histogram shows waning momentum, suggesting caution.
Key insights:
Current Market Cap: $3.83B
Key Resistance: $3.76B (0.236 Fib) and $3.91B (local high)
Support Zone: $3.52B (0.618 Fib level)
MACD: Still in bullish territory, but histogram bars are shrinking
If PEPE breaks and holds above $3.91B with strong volume, the next bullish leg could follow. But a rejection at this level might bring it back toward $3.52B or even $3.42B (0.786). A MACD crossover down would confirm bearish divergence.

MACD Hints at Momentum Shift in PEPE: Bearish Crossover or FakePEPE’s market cap has dipped to $3.82B on the 30-minute chart, and the MACD (12,26) shows a recent bearish crossover. The MACD line has fallen below the signal line, and the histogram has flipped red, signaling potential downside momentum building up.
Observations:
MACD Line: Trending below signal, indicating weakening bullish momentum
Histogram: Expanding red bars support the short-term bearish thesis
Volume: Still strong at $1.24B, above the 30-day average of ~$685M
Support zone: ~$3.05B (recent consolidation low)
If PEPE fails to reclaim $3.88B resistance soon, the bearish crossover may trigger further downside toward $3.05B. Bulls should wait for MACD line to curl back upward or flatten near zero for re-entry confirmation.

PEPE Market Cap Eyes Breakout: Bollinger Band Squeeze Signals MoPEPE’s market cap on the 30-minute chart is entering a classic Bollinger Band squeeze, indicating reduced volatility and a potential breakout on the horizon. The bands have tightened significantly after a period of sideways consolidation, and the price is hovering near the middle band, showing indecision.
Key insights:
Upper Band (Resistance): ~$3.9B
Lower Band (Support): ~$3.05B
Current Market Cap: ~$3.86B, showing a mild bullish lean
Volume Spike: Notable increase in 24h trading volume — $1.24B compared to the 30D average of ~$685M
If the price breaches the upper band with volume support, a short-term upward move could follow. Traders should watch for confirmation via volume surge and sustained breakout candle above $3.9B. A breakdown below $3.05B would invalidate the setup.

PEPE Bullish Reversal? Ichimoku Cloud Signals Potential BreakoutThe Ichimoku Cloud on the 4H chart for PEPE coin shows a compelling shift in momentum. The price recently pierced above the Kumo cloud, with the Tenkan-sen crossing above the Kijun-sen — a classic bullish signal. The Chikou span is free of price action, suggesting confirmation of upward trend momentum.
Key levels:
Support zone: Around 0.0000058 (cloud baseline)
Resistance zone: Around 0.0000072 (previous rejection level)
Entry idea: Consider entries on retest of the cloud top as support
Stop loss: Below the cloud base at 0.0000055
Profit targets: 0.0000072 and 0.0000085 for short to mid-term trades
If PEPE holds above the cloud, we might be witnessing the early stages of a trend reversal. Patience and volume confirmation are key.

PEPE/USD – 30-Min Long Trade Setup !📈 🚀
🔹 Asset: PEPE (Market Cap)
🔹 Timeframe: 30-Min Chart
🔹 Setup Type: Bullish Reversal
📌 Trade Plan (Long Position)
✅ Entry: Above $3.18B (Breakout Confirmation)
✅ Stop-Loss: Below $3.08B (Break of Support)
🎯 Targets:
📌 TP1: $3.30B (First Resistance Level)
📌 TP2: $3.46B (Extended Bullish Move)
📊 Risk-Reward Ratio
📈 Risk: $3.18B - $3.08B = $0.10B
📈 Reward:
✔ TP1: 1:1.2 R/R
✔ TP2: 1:2.8 R/R
🔍 Technical Analysis
📌 Falling Wedge Breakout – Bullish structure forming.
📌 Reversal Signal – PEPE reclaiming support & pushing higher.
📌 Breakout Confirmation – Strong candle close above $3.18B signals further upside.
📉 Risk Management
📊 Confirm Volume – Strong buying pressure above $3.18B before entering.
📈 Trailing Stop – Move SL to entry after TP1 ($3.30B).
💰 Partial Profits – Take 50% at $3.30B, let the rest run to $3.46B.
🚀 Trade smart, follow the plan & manage risk! 🔥 #PEPE #CryptoTrading #PEPEUSDT #BreakoutTrade #CryptoSignals

$PEPE long!🐸 The prophecy foretold this moment! As we gaze upon the sacred TA, the ancient Fibonacci sages whisper—Pepe is at the bottom of the pond, ready to leap to the stars! 🚀
📈 The channel is tighter than Pepe’s grip on his meme kingdom, and the support is holding stronger than Wojak’s coping mechanisms. The green candles are loading—you either ride the wave or cry in disbelief.
The frogs are assembling, the whales are croaking, and the moon is about to get one legendary amphibian richer. 🌕🐸
Not financial advice—just ancient meme prophecy.

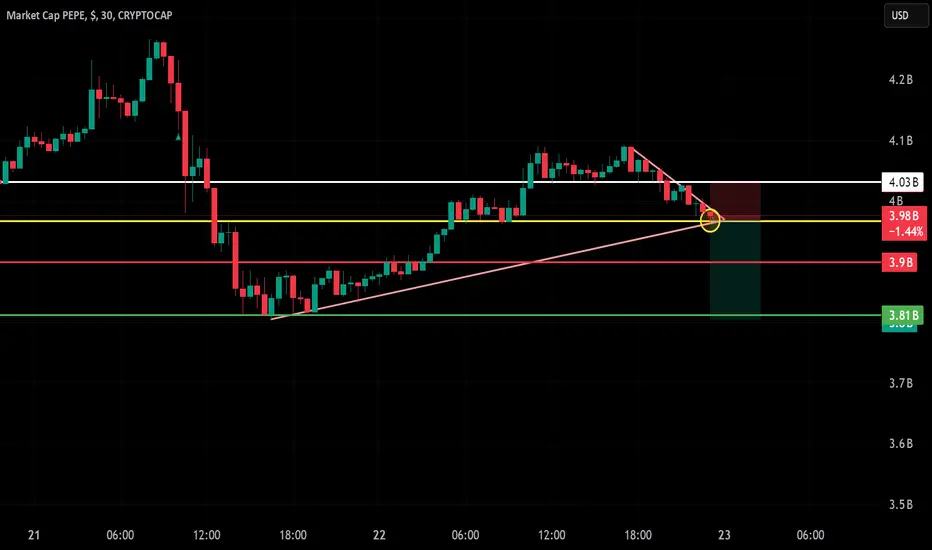
PEPE – 30-Min Short Trade Setup!📌
🔹 Asset: PEPE Market Cap (PEPE)
🔹 Timeframe: 30-Min Chart
🔹 Setup Type: Trendline Break & Bearish Continuation Trade
📌 Trade Plan (Short Position)
✅ Entry Zone: Below $3.97B (Breakdown Confirmation)
✅ Stop-Loss (SL): Above $4.03B (Break of Resistance & Trendline Retest)
🎯 Take Profit Targets
📌 TP1: $3.90B (First Support Level)
📌 TP2: $3.81B (Extended Bearish Target)
📊 Risk-Reward Ratio Calculation
📉 Risk (SL Distance): $4.03B - $3.97B = $0.06B risk per trade
📉 Reward to TP1: $3.97B - $3.90B = $0.07B (1.16 R/R)
📉 Reward to TP2: $3.97B - $3.81B = $0.16B (2.67 R/R)
🔍 Technical Analysis & Strategy
📌 Trendline Breakdown Setup: PEPE has broken below the rising trendline, signaling a shift from bullish to bearish momentum.
📌 Support & Trendline Retest: The price is testing $3.97B, and failure to reclaim it would confirm further downside.
📌 Breakdown Confirmation: A strong bearish candle closing below $3.97B with volume would validate the short trade.
📌 Momentum Shift Expected: If price stays below $3.97B, it could decline further toward $3.90B (TP1) and $3.81B (TP2).
📊 Key Support & Resistance Levels
🔴 $4.03B – Strong Resistance / Stop-Loss Level
🟡 $3.97B – Entry / Breakdown Level
🟢 $3.90B – First Support / TP1
🟢 $3.81B – Final Target / TP2
🚀 Trade Execution & Risk Management
📊 Volume Confirmation: Ensure strong selling volume below $3.97B before entering.
📉 Trailing Stop Strategy: Move SL to entry ($3.97B) after TP1 ($3.90B) is hit.
💰 Partial Profit Booking Strategy:
✔ Take 50% profits at $3.90B, let the rest run to $3.81B.
✔ Adjust Stop-Loss to Break-even ($3.97B) after TP1 is reached.
⚠️ Fake Breakdown Risk
❌ If price closes back above $3.97B, it could indicate a fake breakdown—exit early.
❌ Wait for a strong candle close below $3.97B for confirmation before entering aggressively.
🚀 Final Thoughts
✔ Bearish Setup – Breaking below $3.97B could lead to lower targets.
✔ Momentum Shift Possible – Watch for volume confirmation.
✔ Favorable Risk-Reward Ratio – 1:1.16 to TP1, 1:2.67 to TP2.
💡 Stick to the plan, manage risk, and trade smart! 🚀🏆
🔗 #CryptoTrading #PEPE #BreakdownTrade #TechnicalAnalysis #MarketTrends #ProfittoPath #DayTrading #MomentumTrading #SwingTrading #TradingView #ShortTrade #TradeSmart #RiskManagement #CryptoBreakdown #Investing #CryptoAlerts #ChartAnalysis 🚀📉
PEPE – 30-Min Long Trade Setup!📌
🔹 Asset: PEPE Market Cap (PEPE)
🔹 Timeframe: 30-Min Chart
🔹 Setup Type: Rising Wedge Breakout & Trendline Support Long Trade
📌 Trade Plan (Long Position)
✅ Entry Zone: Above $4.22B (Breakout Confirmation)
✅ Stop-Loss (SL): Below $4.13B (Break of Support & Trendline)
🎯 Take Profit Targets
📌 TP1: $4.33B (First Resistance Level)
📌 TP2: $4.45B (Final Target – Extended Bullish Move)
📊 Risk-Reward Ratio Calculation
📈 Risk (SL Distance): $4.22B - $4.13B = $0.09B risk per trade
📈 Reward to TP1: $4.33B - $4.22B = $0.11B (1.22 R/R)
📈 Reward to TP2: $4.45B - $4.22B = $0.23B (2.55 R/R)
🔍 Technical Analysis & Strategy
📌 Rising Wedge Breakout Setup: Price has broken above the wedge resistance, indicating bullish strength, but a wedge formation can also indicate a potential pullback if volume declines.
📌 Trendline & Support Bounce: Price is holding above the ascending trendline, confirming strong buyer support.
📌 Breakout Confirmation: A strong bullish candle above $4.22B with increasing volume would validate the breakout.
📌 Momentum Shift Expected: If price holds above $4.22B, a rally toward $4.33B (TP1) and $4.45B (TP2) is likely.
📊 Key Support & Resistance Levels
🟢 $4.13B – Strong Support / Stop-Loss Level
🟡 $4.22B – Entry / Breakout Level
🔴 $4.33B – First Resistance / TP1
🟢 $4.45B – Final Target / TP2
🚀 Trade Execution & Risk Management
📊 Volume Confirmation: Ensure strong buying volume above $4.22B before entering.
📈 Trailing Stop Strategy: Move SL to entry ($4.22B) after TP1 ($4.33B) is hit.
💰 Partial Profit Booking Strategy:
✔ Take 50% profits at $4.33B, let the rest run to $4.45B.
✔ Adjust Stop-Loss to Break-even ($4.22B) after TP1 is reached.
⚠️ Fake Breakout Risk
❌ If price breaks below $4.13B, it could indicate a bearish reversal from the rising wedge—exit early.
❌ Wait for a strong candle close above $4.22B for confirmation before entering aggressively.
🚀 Final Thoughts
✔ Bullish Setup – Holding above $4.22B could lead to higher targets.
✔ Momentum Shift Possible – Watch for volume confirmation.
✔ Favorable Risk-Reward Ratio – 1:1.22 to TP1, 1:2.55 to TP2.
💡 Stick to the plan, manage risk, and trade smart! 🚀🏆
🔗 #CryptoTrading #PEPE #BreakoutTrade #TechnicalAnalysis #MarketTrends #ProfittoPath #DayTrading #MomentumTrading #SwingTrading #TradingView #LongTrade #TradeSmart #RiskManagement #CryptoBreakout #Investing #CryptoAlerts #ChartAnalysis 🚀📈


PEPE Coin CMP 4.3
A massive $14.31K in long positions just got liquidated at $0.00937, sending shockwaves through the market! The meme coin rally took a hit, shaking out overleveraged traders

PEPE Pepe coin 24hr potterbox update.PEPE Pepe coin 24hr potterbox update. well it has bounced off of the support $4.82 billionish and is heading for the 50 percent line or cost basis. the empty space to the left is still there. and it made that space up over a period of time. History repeating itself . over and over . follow the patterns and you to can see history repeat itself. Happy Trading.

PEPE Pepe coin 24hr potterbox update.PEPE Pecoin 24hr potterbox. UPDATE Well, pepe coins made up every bit of the empty space I had marked to the left. It went right thru the floor of the box and headed south. it also looks like its heading to that last arrow. 4.92 billion ish. I would like to say that it will hopefully find support at that level but i think the support might be a little sooner around where the price is at now. And bottom out. I will keep an eye on this. but it is making up the empty space marked to the left. Happy trading.

PEPE Coin 24hr potterbox updatePEPE Coin has broken thru the floor$7.04billion. of the box and is now in empty space I marked it with an arrow and text. keep a close eye on the coin . It could drop fast. It's dropping close to the 200 day moving Average and could go lower $4.82 billion is the first support . When you use lower time frames you can get a better view of where it's going. Happy trading. Just my opinion.


PEPE Long Trade Setup: Targeting Big Gains!!🚀📈 💹📊
Caption/Notes for Posting:
"🚀 Long Trade Setup for PEPE
Entry: 6.79B 📥
Stop Loss: 6.5B 🛑
Target 1: 7.15B 🎯
Target 2: 7.62B 🎯
🔥 Expecting a bounce-back from key support! Stay sharp and trade wisely. 💰📈
📌 Hashtags:
#CryptoTrading #LongSetup #PEPE #CryptoAnalysis #TradingSignals #CryptoInvesting #Altcoins #SupportAndResistance #TradeSmart #Cryptocurrency"

PEPE Coin 24hr potterboxPEPE Coin 24hr potterbox. As you can see PEPE is trading under the 50 percent or cost basis. 9.12 billionish. but it is still above the 200 day moving average. it has a little noise to the left which could easily rocket thru that. we shall see where this is going. Happy trading.

PEPE Coin 24hr potterboxesPEPE Coin 24hr potterboxes. well pepe is trading on the floor of the box 7.09 billion ish. It's trading sideways in my opinion, and we will keep an eye on it. This will be the third attempt at breaking through the floor. If it breaks through the floor, it will be heading south due to the empty space to the left. the only thing left is when Trump takes power. Everything is supposed to go up due to the incoming digital coin friendly President. We shall see.

PEPE Coin 24hr potterboxPEPE Coin 24hr potterbox. well the pepe coin is trading sideways. as you can see it is staying inside the box. we will keep a eye on it for out of the box moves.

PEPE coin 24hr potterboxes with channel PEPE Coin 24hr potterboxes with channel. As we can see in the picture, the PEPE coin broke thru both top and floor of both boxes and is heading south. it might stop at the 50 percent line 7.75B . If it doesn't stop there the next stop would be the floor of the bottom box. 7.29B. and finally if it breaks thru the floor of the lower box it will freefall to 4.63 Billion. The first green candle to the left. I have it marked also. Well we shall see where it goes. Happy Trading.

Weekly CLS, Key Level Order block, Model 1Weekly CLS, Key Level Order block, Model 1
you are welcome to comment with your thoughts and share your charts or questions below, I like any constructive discussion.
What is CLS?
This company is trading for the biggest investment banks and central banks. They trade over 6.5 trillion daily volume. They are smart money of the all markets.
CLS operates in the specific times which will give you huge advantage and precisions to you entries. Focus on that. Its accuracy is amazing.
Good luck and I hope this educational post helps to become better trader
“Adapt what is useful, reject what is useless, and add what is specifically your own.”
Dave FX Hunter ⚔

PEPE coin 24hr potterboxsPEPE Coin 24hr potterboxes . In this view you can see pepecoin sitting on the 50 percent line 8.61 billion ish or cost basis of the upper box if it breaks this level it could possibly go on down further to 8.19 billion ish . we will wait and see where it goes. it could go to 8.57 billion ish. That's where all the volume is as you can see by the table on the right. if you go to a shorter time frame you can see the direction of travel better. I use the 4hr and 1hr time frames to trade with. utilizing a little longer expirations on my options trades. Happy Trading.

PEPE coin 4hr potterbox with channelPEPE 4 hr time frame with a 24 hr potterbox. With the 4hr time frame with a 24hr box gives you the direction that it is taking. I put a channel marking the uptrend . Happy Trading
