PEPE Short Trade Setup !
🚀 Entry: $8.9B (Breakdown confirmation from yellow zone).
🎯 Target 1 (T1): $8.52B (First key support level).
🏁 Target 2 (T2): $8.01B (Major support level).
🔴 Stop Loss (SL): $9.2B (Above resistance and invalidation of the breakdown).
PEPE trade ideas

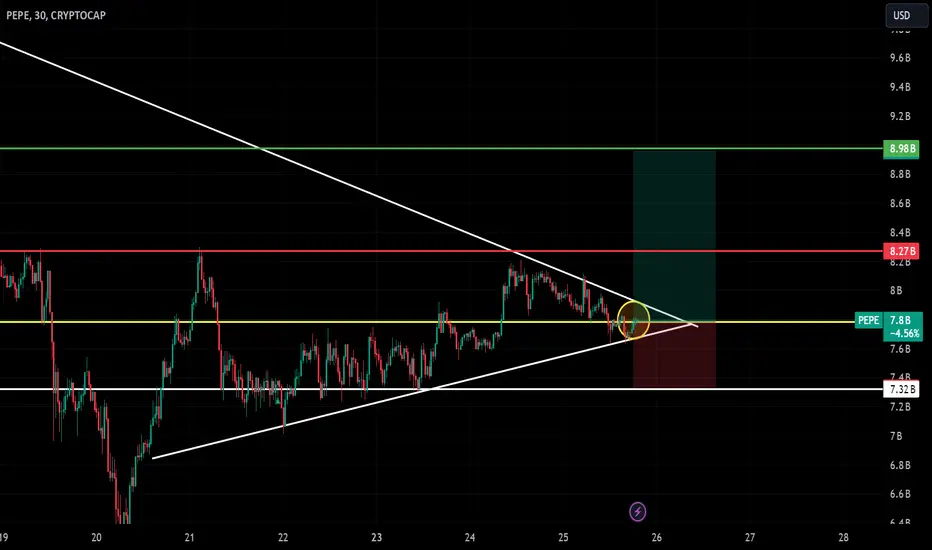
PEPE: Triangle Breakout Setup!Updated Long Position Setup:
Based on an **entry level of $7.79 B**, here is the revised long position strategy:
**Key Levels for Long Position:**
1. **Entry Point:**
Enter a **long position** at **$7.79 B** (current price or confirmed breakout above).
2. **Stop Loss (SL):**
Place your **stop loss** below the recent support or lower trendline at **$7.32 B** to manage risk effectively.
3. **Take Profit (Targets):**
- **Target 1 (T1):** **$8.27 B** (immediate resistance level).
- **Target 2 (T2):** **$8.98 B** (potential breakout level above resistance).
**Trade Management:
- Monitor the breakout carefully; confirmation occurs if the price closes above **$7.79 B** with increased volume.
- Once the price hits **$8.27 B**, adjust your stop loss to **breakeven ($7.79 B)** to secure the trade.
- If momentum is strong, aim for the second target at **$8.98 B**, locking in partial profits along the way.
PEPE Trading Plan: Triangle Breakout Setup with Key Levels! 🚀📊
### **Description:**
This chart for **PEPE (Cryptocurrency)** showcases a symmetrical triangle breakout pattern, presenting a promising trade setup with defined risk and reward levels:
- **📍 Entry Zone**: **$7.36B** (Yellow Line) — A critical support level aligning with the breakout zone of the triangle.
- **❌ Stop Loss (SL)**: **$6.84B** (White Line) — Placed below the key trendline to limit downside exposure.
- **🎯 Target 1 (T1)**: **$8.14B** (Red Line) — The first profit target at a significant resistance level.
- **🏆 Target 2 (T2)**: **$9.08B** (Green Line) — The second profit target, aligning with recent highs, offering extended gains.
### **Why This Chart is Important:**
1. **Symmetrical Triangle Setup**:
- A textbook continuation pattern that often leads to strong breakouts, making this an ideal opportunity for momentum traders.
2. **Defined Risk-Reward Ratio**:
- With a tight stop loss at **$6.84B** and high reward potential, this trade offers an excellent balance of risk management and profit-taking opportunities.
3. **Market Sentiment**:
- PEPE’s price movement can influence other small-cap cryptocurrencies, making this an important chart for sentiment tracking.
### **Conclusion:**
This setup provides a clear trading opportunity as PEPE consolidates near a breakout point at **$7.36B**. A bullish breakout could target **$8.14B (T1)** and **$9.08B (T2)**, while a strict stop loss at **$6.84B** minimizes risks. Monitor price action closely for confirmation of the breakout. 🚀📈

PEPE Symmetrical Triangle Breakout or Breakdown!### **Trade Setup for PEPE**
- **Entry**: $8.38B (yellow line - current price level)
- **Stop Loss (SL)**: $8.08B (white line - support zone)
- **Target 1 (T1)**: $8.85B (green line - first resistance level)
- **Target 2 (T2)**: $9.42B (red line - next major resistance)
**Summary**: Watch for a breakout or breakdown confirmation. This symmetrical triangle setup offers a clear risk-to-reward trade with defined entry, stop loss, and targets. 📊 🚀
#PEPE #CryptoTrading #TechnicalSetup #TradeIdeas

PEPE coin 24hr potterboxesPEPE Coin 24hr Potterboxes. well pepe looks like it is on the floor of one box and on the top of another. Maybe it will bounce here. we will see.

Strategic Trade Setup: Entry, Targets, and Risk Management!a clear plan for entry, exit, and risk management. Here's a summary of your trade setup:
1. **Yellow Line (Entry Point)**:
- **Price Level**: 10B
- **Action**: Entry into the trade after confirming a breakout.
2. **Red Line (Take Profit 1 - TP1)**:
- **Price Level**: 10.2B
- **Purpose**: Secure partial profits at this safer, more conservative target.
3. **Green Line (Take Profit 2 - TP2)**:
- **Price Level**: 10.44B
- **Purpose**: Maximize potential gains if the upward trend continues.
4. **White Line (Stop Loss - SL)**:
- **Price Level**: 9.82B
- **Purpose**: Limit losses by exiting the trade if the price moves against your setup.
This structured trade setup demonstrates a balanced approach, focusing on capturing profits while minimizing risk. The entry point aligns with a breakout confirmation, and the take-profit levels allow for progressive profit-taking based on market performance. The stop-loss level ensures disciplined risk management.


PEPE/USD: Entry $9.99B & SL $9.75B!This chart illustrates a PEPE/USD trade setup on a 30-minute timeframe. The entry point is set at $9.99B, with a stop-loss (SL) at $9.75B to mitigate risk. The setup includes two profit targets:
Target 1 (T1): $10.26B
Target 2 (T2): $10.63B
The trade is based on a potential breakout above the descending trendline, aiming to test key resistance levels. This setup ensures a favorable risk-to-reward ratio while capitalizing on upward momentum.

PEPE MCAP - Bull Breakout SuggestionThis upper trend line of the channel has been tested twice before with this time being the third and possibly the one to break the channel.
The curved / bowl pattern also suggests a further break out for PEPE
Memecoin vibes on this 4Hr chart.
Bars pattern I have plotted is speculative

PEPE Breaks Out and Hits First Target with Strong Momentum!PEPE successfully broke out of the symmetrical triangle, gaining momentum and reaching its first target. A clean breakout above key resistance levels showcased bullish strength, providing a great opportunity for traders. Keep an eye on the next resistance for potential continuation!

PEPE Breaking Out of Symmetrical Triangle – Targeting $12.17B!PEPE is forming a classic symmetrical triangle pattern, signaling a potential breakout. The price is consolidating near the upper trendline, with bullish momentum building up.
🔑 Key Highlights:
A breakout above the resistance level could push the price toward the target at $12.17B.
Strong support is holding at $10.13B, maintaining the bullish structure.
Volume confirmation will be key to validating the breakout.
📊 Keep an eye on this setup for a strong move in either direction. Manage your risk wisely and trade smart! 🚀📈

PEPEas it has observed a huge spike, there's been a couple of minor corrections, and a v-formation. there's still some potential to see this coin go a bit higher for a quick long position

LONG PEPE IDEAI am long term bullish on pepe , due to bullish PA across all higher timeframes,including engulfing on 3m.
Here is my short term analysis
Price broke out of descending counter trendline, price to bounce back to the previous resistance level as support, possibly 38.20 fib level and structure confluence, targeting 61.8 zone
Opinions?

PEPE - MEME OUTLOOKPEPE is poised to begin the 5th super wave marking a potential 100% in our next 2 candles on the Monthly
