Sell Opportunity Pepe has been moving within a bearish flag, and now the sell opportunity is almost ripe.
An aggressive trader can entry after a breakout to the downside and hold to 0.00000749.
Or
If you are a conservative trader, wait for a breakout and retest before you enter. Once that happens, enter you sell

PEPE is cooking something!⚡️ Hello, everyone! Today I noticed a catastrophic gap: so much time has passed, and I still haven't written about PEPE!
With the emergence of hundreds of thousands of new memecoins, the old ones seem to have disappeared into oblivion. B ut is that really the case, and does PEPE still have a chan

PEPE SHORT Despite all the recent buzz about an alt-season, I don’t think the market is quite ready yet. PEPE is currently following the downtrend resistance line, which suggests the trend is likely to persist. A key level to consider for taking profits is around 0.0000079 — a significant price point for PEPE

Skeptic | PEPE : Spot & Futures Triggers for Maximum EdgeWelcome, traders, its Skeptic! Ready to dissect PEPE’s next moves? I’m diving into a pro-level analysis of PEPE, the #30 crypto and 3rd largest meme coin with a $4.08B market cap. This Analysis delivers a comprehensive breakdown—quick facts, 2025 performance, community strength, and technical tri


Lingrid | PEPEUSDT Inverse Head and Shoulder. Bullish Reversal ?BINANCE:PEPEUSDT is forming a potential reversal setup after rebounding from the 0.00000876 support within a well-defined downward channel. Price action shows signs of accumulation with a right shoulder (RS) formation and a potential breakout brewing above the descending blue trendline. A clean pus

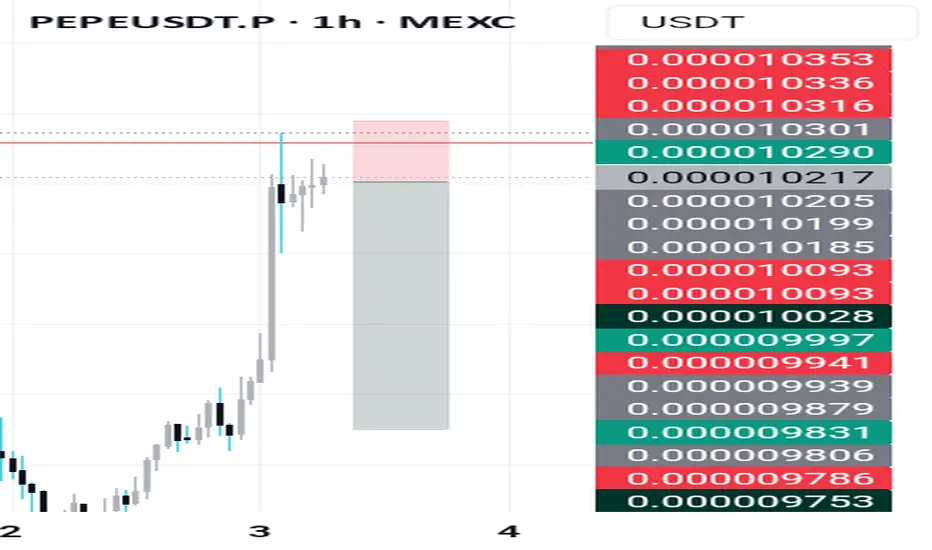
Will PEPE/USDT Reach $0.000011?PEPE coin is showing signs of technical strength amid renewed crypto market optimism. It is currently trading around $0.000009890 with a modest rise of over 1.69% in the past 24 hours but still remains within a tight consolidation range. This hints towards a potential breakout, offering a potential

Pepe long ideaI like the fact it broke out on all HTF.
Will be adding small position on 4h close.
It did retrace on 4h TF, kind of.
On daily still needs to.
Any ways, last plays were beautifully executed, let us see how it goes on this one.

$PEPE Holding Support, Eyes on 70% UpsideCRYPTOCAP:PEPE is holding strong at support and forming a bull flag on the 12H chart.
A breakout could send it 70% higher toward 0.000017.
Clean setup, watching closely.
DYOR, NFA.
#PEPE

See all ideas
Summarizing what the indicators are suggesting.
Oscillators
Neutral
SellBuy
Strong sellStrong buy
Strong sellSellNeutralBuyStrong buy
Oscillators
Neutral
SellBuy
Strong sellStrong buy
Strong sellSellNeutralBuyStrong buy
Summary
Neutral
SellBuy
Strong sellStrong buy
Strong sellSellNeutralBuyStrong buy
Summary
Neutral
SellBuy
Strong sellStrong buy
Strong sellSellNeutralBuyStrong buy
Summary
Neutral
SellBuy
Strong sellStrong buy
Strong sellSellNeutralBuyStrong buy
Moving Averages
Neutral
SellBuy
Strong sellStrong buy
Strong sellSellNeutralBuyStrong buy
Moving Averages
Neutral
SellBuy
Strong sellStrong buy
Strong sellSellNeutralBuyStrong buy
Displays a symbol's price movements over previous years to identify recurring trends.