Pepe - Parallel Chanel Local Monthly Feb RangeThe only thing I can come up with other than a "Magic Pill" is to follow the trend. Follow the short term trend.
Based on this analysis:
PEPEUSDT.P trade ideas

Pepe Fibs 0.5 technical's from way way back :) As can be seen sometimes fibs can be drawn from way back. 0.5. Finding support.

Pepe -- Why I'm all In!Speed fan Resistance 0.75 support! :) Massive. Guys, trust me, you dont want to not be in right now. Hold :) .
Pepe Resistance v SupportAnchored vWap from last highest high as resistance. Support Speed Fan Resistance 0.75 Simple. An point of Control

Pepe Volume ProfilesPepe Volume Profiles from beginning of time to now and volume profile from Last low to highest high.

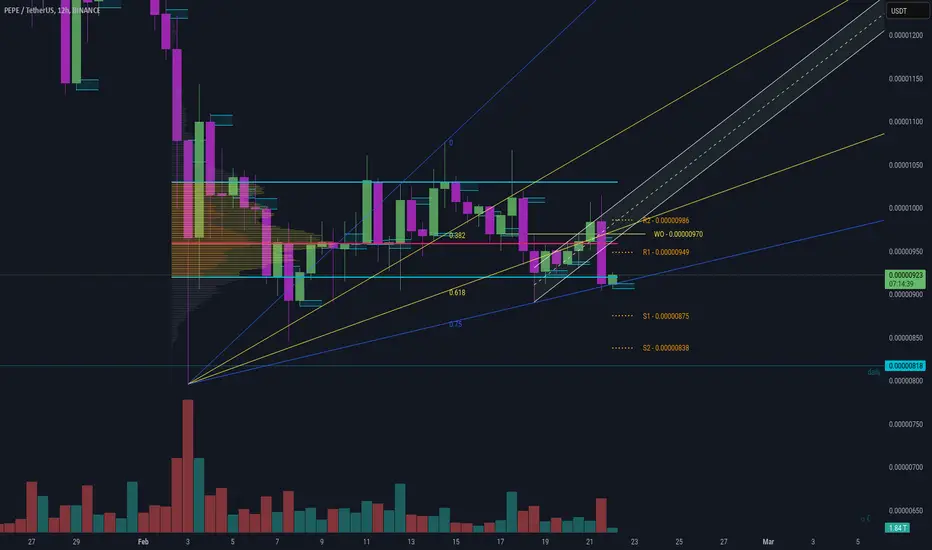
Pepe - Bullish - Trend based fib levelsTrend based fib levels from previous lowest low to high to low (current).
2.0 extension and value area high from range pulled
Note: doesn't mean we cant go lower. Trade with caution!

Pepe USDT Day Trading Idea 1 March 2025Pepe USDT Day Trading Idea
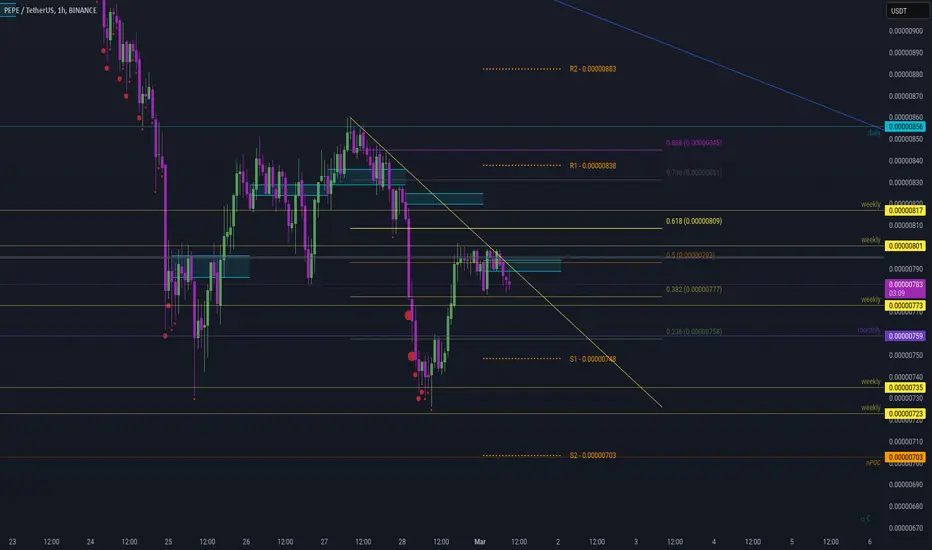
Fib drawn from high to low of the rane were currently in. Obvious rejectioon at 0.5 and forming a Triangle Pattern if you will.
Day idea 1:
Possible 0.236 support with monthly as a backup at that level or S1 at 0.0000748. Trend reversal from suppoort with a possible high between 0.382 and 0.888 or R1 at 0.0000838. If S1 is hit be aware of the monthly being resistance at 0.236.
Day idea 2:
Possible S2 at 0.0000703 which fulfills the larger range Butterfly Gartley depicted in previous post posted here for reference.
For S and R levels I'm using the "Day Trading Booster BY DGT". Great indicator for day trading levels.
Pepe Guess the Trend BullishHey guys, for fun and in a way, I think it's always to get in on a move early. Up trend channel with supports on weekly.
Now yes I'm sure the same can be drawn from top down. I think it's important when trading not to get stuck on what you know or thin you know.
Always searching and not thinking you know what will happen is a good thing. AKA because no one knows. You only know what you know based on the data.
For example: Here after drawing the channel I can see that there is a weekly support at the bottom of the channel. Probable, support for higher momentum.
This way we're not blindly using Valid Chart patterns such as descending channels, triangles, etc but using levels we're aware of to make the best of them. Ultimately giving us the ability to make the best probable trade.

Pepe Triangle ResistanceHey guys, be away of the triangle resistance on pepe . Trade cautiously <3
This idea correlated with the recent ideas:
and:

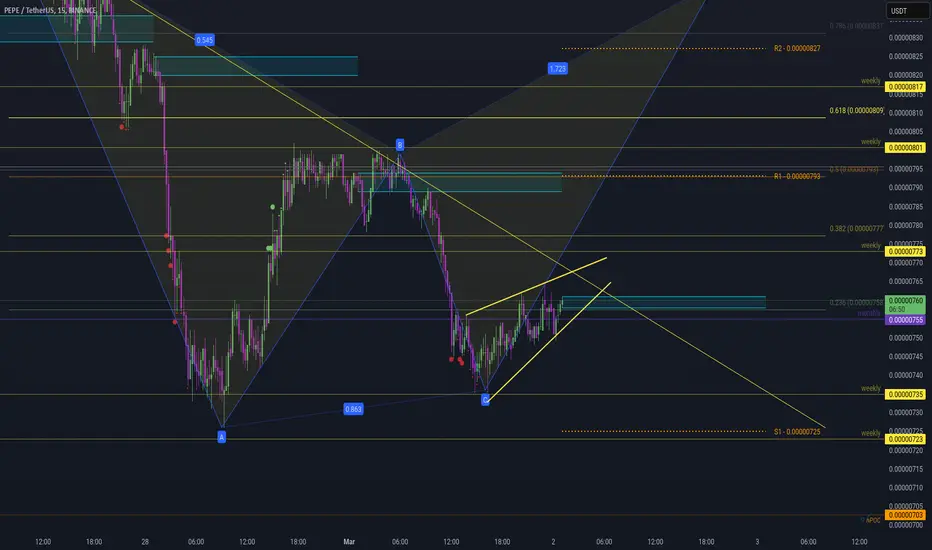
Pepe Bearish Bat Harmonic BUT into a Bullish Gartley with FibExThis might blow our minds.
Bearish BAT Harmonic to 0.5 playing out to possibly the red C wave retracement 0.382 BUT at the same time being the 0.618 from X to A leading into a bullish Gartley! Bullish gartley B to C can reject at 0.382, 0.5, 0.618 or 0.888 depicted is at 0.618. For a retracement back to a D.
Fib retracement from X to A to D gives a high range of the Butterfly Harmonic posted here:
This corresponds with BTCUSDT Gartley Harmonic which gave me this idea posted here:
Just an idea as it's very early but its an idea! So to be clear, the Bat Gartley (RED) needs to play out first before the Gartley Harmonic (Green) plays out.
Happy trading, trade with risk management and all that.

SellPrice form drop base drop and it is now going to our base let keep watching and sel when it is there

Key Resistance Zone for Pepe – 40% Drop Ahead?Hello and greetings to all the crypto enthusiasts, ✌
All previous targets were nailed ✅! Now, let’s dive into a full analysis of the upcoming price potential for Pepe 🔍📈.
Pepe Meme Coin is experiencing an unusual sharp downtrend, approaching a critical monthly resistance zone. If this level breaks, the price could drop another 40% to the 0.00000400 support area, which has historically acted as strong defense. The key question now is whether this support can withstand the selling pressure in the coming days.📚🙌
🧨 Our team's main opinion is: 🧨
Pepe Meme Coin is in a sharp downtrend, facing key resistance, with a potential 40% drop if support at 0.00000400 fails. 📚🎇
Give me some energy !!
✨We invest hours crafting valuable ideas, and your support means everything—feel free to ask questions in the comments! 😊💬
Cheers, Mad Whale. 🐋

Breaking: The $PEPE X Account Has Been CompromiseThe CRYPTOCAP:PEPE team took to their telegram community to announced that the official X (Formerly Twitter) account has been compromise. Needless to say that the token was already down 3.54% as of the time of writing. With the RSI sitting at 36 more selling pressure could surmount.
What Is PEPE?
PEPE is a deflationary memecoin launched on Ethereum. The cryptocurrency was created as a tribute to the Pepe the Frog internet meme, created by Matt Furie, which gained popularity in the early 2000s.
The project aims to capitalize on the popularity of meme coins, like Shiba Inu and Dogecoin, and strives to establish itself as one of the top meme-based cryptocurrencies. PEPE appeals to the cryptocurrency community by instituting a no-tax policy and being up-front about its lack of utility, keeping things pure and simple as a memecoin
Pepe Price Live Data
The live Pepe price today is $0.000007 USD with a 24-hour trading volume of $454,987,385 USD. We update our PEPE to USD price in real-time. Pepe is down 4.22% in the last 24 hours, with a live market cap of $2,861,929,455 USD. It has a circulating supply of 420,689,899,653,544 PEPE coins and a max. supply of 420,690,000,000,000 PEPE coins.

PEPE BUY (UPDATE)hello friends
Considering the recent drop, the price has now returned well and it can be said that buyers are coming in little by little...
Now we have identified the good support points for you, which you can buy stepwise and with capital management.
*Trade safely with us*

PEPE UPDATE : AGAIN BUYhello friends
Due to the fall of this currency, we are now at the price floor and good conditions have been provided for buying, of course, with capital and risk management...
*Trade safely with us*

Lingrid | PEPEUSDT the "Dead Cat Bounce" in the MarketsThe price perfectly fulfilled my previous idea . It reached the target. BINANCE:PEPEUSDT market initially took liquidity above the range zone before pulling back and making a lower low. The entire crypto market appears to be experiencing a "dead cat bounce." On the monthly timeframe, the price formed a significant bearish candle, indicating a potential further downward move. I think that the price will retest the middle of the range zone, as it often acts as a support or resistance level and then push lower September low. My goal is support zone around 0.00000585
Traders, if you liked this idea or if you have your own opinion about it, write in the comments. I will be glad 👩💻

Pepe Butterfly Gartley UpdateHey guys, Pepe Butterfly Gartley just hit the target low at (D) which is now extended to 1.618 if the target is probably hit.
For S and R levels I'm using the "Day Trading Booster BY DGT". Great indicator for day trading levels.
Target high on D retracement back to (A) top of the range.
This is an update that originally started here:
This idea also goes with my posted idea "Pepe USDT Day Trading Idea 1 March 2025".

Pepe Bat Gartley 1 March 2025Hey guys, the recent move and supprt from my previous post:
Now looking at a Bat Harmonic if we keep support with a probable high at 0.888. Range high.
This idea correlated with the recent ideas:
and:
and:

Pepe USDT Rising WedgeHey guys, rising wedge .. trading 101 .. :P
At least to the lowest low of the range to retest the weekly?
PEPEUSDT CHART ANALYSİS - EDUCATIONAL POSTThe NFT Concept
You may already know that each unit of value in a blockchain is called a token. In an open blockchain, all tokens are equal and interchangeable. For example, one bitcoin can be easily replaced with another, and nothing will change.
Non-fungible tokens are a game-changer, which work differently. An NFT is a digital asset that cannot be replaced with another token without changing the value and basis of the object.
Like cryptocurrency, NFTs are created on a blockchain, which acts as a database to record all transactions. The blockchain guarantees the uniqueness, safety, and anonymity of non-fungible tokens. Thanks to this system, any user can verify the originality and transparency of the history of a particular NFT through the blockchain.
When you buy an NFT token, you are obtaining a certificate for a digital or real object. However, the work itself doesn’t move anywhere. You only use its digitized file or a certificate of ownership. Once created or purchased, the token sits in perpetual storage. This certificate is just lines of code that confirm it is the token owner who has the original copy of the object.
An NFT token can be compared to a painting, which may belong to a gallery, museum, or individual, but the audience can see it in a catalog or exhibition.
NFT tokens are sold in online marketplaces that operate like Amazon. The creators put them on marketplaces and wait for bids from buyers.
An NFT token can be created by you or by anyone for that matter. To do this, you need to take a digital object (picture, music, photo, etc.), register in a particular marketplace on a platform such as Rarible or OpenSea, and upload the object with a description and price. You will have to pay a fee for creating a blockchain entry on many platforms. However, the costs pay off in most cases, as NFTs are #1 in the crypto world today.

PEPE, my notes for long-termThe price has fallen to the lowest point it can fall, if these levels are lost we can say that the upward movement will not continue. There does not seem to be a problem in the long term for now. The price may go up and down between the levels of .08 and 0.11 for a while. The first target for closing above 0.11 is .21; this is important. If .21 is not passed, a new ATH cannot be expected, the price may even come back to its current levels again. When the .21 0.618 fib level is passed, I expect Pepe to make a new ATH and also reach the flag target level of .41 dollar
In a nutshell; important levels .08 - .11 - .21 - .28 - .41
Not investment advice.

PEPE/USDT Breakout Watch: Key Level to Trigger a Bullish SurgeKey Level Analysis
The phrase "if the price closes above this level then" suggests a confirmation level that must be broken for an upward move.
The highlighted level seems to be an area of previous support-turned-resistance (around 0.00001150 - 0.00001200 USDT).
If the price closes above this level on the weekly timeframe, it signals:
Breakout confirmation → Likely leading to a strong bullish rally.
Trend reversal → A shift from bearish to bullish structure.
Momentum entry point → A trigger for potential buy positions.
Potential Price Movement
If the weekly close is above the key level:
The price could rally significantly (illustrated by the large blue arrow).
Next resistance levels could be around 0.00001700 - 0.00002200 USDT.
If the price fails to close above the level:
It could mean a continuation of the downtrend.
Retesting lower support areas around 0.00000650 - 0.00000550 USDT.

Pepe large time frame PoC 1 March 2025Fixed Range Volume Profile from Sunday 3 November 2024 1am. At the moment we're at the VaL (Value Area Low) BUT resistance at the PoC (Point of Control).
Having said that, this is on a 12 hour chart. Momentumm looks weak. Trade cautiously.
Zoom out for all Volume Profiles that I'm using.
By low, sell high is what they say. In this case were at a low.
This idea correlated with the recent ideas:
and:
