PepeHi guys
1. **Price Data**:
- **Current Price**: **0.00001223 USDT** (+6.72% daily gain), reflecting significant volatility and speculative interest typical of meme coins.
- **Bid/Ask Spread**: **0.00001222 (Bid)** vs. **0.00001223 (Ask)**, with a minimal spread of **0.00000001 USDT**, indicating high liquidity despite PEPE’s niche status.
2. **Order Book Dynamics**:
- **Supply (Resistance)**: Sell orders cluster at **0.00001500**, **0.00001900**, and **0.00002500 USDT**, forming critical resistance levels.
- **Demand (Support)**: Buy orders at **0.00001000** and **0.00000800 USDT**, acting as psychological and technical support zones.
3. **Technical Indicators**:
- **RSI Value**: The number **88** (if representing the RSI) signals **overbought conditions**, suggesting a potential short-term correction.
- **Value "24"**: Possibly a volume or momentum indicator, though context is limited.
4. **Market Context**:
- **Long-Term Dates** (e.g., Oct 2025): Likely referencing futures/options expiries or long-term trend analysis, similar to BTC/ETH charts.
- **Meme Coin Volatility**: PEPE’s +6.72% surge aligns with its high-risk, sentiment-driven nature, often detached from fundamentals.
---
### **Interpretation**
- **Bullish Momentum**: The sharp price increase highlights speculative buying, possibly driven by social media trends or market hype.
- **Key Levels**:
- **Upside**: A break above **0.00001500 USDT** could target higher resistance at **0.00001900 USDT**.
- **Downside**: A drop below **0.00001000 USDT** may trigger profit-taking, testing **0.00000800 USDT** as stronger support.
- **Caution**: The overbought RSI (88) and resistance levels suggest a high risk of pullback. Meme coins like PEPE often experience rapid reversals.
---
### **Conclusion**
Traders are likely capitalizing on PEPE’s volatility, balancing short-term gains against technical warnings (e.g., overbought RSI). The **2025 timeframe** hints at strategic positioning, though meme coins are generally traded for short-term speculation. Immediate focus should be on resistance at **0.00001500 USDT** and the risk of profit-taking near overbought conditions.
PEPEUSDT.P trade ideas

PEPE Chart Analysis 💰 #PEPE CRYPTOCAP:PEPE 🚀
Bullish setup forming as the price approaches the support zone 🐃
A breakout from the descending channel could signal strong upside potential!
🎯 Target 1: $0.00002107
🎯 Target 2: $0.00002738
🎯 Target 3: $0.00003394
@Whalesdesk

Pepe price goes wellAs matter of fact Pepe price goes down well enough for short term and hope to rise for a few days to level which is pointed or chart

PEPE/USDT 1H: Bulls Target $0.00001500 After Key Accumulation !PEPE/USDT 1H Chart Analysis
🚀 Follow me on Tradingview if you respect our charts 📈
Market Condition:
Consolidation after a sharp decline, showing signs of accumulation around $0.00001299.
RSI: Bullish divergence from oversold territory, suggesting potential upward momentum.
Volume Profile: Indicates smart money activity at current levels.
Key Levels:
Entry Zone: $0.00001299-$0.00001310
Targets:
T1: $0.00001400 (previous support turned resistance).
T2: $0.00001500 (major psychological level).
Stop Loss: Below $0.00001250 (recent low).
Smart Money Analysis:
Accumulation visible in the discount zone.
Hidden Bullish Divergence: Forming on RSI, supporting a potential reversal.
Fair Value Gap (FVG): Above $0.00001400, likely to act as a magnet for price.
Risk Score: 6/10
Moderate risk due to recent volatility, but reversal signals are promising.
Recommendation:
Long position within the $0.00001299-$0.00001310 range.
Watch for volume confirmation as price approaches $0.00001400.
Keep position sizes conservative to manage risk effectively.
Confidence Level: 7/10 for bullish reversal potential.
🚀 Follow me on Tradingview if you respect our charts 📈

PEPE PEPEUSDT Swing Long Trade SetupHello,
Price Action Analysis Interprets Market Movements Using Patterns And Trends On Price Charts.
👉👉👉Check Below Details For Live Market Views/Trades/Analysis/News Updates.

Pepe - Ending Diagonal to End Wave 3/5Depicted here is looking for an "Ending Diagonal" to end what's probably the end of Wave 3 or Wave 5.
Larger picture:

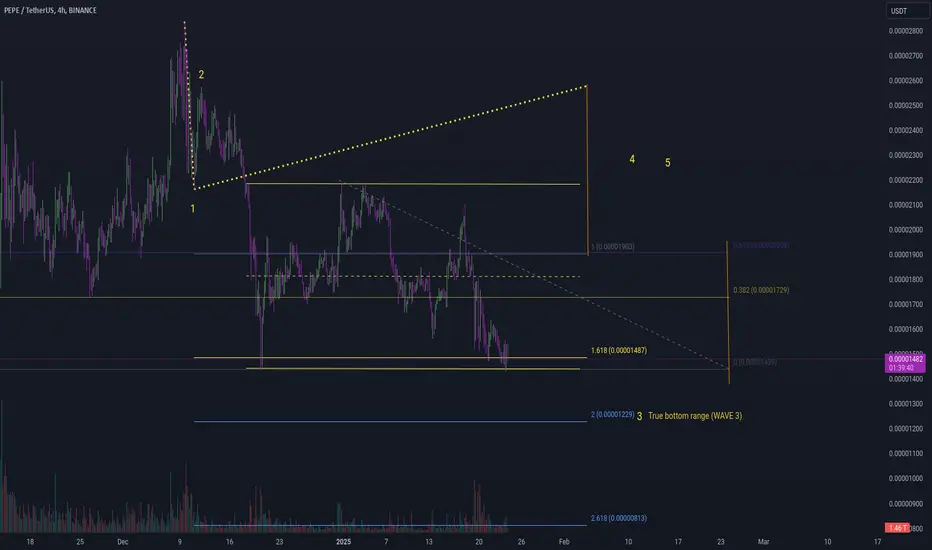
Pepe - Revised Elliot Wave Count and GartleyHi Traders -
Macro view of revised wave count and Gartley Harmonic in support of analysis.
Currently we could be still playing out the 3rd wave opposed to what I mentioned in previous posts where mentioning that were looking for the 5th wave to play out.
Used current bias based on previous example as can be seen with the earlier Gartley Harmonic.
Looking for slightly lower (yellow) 1.618 or (blue) 2.0 for support to end the 3rd Wave into the 4th, wave before wave 5 to play out before the corrective waves.
Trading the moment as there are no certainties and only probabilities.

TradeWithMky PEPE LIVE TRADEHello there
there is an opportinity for long Postions in support zones
as you see I saw candle stick formation as confirmaton for long postions
reversal pin bar in support zone
Consider this is not financial advise its my analysis about this chart
also consider Money managements and risk managements
#tradeWithMky
@TradeWithmky

PEPE/USDT 1H: Bulls Eye Oversold Reversal to $0.00001460!
PEPE/USDT 1H Chart Analysis (Smart Money Concepts)
🚀 Follow me on Tradingview if you respect our charts 📈
Current Price: $0.00001225
Market Structure:
Bearish momentum with lower lows and lower highs.
RSI: 30.81, oversold conditions indicating potential for a bounce.
Key Levels:
Resistance: $0.00001460
Support: $0.00001150
Stop Loss: Above $0.00001280 (recent swing high).
Trade Setup (Confidence Level: 7/10):
Entry Zone: $0.00001225 (current price).
Targets:
T1: $0.00001350
T2: $0.00001460
Hidden Bullish Divergence: Forming on RSI, suggesting accumulation and potential reversal.
Smart Money Analysis:
Market makers likely accumulating at current levels following an engineered drop.
Signs of liquidity building for a potential upward move.
Risk Score: 6/10
Decent risk/reward, but tight management required due to prevailing bearish trend.
Confirmation needed with RSI breaking above 40 for stronger confidence.
Recommendation:
Long position at current levels with tight risk management.
Monitor volume and RSI for signs of reversal.
Watch for breakout strength toward the resistance levels.
Confidence Level: 7/10 for potential short-term bounce.
🚀 Follow me on Tradingview if you respect our charts 📈

PEPE Is bout To MoonIt signals a bullish trend is upcoming for a memecoin pepe, I expect a massive bullish candle from this level

Pepe’s Weak Price Action Signals Trouble AheadAs with many coins, Pepe saw a massive pump following Trump’s election, with the coin hitting a new all-time high (ATH).
However, the bullish momentum quickly faded. After a marginal new ATH at the beginning of December, the price dropped back to the old resistance level, which had turned into support.
In early 2025, bulls made two more attempts to push the price higher, but both efforts failed, sending the coin back to the support zone.
This kind of price action suggests growing weakness. I expect the current support zone to eventually break. If that happens, the coin could accelerate its decline, potentially targeting the 0.000007 area.

$PEPE is again in my buy green box. Time to refill your bag?CRYPTOCAP:PEPE has corrected enough to drop into my green box—lower is better.
From this point, we can expect a potential 2x or more.
If possible, wait for it to touch 0.00001; that would be an amazing opportunity.
Looking at the weekly chart, a drop to 0.00001000 is entirely possible, and 0.000008 would be an absolute gift.


PEPEMonthly close should be above the blue line for any upside movement. In other case target the green zone to enter

The Time is Now! $PEPE Bottoming and Signaling a 3x PotentialI'm buying CRYPTOCAP:PEPE here. I've been waiting for an SFP at these lows or a touch of the orange line (though it might not reach). I'd rather start longing now and not miss out if the other bids don’t fill. Both the daily and weekly charts show good potential for a reversal. Overall, this is a solid level to enter.
BINANCE:PEPEUSDT

PEPE/USDT 1H: Bulls Building Momentum Toward $0.00001850 PEPE/USDT 1H Chart Analysis
🚀 Follow me on Tradingview if you respect our charts 📈
Current Price: $0.00001578
Market Structure:
Bullish momentum building after a double bottom formation.
RSI: 59.57, indicating bullish divergence and upward potential.
Order Block: Formed at $0.00001450, acting as strong support.
Trade Setup (Confidence Level: 7.5/10):
Entry Zone: $0.00001550-$0.00001580
Targets:
T1: $0.00001700 (FVG fill).
T2: $0.00001850 (previous high).
Stop Loss: Below $0.00001450 (recent swing low).
Risk Score: 6/10 (moderate risk due to meme coin volatility).
Smart Money Analysis:
Institutional accumulation visible in recent volume profile.
A break above $0.00001600 could trigger stop hunts and drive price higher.
Liquidity pools above $0.00001700 act as magnet levels.
Recommendation:
Long position valid in the $0.00001550-$0.00001580 range.
Watch for a confirmed breakout above $0.00001600 to strengthen bullish conviction.
Manage risk carefully due to potential volatility.
Confidence Level: 7.5/10 for bullish continuation.
🚀 Follow me on Tradingview if you respect our charts 📈

PEPE BUY hello friends
This token is well supported that due to the drop, we can buy step by step in the two specified areas and move with it to the above goals with capital management.
*Trade safely with us*

Everything is on the chartEverything is in accordance. Lets hope
If we not going below the trend line, I would expect it in next 3 months.

PEPE TO LOOSE ANOTHER ZERO IN THE NEXT BULLISH RUNIf PEPE Monthly candle starts below 14...buy at all lower levels, lowest going to 11. Then wait for a bull run. The end of the cycle will be as indicated on chart. Then a retest. It is Unlikely PEPE will ever come back to 11.12.13.14.15. So buy for generational wealth.
KING'S IDEAS.

Pepe - Analysis Range vs True Range (True Range Elliot Wave)So difficult to annotate. Takes some understanding of using the Fib retracement tool and parallel channel but happy to answer any questions.
I still think we havent played out Wave 3. Seems there's a range and within the range profits to be taken. So pose the question, why not take advantage of that.
Channel is the range,, however I do think that we will break below the channel at some point. Some may call it fake out.
My attempt to reason with Fibs. 0.618 and 1.0 is awesome. Play play play.. and never give up .. so much fun
Pepe Selling Pressure Dont give InHey guys, a lot of selling pressure with Pepe (possibly BTC - not looking)... Hold fast

Pepe Support - Pamp IncomingBased on this explanation, I think it's probable given this chart visual that the price will go up.
Possibly ending Wave 3 here to Wave 4 current local range before coming down to Wave 5). Post to come.

Pepe - Previous Elliot Wave Count Explanation I want to explain fro a previous wave and Trend Based Fib Retracement why I'm more bullish at 1.618 than 2.0 at the moment.
Previously you can see how 1.618 had no impact on support. Looking at my previous post (where we are now) there seems to be more support at this level.
Then is not now. Looking at the levels.
Shows both Gartleys:
The key is Trend Based Fib retracement tool for supportt/resistance levels. Thats a massive start!
