Lingrid | PEPEUSDT Corrective Channel BreakoutThe price perfectly fulfilled my previous idea . BINANCE:PEPEUSDT rebounded powerfully from the 0.00000843 support and broke out of the long-standing downward channel, marking the start of a bullish impulse leg. Price is now holding above the breakout point and consolidating above the 0.00001159
Related pairs

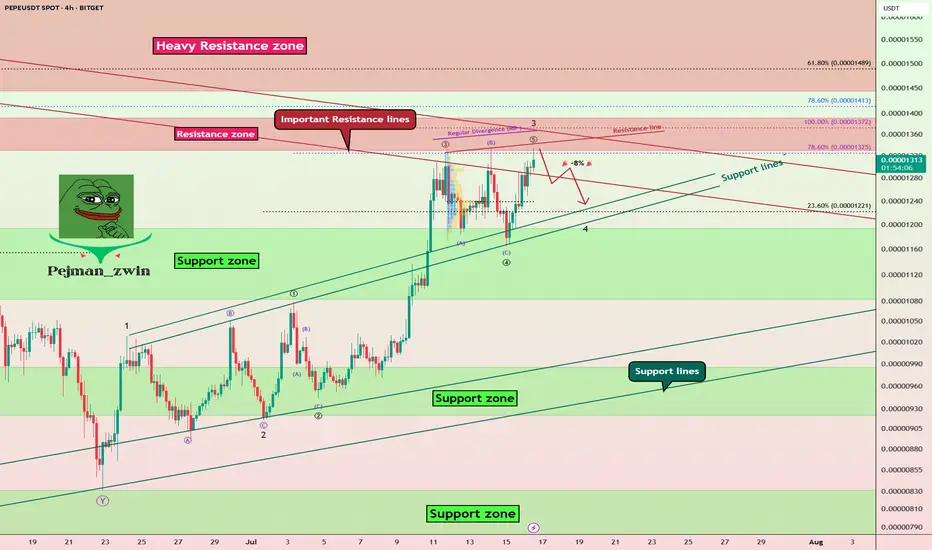
PEPE Faces Key Resistances – Is a -8% Pullback Coming?The PEPE memecoin ( BINANCE:PEPEUSDT ) is currently near the Resistance zone($0.00001392-$0.00001330) and Important Resistance lines . This is the third time that PEPE has attacked the Important Resistance lines .
In terms of Elliott wave theory , it seems that PEPE is completing the micro
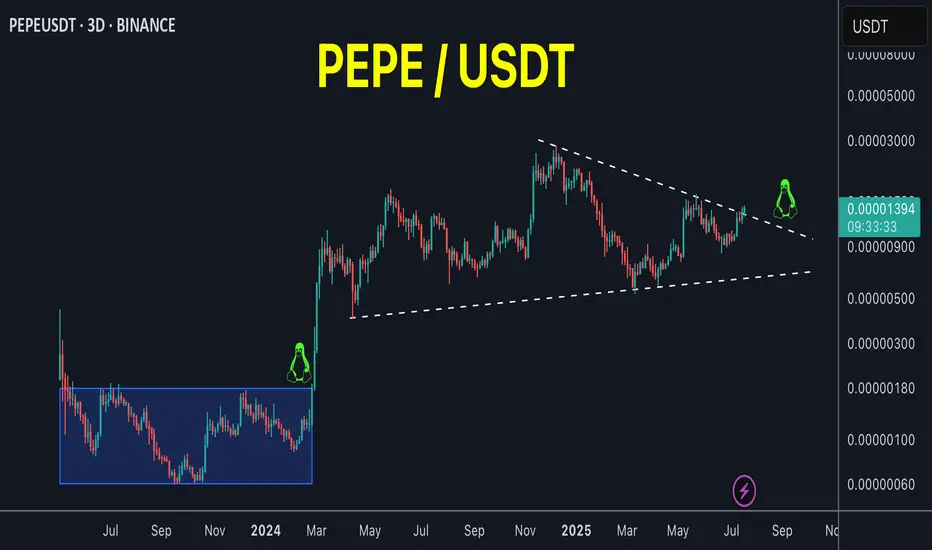
PEPE on the verge of breakout!PEPE / USDT
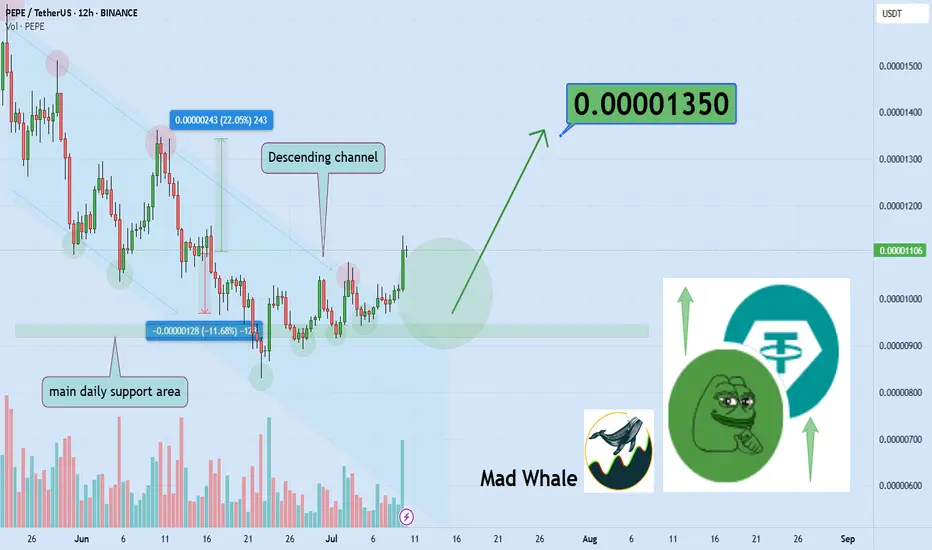
Price is trying to breakout massive downtrend line since 7 months
Incase of breakout we will see strong bullish momentum
Keep an eye on it
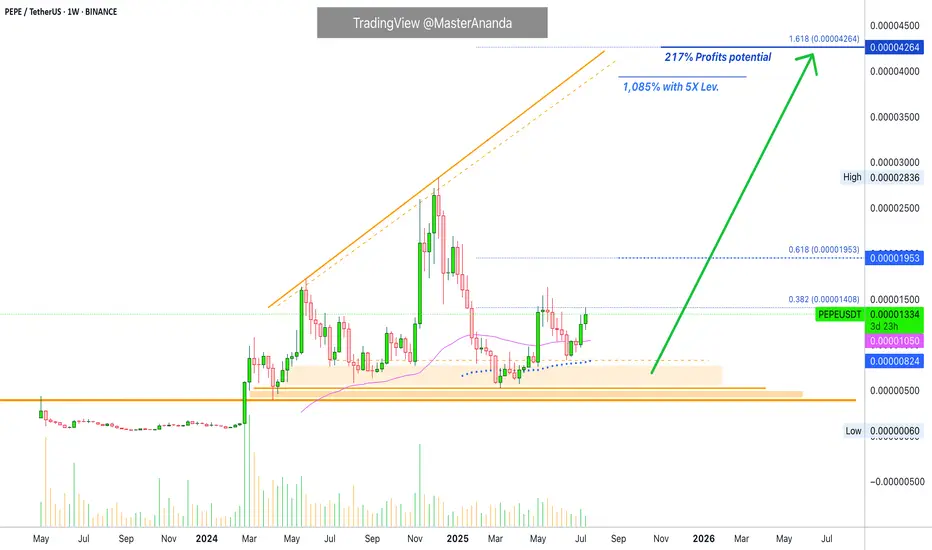
Pepe's Bullish Bias Intensifies · 217% PP = 1085% 5X Lev.The bullish bias for PEPEUSDT is starting to intensify, still early of course. It is still early on this one because the action is still lower than the 19-May high. There are many projects that are already trading above their last high. So it is good news to find a pair that is moving below because
Is Pepe growing? Read the caption, it's important.Hello friends🙌
✔Some factors caused the price to fall, but in a support area that we have drawn for you with several Fibonacci waves, you can see that a classic double bottom pattern has been formed and buyers have entered.
🔊Now there is no more news of a fall and buyers have raised the price to t

PEPEUSDT broken trendline and bullish market aheadAs we can see on the major resistances which was red trendline broke and price now after more range here or without it can see more gain at least to the targets like 0.000017$.
DISCLAIMER: ((trade based on your own decision))
<<press like👍 if you enjoy💚

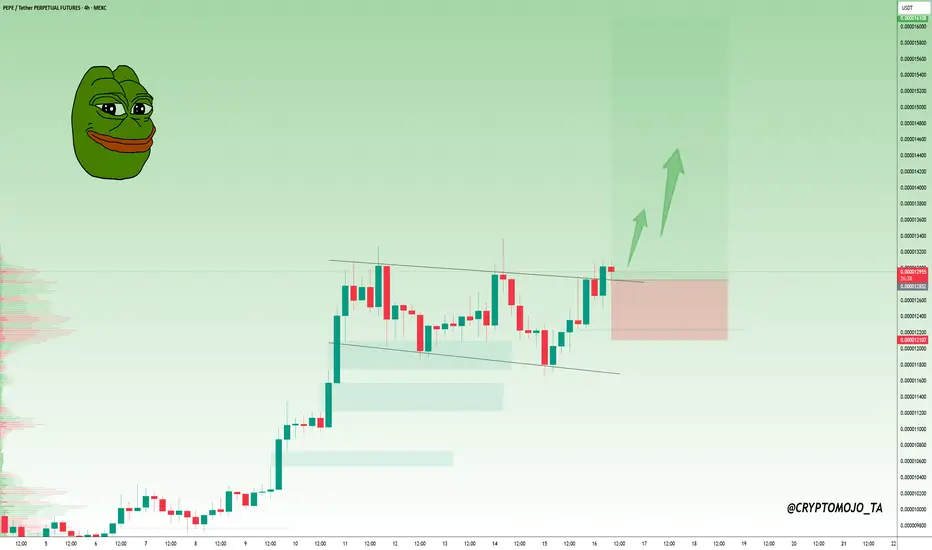
#PEPE:Breakout In Action!#PEPE Breakout In Action 🚀
CRYPTOCAP:PEPE has broken out of the falling wedge on the 4H chart and closed above the trendline.
Price is now retesting the breakout zone, a strong bounce here could push it toward the $0.000016 level (+25%).
Entry: 0.00001285 – 0.00001300
Stop Loss: 0.00001210
Tar
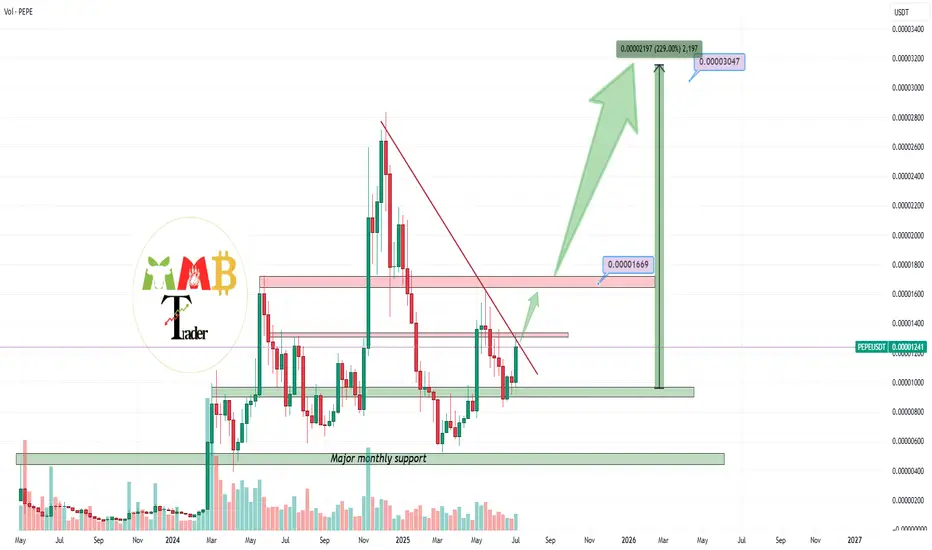
PEPEUSDT high potential pump is cooking As we can see price is near major resistance of 0.000013$ and any breakout here to the upside is going to pump price hard to the targets like 0.000040$.
Two major resistance here is now same which are 0.000013$ which is weekly resistance zone + red trendline resistance also now is here so after b
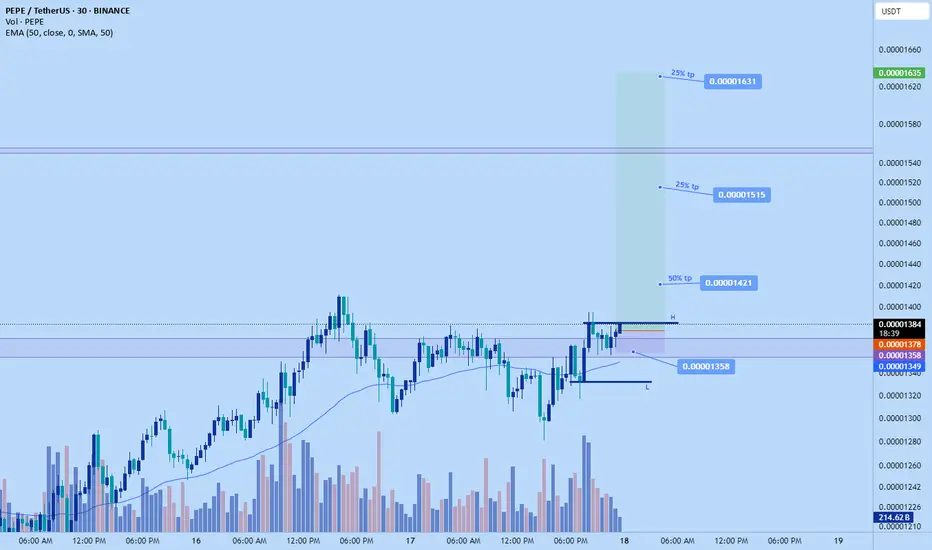
PEpe long to $0.00001635Just hopped into a pepe long long. Mainly aiming for the $0.00001421 target in the night but if the market decides to pump hard I'll scale out gradually until $0.00001631
DTT analysis applied. Learn more on my x page.
sL: $0.00001358
You all Panic and Sell While Whales Buy Ever sold at the exact bottom, just before the bounce?
Mass fear always becomes the perfect entry for whales, while regular traders are running away.
In this post, I’ll break down how their mindset beats ours, and how to flip the script on your own fear.
Hello✌
Spend 3 minutes ⏰ reading this educa
See all ideas
Summarizing what the indicators are suggesting.
Oscillators
Neutral
SellBuy
Strong sellStrong buy
Strong sellSellNeutralBuyStrong buy
Oscillators
Neutral
SellBuy
Strong sellStrong buy
Strong sellSellNeutralBuyStrong buy
Summary
Neutral
SellBuy
Strong sellStrong buy
Strong sellSellNeutralBuyStrong buy
Summary
Neutral
SellBuy
Strong sellStrong buy
Strong sellSellNeutralBuyStrong buy
Summary
Neutral
SellBuy
Strong sellStrong buy
Strong sellSellNeutralBuyStrong buy
Moving Averages
Neutral
SellBuy
Strong sellStrong buy
Strong sellSellNeutralBuyStrong buy
Moving Averages
Neutral
SellBuy
Strong sellStrong buy
Strong sellSellNeutralBuyStrong buy
Displays a symbol's price movements over previous years to identify recurring trends.
Frequently Asked Questions
The current price of PEPE / TetherUS (PEPE) is 0.00001394 USDT — it has risen 2.47% in the past 24 hours. Try placing this info into the context by checking out what coins are also gaining and losing at the moment and seeing PEPE price chart.
PEPE / TetherUS price has risen by 6.85% over the last week, its month performance shows a 28.14% increase, and as for the last year, PEPE / TetherUS has decreased by −44.24%. See more dynamics on PEPE price chart.
Keep track of coins' changes with our Crypto Coins Heatmap.
Keep track of coins' changes with our Crypto Coins Heatmap.
PEPE / TetherUS (PEPE) reached its highest price on Dec 5, 2024 — it amounted to 0.00009999 USDT. Find more insights on the PEPE price chart.
See the list of crypto gainers and choose what best fits your strategy.
See the list of crypto gainers and choose what best fits your strategy.
PEPE / TetherUS (PEPE) reached the lowest price of 0.00000500 USDT on Feb 18, 2025. View more PEPE / TetherUS dynamics on the price chart.
See the list of crypto losers to find unexpected opportunities.
See the list of crypto losers to find unexpected opportunities.
The safest choice when buying PEPE is to go to a well-known crypto exchange. Some of the popular names are Binance, Coinbase, Kraken. But you'll have to find a reliable broker and create an account first. You can trade PEPE right from TradingView charts — just choose a broker and connect to your account.
PEPE / TetherUS (PEPE) is just as reliable as any other crypto asset — this corner of the world market is highly volatile. Today, for instance, PEPE / TetherUS is estimated as 5.25% volatile. The only thing it means is that you must prepare and examine all available information before making a decision. And if you're not sure about PEPE / TetherUS, you can find more inspiration in our curated watchlists.
You can discuss PEPE / TetherUS (PEPE) with other users in our public chats, Minds or in the comments to Ideas.