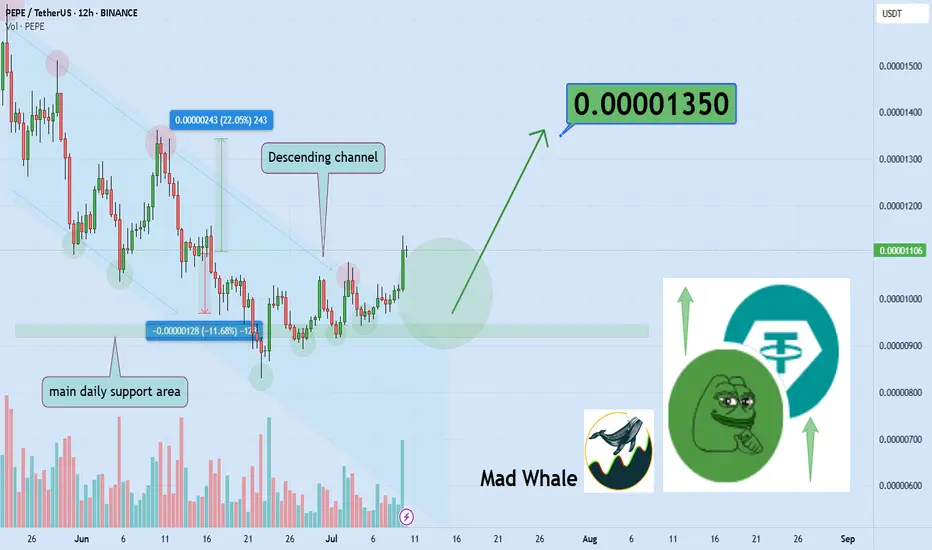
You all Panic and Sell While Whales Buy Ever sold at the exact bottom, just before the bounce?
Mass fear always becomes the perfect entry for whales, while regular traders are running away.
In this post, I’ll break down how their mindset beats ours, and how to flip the script on your own fear.
Hello✌
Spend 3 minutes ⏰ reading this educa
Related pairs
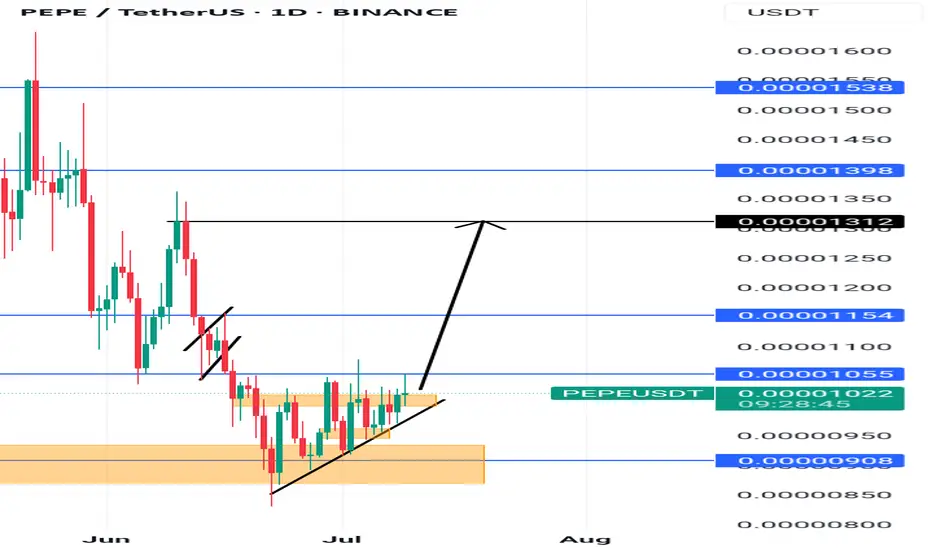
Lingrid | PEPEUSDT Corrective Channel BreakoutThe price perfectly fulfilled my previous idea . BINANCE:PEPEUSDT rebounded powerfully from the 0.00000843 support and broke out of the long-standing downward channel, marking the start of a bullish impulse leg. Price is now holding above the breakout point and consolidating above the 0.00001159

Is Pepe growing? Read the caption, it's important.Hello friends🙌
✔Some factors caused the price to fall, but in a support area that we have drawn for you with several Fibonacci waves, you can see that a classic double bottom pattern has been formed and buyers have entered.
🔊Now there is no more news of a fall and buyers have raised the price to t

PEPEUSDT Forming Falling ChannelPEPEUSDT is showing promising signs of a potential breakout, supported by a clear price structure that resembles a falling channel pattern. This technical setup is widely known among traders for indicating a possible trend reversal when the price successfully breaches the channel’s upper resistance

PEPE Faces Key Resistances – Is a -8% Pullback Coming?The PEPE memecoin ( BINANCE:PEPEUSDT ) is currently near the Resistance zone($0.00001392-$0.00001330) and Important Resistance lines . This is the third time that PEPE has attacked the Important Resistance lines .
In terms of Elliott wave theory , it seems that PEPE is completing the micro
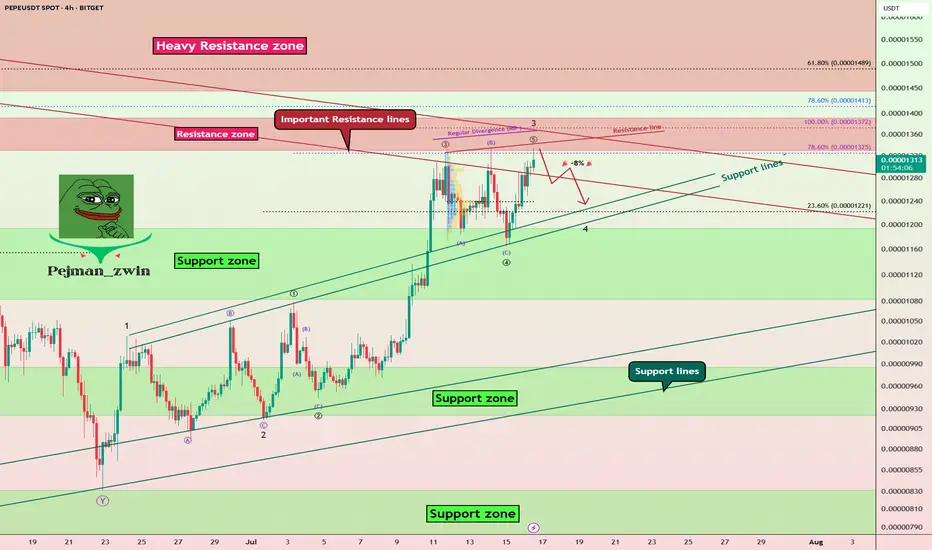
W formation Pepe has shifted and invalidated the bearish structure that would have served us a wonderful sell opportunity.
There is a retest, at a support level,once the current candle closes,the movement continues upward all the way to 0.00001312.
PEPEUSDT Critical Decision Zone – Massive Move Incoming?🧠 Macro Technical Analysis
PEPEUSDT is currently hovering within a critical demand zone (0.00000095 – 0.00000110), an area that has historically acted as a strong accumulation base and a launchpad for previous rallies. The chart structure shows multiple interactions with this zone, highlighting its

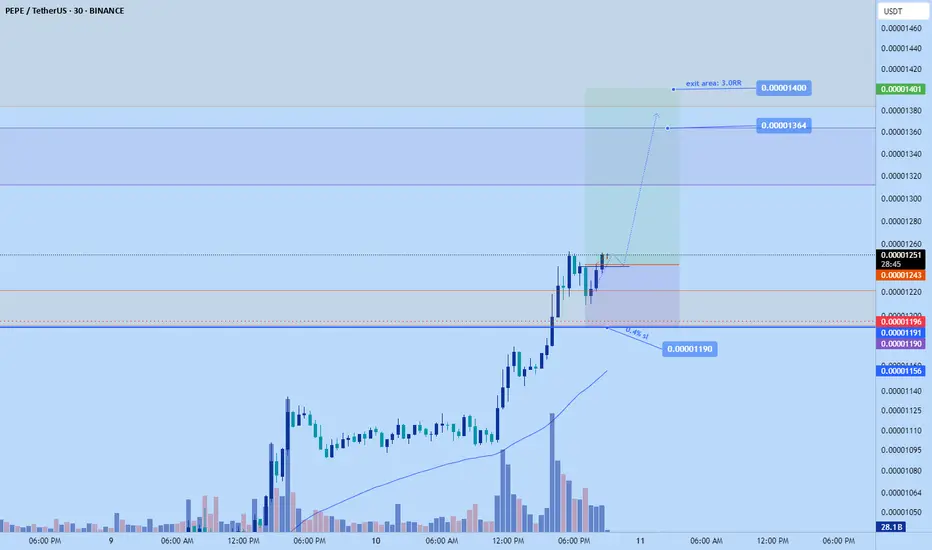
PEPE long to $0.000014Just opened a long position on pepe. Aiming for 0.000014
Stop: $0.00001190
Roughly 3RR
Pepe seems to be itching to breakout and continue pumping based on my DTT analysis. Its high on higher tf though the momentum is strong
Time sensitive
PEPE Breakout Sequence – Double Flag Pattern Forming?PEPE continues its breakout sequence on the 1H chart, forming a classic bull flag followed by another possible setup in real time. The first breakout above 0.00000108 triggered strong follow-through. Now, a second flag is forming just under 0.00000130. With Stoch RSI cooling down, this could be the

Pepe usdt updateVery likely scenario, everyone knows that I am a pepe coin hunter and I will return to the previous two charts since 2024 24 Feb

See all ideas
Summarizing what the indicators are suggesting.
Oscillators
Neutral
SellBuy
Strong sellStrong buy
Strong sellSellNeutralBuyStrong buy
Oscillators
Neutral
SellBuy
Strong sellStrong buy
Strong sellSellNeutralBuyStrong buy
Summary
Neutral
SellBuy
Strong sellStrong buy
Strong sellSellNeutralBuyStrong buy
Summary
Neutral
SellBuy
Strong sellStrong buy
Strong sellSellNeutralBuyStrong buy
Summary
Neutral
SellBuy
Strong sellStrong buy
Strong sellSellNeutralBuyStrong buy
Moving Averages
Neutral
SellBuy
Strong sellStrong buy
Strong sellSellNeutralBuyStrong buy
Moving Averages
Neutral
SellBuy
Strong sellStrong buy
Strong sellSellNeutralBuyStrong buy
Displays a symbol's price movements over previous years to identify recurring trends.
Frequently Asked Questions
The current price of PEPE / TETHER (PEPE) is 0.00001354 USDT — it has risen 0.39% in the past 24 hours. Try placing this info into the context by checking out what coins are also gaining and losing at the moment and seeing PEPE price chart.
PEPE / TETHER price has risen by 26.44% over the last week, its month performance shows a 16.10% increase, and as for the last year, PEPE / TETHER has increased by 19.40%. See more dynamics on PEPE price chart.
Keep track of coins' changes with our Crypto Coins Heatmap.
Keep track of coins' changes with our Crypto Coins Heatmap.
PEPE / TETHER (PEPE) reached its highest price on Dec 9, 2024 — it amounted to 0.00002837 USDT. Find more insights on the PEPE price chart.
See the list of crypto gainers and choose what best fits your strategy.
See the list of crypto gainers and choose what best fits your strategy.
PEPE / TETHER (PEPE) reached the lowest price of 0.00000382 USDT on Apr 13, 2024. View more PEPE / TETHER dynamics on the price chart.
See the list of crypto losers to find unexpected opportunities.
See the list of crypto losers to find unexpected opportunities.
The safest choice when buying PEPE is to go to a well-known crypto exchange. Some of the popular names are Binance, Coinbase, Kraken. But you'll have to find a reliable broker and create an account first. You can trade PEPE right from TradingView charts — just choose a broker and connect to your account.
Crypto markets are famous for their volatility, so one should study all the available stats before adding crypto assets to their portfolio. Very often it's technical analysis that comes in handy. We prepared technical ratings for PEPE / TETHER (PEPE): today its technical analysis shows the strong buy signal, and according to the 1 week rating PEPE shows the buy signal. And you'd better dig deeper and study 1 month rating too — it's strong buy. Find inspiration in PEPE / TETHER trading ideas and keep track of what's moving crypto markets with our crypto news feed.
PEPE / TETHER (PEPE) is just as reliable as any other crypto asset — this corner of the world market is highly volatile. Today, for instance, PEPE / TETHER is estimated as 8.97% volatile. The only thing it means is that you must prepare and examine all available information before making a decision. And if you're not sure about PEPE / TETHER, you can find more inspiration in our curated watchlists.
You can discuss PEPE / TETHER (PEPE) with other users in our public chats, Minds or in the comments to Ideas.