Pepe Support Confirmed, Bullish Continuation Next (Trade & Win)Support is now confirmed with four green days after EMA55 and EMA89 hold as support. PEPEUSDT is bullish now and set to grow.
The peak happened 24-May. The low 5-June.
This retrace lasted 13 days with a total drop of 36%. For future reference.
After each bullish wave, there is always a retrace or correction. In this case only a retrace because the bullish cycle is just getting started, the previous wave of growth was very small.
The next advance will be very, very strong so we can expect a correction after it. The difference between the retrace and a correction is about size. The correction lasts longer and goes deeper, that's all there is.
Expect maximum growth now but this won't be the end. It will grow super strong in the coming weeks and months, then we get a correction and then even more growth. But the fifth wave is the last one, after this we get a bear market so pay attention.
Pepe's support has been confirmed. This bullish continuation will turn the market full green.
Follow me to trade with me and win.
Namaste.
PEPEUSDT trade ideas

#PEPEUSDT: Major Swing Upcoming! Get Ready! PEPEUSDT is currently in phase two of accumulation and will distribute the price soon. We expect the price to move in a bullish impulse pattern as we anticipate volatility in the coming days. However, we advise having a secondary bias while investing or trading on cryptocurrency, as it is highly risky and lacks the same volume as forex or gold.
Good luck and trade safely!
Team Setupsfx_

PEPEUSDT is ready for +150% pump from supportAs we can see daily green trendline support is strong support zone which can pump the price here also previous daily high now is support zone for Pepeusdt too and soon we are looking for more rise and gain like the green arrows on chart.
DISCLAIMER: ((trade based on your own decision))
<<press like👍 if you enjoy💚

PEPE at Key Reversal Zone — Support Test Coming Soon?Today I want to look at the PEPE token ( BINANCE:PEPEUSDT ), which is part of the memecoin category, and provide you with a short-term analysis on the 1-hour timeframe .
PEPE token is trading in Potential Reversal Zone(PRZ) .
In terms of Elliott wave theory , the PEPE token appears to be completing the microwave 5 of the main wave C . The structure is a Zigzag Correction(ABC/5-3-5) .
Also, we can see the Regular Divergence(RD-) between Consecutive Peaks .
I expect the PEPE token to attack the Support zone($0.0000120-$0.0000108) after completing the main wave C .
Note: Stop Loss = $0.0000362
Please respect each other's ideas and express them politely if you agree or disagree.
Pepe Analyze (PEPEUSDT), 1-hour time frame.
Be sure to follow the updated ideas.
Do not forget to put a Stop loss for your positions (For every position you want to open).
Please follow your strategy and updates; this is just my Idea, and I will gladly see your ideas in this post.
Please do not forget the ✅' like '✅ button 🙏😊 & Share it with your friends; thanks, and Trade safe.

PEPEUSD going to moon according to my analysis. {08/june/2025}Educational Analysis says that PEPEUSD may give trend Trading opportunities from this range, according to my technical analysis.
Broker - binance
So, my analysis is based on a top-down approach from weekly to trend range to internal trend range.
So my analysis comprises of two structures: 1) Break of structure on weekly range and 2) Trading Range to fill the remaining fair value gap
Let's see what this pair brings to the table for us in the future.
Please check the comment section to see how this turned out.
DISCLAIMER:-
This is not an entry signal. THIS IS FOR EDUCATIONAL PURPOSES ONLY.
I HAVE NO CONCERNS WITH YOUR PROFIT OR LOSS,
Happy Trading, Fx Dollars.

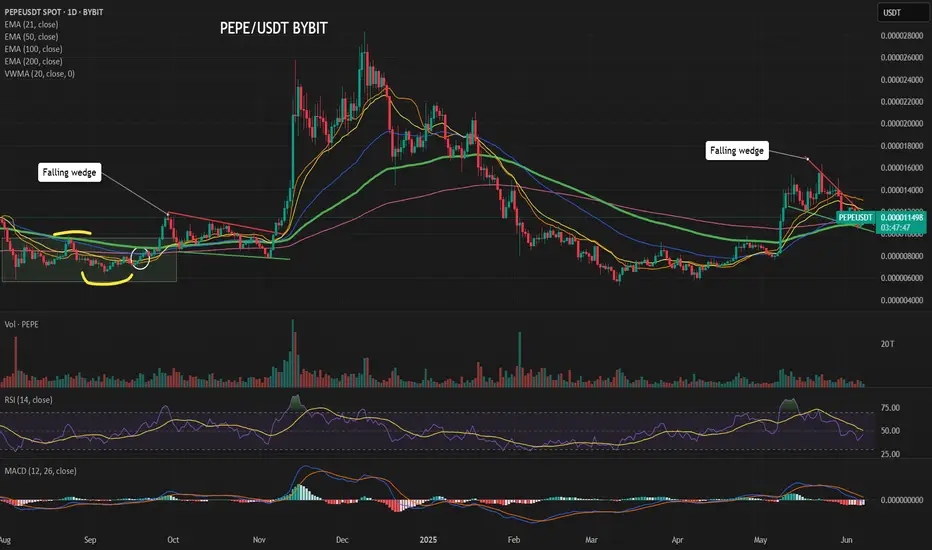
Falling Wedge RetestBroke out of a stage 1 base and retesting the breakout along w/ the 50 day. Breakout incoming towards the highs

Lingrid | PEPEUSDT Fake Breakout Correction Eyes 0.00014BINANCE:PEPEUSDT has rebounded from key horizontal support near 0.00001105 after a sharp pullback broke below the upward channel. Price is now consolidating just above the lower structure with signs of a bullish reversal pattern forming. A higher low around support could trigger a fresh move toward 0.00001395.
📈 Key Levels
Buy zone: 0.00001105–0.00001130
Buy trigger: bullish candle above 0.00001160
Target: 0.00001395
Sell trigger: daily close below 0.00001100
💡 Risks
Breakdown of 0.00001100 opens path toward 0.00001000
Consolidation below channel weakens bullish bias
Failure to reclaim upward trendline may delay breakout potential
Traders, if you liked this idea or if you have your own opinion about it, write in the comments. I will be glad 👩💻

PepeLet’s break down the chart for the PEPE/TetherUS (PEPEUSDT) trading pair on a 1-day timeframe from Binance, as shown in the image. This analysis will cover the price action, key levels, trends, and indicators visible on the chart.
1. Price Action and Trend
• The chart shows the price movement of PEPEUSDT over a period from around September 2024 to July 2025.
• The current price is 0.0000112600 USDT, with a +5.83% increase, indicating bullish momentum in the recent period.
• The price has been oscillating between key levels of support (labeled as “DEMAND”) and resistance (labeled as “SUPPLY”).
◦ Demand Zone: Around 0.0000070000 to 0.0000090000. This area acted as a strong support where the price bounced multiple times (e.g., around November 2024 and March 2025).
◦ Supply Zone: Around 0.0000112600 to 0.0000150000. The price is currently testing this resistance area, which it previously struggled to break (e.g., around July 2025).
• A Point of Interest (POI) is marked around the 0.0000112600 level, suggesting this is a critical area where the price might either break out or reverse.
• The chart shows an ascending triangle pattern forming, with higher lows (indicating increasing buying pressure) and a flat resistance at the supply zone. This pattern often signals a potential bullish breakout if the price breaks above the resistance.
2. Volume Analysis
• The volume bars at the bottom of the chart show fluctuations in trading activity.
• There are noticeable spikes in volume at key price levels, particularly during the bounces from the demand zone (e.g., November 2024 and March 2025) and during attempts to break the supply zone (e.g., July 2025).
• The recent price increase (+5.83%) is accompanied by a moderate increase in volume, which supports the validity of the upward move. However, for a confirmed breakout above the supply zone, we’d ideally want to see a more significant volume surge.
3. Indicator Analysis (Lower Chart)
• The lower chart appears to show two indicators, likely the Relative Strength Index (RSI) and possibly the MACD or a volume-based indicator.
• The RSI (likely the blue line) is currently around the 80 level, which is in the overbought territory (typically above 70). This suggests that the price might be overextended in the short term, and a pullback or consolidation could occur before any further upward movement.
• The yellow line (possibly MACD or another oscillator) is also trending upward, indicating bullish momentum. However, if this is MACD, we’d need to check for any potential divergence (e.g., price making higher highs while the indicator makes lower highs), which could signal a reversal.
4. Key Levels to Watch
• Resistance (Supply Zone): 0.0000112600 to 0.0000150000. A break above this level with strong volume could confirm a bullish breakout, potentially targeting the next resistance around 0.0000300000 (as seen on the right side of the chart).
• Support (Demand Zone): 0.0000070000 to 0.0000090000. If the price fails to break the supply zone and pulls back, this demand zone will be critical to hold for the bullish structure to remain intact.
• Current Price (POI): 0.0000112600. This level is pivotal. A rejection here could lead to a retest of the demand zone, while a breakout could lead to a strong upward move.
5. Trading Scenarios
• Bullish Scenario: If the price breaks above the supply zone (0.0000112600 to 0.0000150000) with high volume and the RSI cools off without dropping too far, the next target could be 0.0000300000. This would confirm the ascending triangle breakout.
• Bearish Scenario: If the price gets rejected at the current supply zone and the RSI shows overbought conditions leading to a reversal, the price could drop back to the demand zone (0.0000070000 to 0.0000090000). A break below this support would invalidate the bullish structure and could lead to further downside.
• Neutral Scenario: The price might consolidate around the current POI (0.0000112600) as it gathers momentum for the next move. Watch for volume and RSI behavior during this period.
6. Additional Observations
• The chart is labeled with “BUY” at 0.0000112600 and “SELL” at 0.0000112600, which might indicate a trader’s plan to buy at a breakout or sell if the price fails to break through.
• The overall market sentiment for PEPEUSDT appears bullish in the medium term due to the higher lows and the ascending triangle pattern. However, the overbought RSI signals caution for short-term traders.
7. Conclusion
The PEPEUSDT pair is at a critical juncture. The price is testing a significant resistance (supply zone) within an ascending triangle pattern, supported by moderate volume and bullish momentum. However, the overbought RSI suggests a potential pullback or consolidation before a breakout. Traders should watch for a confirmed break above 0.0000150000 with strong volume for a bullish continuation, or a rejection leading to a retest of the demand zone around 0.0000070000. As of now, the structure remains bullish, but caution is advised due to the overbought conditions.
If you’d like a deeper dive into any specific aspect (e.g., the indicators, volume, or a prediction based on this setup), let me know!

Long trade
30min TF
📘 Trade Journal Entry
PEPEUSD (Buyside Trade)
🗓 Date: Saturday, 7th June 2025
⏰ Time: noon (NY Time)
📍 Session: New York PM
📈 Timeframe: 30 minutes
📊 Market Structure Tool: Break of Structure
🧠 Confirmation Tool: Bullish Continuation + Range Expansion Setup
🔹 Trade Details:
Entry Price: 0.00001150
Take Profit: 0.00001204 (+4.70%)
Stop Loss: 0.00001138 (−1.04%)
Risk-Reward Ratio: 4.5
🔹 Technical Breakdown:
Market Structure:
Trade entered after confirmation of bullish structure break and higher low formation.
Price pulled back into a discounted range, respecting a prior accumulation zone.

PEPE Ready to Rip? 3 Take-Profits Lined Up from This Key SupportPEPEUSD is currently forming a potential bullish reversal near the key support zone between 0.00001060 and 0.00001099. This level has acted as a solid demand zone previously, with price bouncing off this range multiple times in the recent past. The current price action suggests consolidation above this level, hinting at potential accumulation by buyers.
We can observe a compression in volatility, with recent candles showing smaller bodies and longer wicks near support—classic signs of weakening bearish momentum. The prior price rejection from the 0.00001318 zone and the smooth retracement to support further confirm this as a healthy correction rather than a trend breakdown.
The DPO (Detrended Price Oscillator) is hovering close to zero, suggesting the asset is entering a potential pivot zone. A move into positive territory would support the bullish scenario, ideally confirmed by an increase in volume on the breakout above short-term resistance.
This setup is particularly attractive for scalpers or short-term traders, aiming to capture quick momentum surges across multiple resistance levels.
📌 Trade Setup
• Entry Zone: 0.00001167–0.00001177
• Stop-Loss (SL1): 0.00001060
• Take-Profit 1 (TP1): 0.00001318
• Take-Profit 2 (TP2): 0.00001443
• Take-Profit 3 (TP3): 0.00001603
Strategy Note: The risk-to-reward ratio is highly favorable, particularly for TP2 and TP3. The setup allows for flexible scaling of positions as price hits each resistance level. With no immediate macro threats on the 4H structure and price defending support, this setup offers a clean bullish opportunity.

A logical expectation, a steep climbWaiting for the ALTSEASON is not far from the imagination. We can see high but reasonable prices soon. The price trend, despite consolidating above the long-term trend line, could promise an uptrend.

PEPE - Last bullish wave PEPE is reaching a solid level presented in green rectangle.
I believe this level will attract investors for the following reasons :
Technicals :
PEPE reached a solid support level presented in green line.
Price action :
- Recent correction of -35% wich is very high compared to the BTC correction.
Beyond technicals :
- Very strong community
- Meme coin had it's bullish time and reached very high fomo levels. I think the next bullish wave will be limited to the red box I present in the chart.
Market sentiment :
The investors will dump their coins as well as the bullish move will come. The are now sitting on enormous amount of profits.
Recap :
- Risks : bad news , whales dumping , ...
- Main Target : +71%

Long trade
30min TF overview
📘 Trade Journal Entry — PEPEUSDT (Buyside Trade)
🗓 Date: Sunday, 8th June 2025
⏰ Time: 3:15 PM
📍 Session: NY Session PM
📈 Timeframe: 15-Minute
🎯 Target: This Week’s Open (0.00001181)
📊 Risk-Reward Ratio: 8.0
🔹 Trade Details:
Entry Price: 0.00001173
Take Profit: 0.00001181 (+0.68%)
Stop Loss: 0.00001172 (−0.09%)
15min TF overview
🔹 Technical Breakdown:
Bias: Buyside pressure observed with steady reclaim of mid-range levels.
Market Context: Entered during a slow grind upwards toward the weekly open.
Confluence Factors:
Clean 15m structure supported upward continuation.
RSI was rising with momentum, confirming higher lows.

PEPE in a Falling Wedge - are you ready for the breakout?Since May 12–17, PEPE has been forming a Falling Wedge pattern on the chart—a classic bullish reversal structure. Based on previous technical signals and pattern recognition, this setup often precedes a breakout to the upside, potentially pushing price towards a new all-time high (ATH) or levels approaching it.
Here is my take
A similar price structure was observed leading up to the breakout between November 7–14, 2024, when PEPE surged to a new ATH.
The current consolidation phase closely mirrors the pre-breakout behavior seen during that period, including volume contraction, narrowing volatility, and resistance retests.
Given this setup, there is a strong likelihood of an imminent bullish breakout, with price likely to establish new higher ranges. Confirmation of breakout would be a sustained move above the wedge resistance, ideally supported by increasing volume.
Conclusion
PEPE is currently consolidating within a bullish continuation pattern. If market conditions remain favorable and the breakout confirms, we could see a significant upward move in the short to medium term.
Are you ready for the breakout?
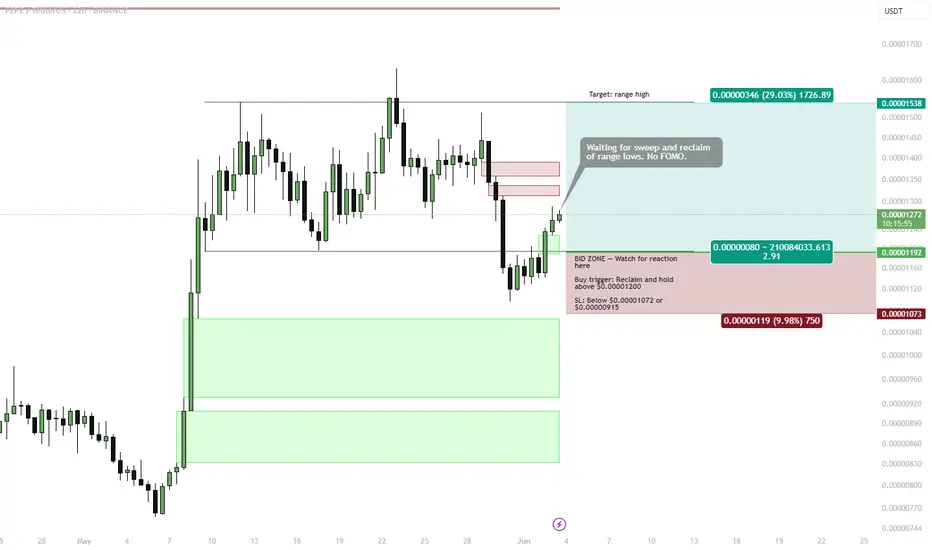
PEPE | range play — Reclaim Setup Targeting Range HighPrice has swept the range lows and is now attempting a reclaim of the lower boundary around 0.00001200. This creates a potential long setup targeting the range high if structure holds.
Setup:
🟩 Buy Trigger: Reclaim and hold above 0.00001200
• Entry confirmed after bullish reclaim
• SL: Below 0.00001072 or conservative below 0.00000915
📌 BID ZONE: 0.00001120–0.00001190
• Watch for reaction here — ideal place to enter during a retest
🎯 Target:
• Range High: 0.00001538 (~+29%)
Risk-Reward:
• R:R ≈ 2.9
• Setup remains invalid if price drops below bid zone or fails to hold the reclaim
Note:
⛔ No FOMO. Wait for confirmation — reclaim first, entry second.
Long trade
15min TF overview
📘 Trade Journal Entry — PEPEUSDT (Buyside Trade)
🗓 Date: Sunday, 8th June 2025
⏰ Time: 2:00 PM
📍 Session: NY Session PM
📈 Timeframe: 10-Second Chart (High-Frequency Scalping)
🧠 Confirmation Tool: RSI Indicator for directional bias
🎯 Result: ✅ Target hit successfully
🔹 Trade Details:
Entry Price: 0.00001173
Take Profit: 0.00001179 (+0.51%)
Stop Loss: 0.00001172 (−0.09%)
Risk-Reward Ratio: 5.10
10 sec TF entry
🔹 Technical Breakdown:
RSI Confirmation: RSI divergence spotted on microstructure, indicating short-term oversold conditions. Entry Trigger: Price action reclaimed the short-term support zone while RSI reversed upward from the 30-level—execution: Executed immediately after a bullish micro-candle and RSI confirmation crossover.
10 sec TF entry overview

$PEPE Analysis 📊 CRYPTOCAP:PEPE Analysis 📊
#PEPE eyeing that trendline liquidity 👀 — waiting for a sweep followed by a tap into the 1H FVG to trigger a long entry 🎯
Let the liquidity hunt finish — then ride the bounce 🐸📈

PEPE 4HPepe seems to have broken the downtrend and is coming to get approval. 0.0000145-1500 regions may come as targets.


Long trade
4Hr TF overview
Trade Journal Entry — PEPEUSDT (Buyside Trade)
🗓 Date: Sunday 1st June 2025
⏰ Time: 12:00 PM
📍 Session: London PM
📈 Timeframe: 4-Hour (Swing Setup)
📊 Market Structure Tool: Higher Low Formation + FVG Entry
🧠 Confirmation Tool: Break of Structure + Discounted Entry Zone
15min TF overview
🔹 Trade Details:
Entry Price: 0.00001188
Take Profit: 0.00001356 (+14.14%)
Stop Loss: 0.00001138 (−4.21%)
Risk-Reward Ratio: 3.36
🔹 Technical Breakdown:
Market Structure:
Price formed a higher low in line with bullish trend continuation.

PEPE Phoenix Revival: The +70% Bottoming Pattern Confirmed
The PEPE/USDT daily chart from May 10, 2025, reveals a textbook "Phoenix Rising" pattern that signals an extraordinary trading opportunity currently unfolding. Trading at 0.00001305 with significant momentum (+5.50% on rising volume), PEPE appears poised for a massive recovery rally toward historical resistance.
---- Technical Structure: Bottoming Pattern Complete ---
After a prolonged downtrend from January 2025, PEPE has formed a perfect bottoming pattern with these key components:
1. Accumulation Channel Formation (yellow boundaries) - The March-April base-building phase where smart money quietly accumulated positions between 0.000005-0.000008
2. Channel Breakout Confirmation - The recent powerful green candle with expanding volume (28.17T) signaling institutional entry
3. Historical Supply Zone (purple rectangle) - This is the crucial 0.0000175-0.0000185 range that previously acted as support before the January breakdown
--- Trading Roadmap: The 66% Upside Play ---
The blue pathway illustrates the anticipated price movement, with three distinct phases:
Phase 1: Consolidation - After the initial breakout surge, price will likely form a higher low around 0.00001033 (marked as entry point), creating the ideal risk-reward opportunity
Phase 2: Stair-Step Advance - A series of higher highs and higher lows as price climbs through previous resistance levels
Phase 3: Target Achievement - Final push toward the 0.00001715 take-profit target, representing a 66% gain from the suggested entry point
--- Technical Reasoning: The Triple Confluence ---
What makes this setup particularly compelling is the triple confluence of factors:
1. Volume Confirmation - The breakout candle shows 5.50% gains on expanding volume, the textbook definition of genuine price movement
2. Historical Context - The current price structure mirrors almost identically the bottoming pattern seen in early 2024 before PEPE's previous major rally
3. Macro Alignment - This move coincides perfectly with the projected Bitcoin dominance decline (as seen in broader market analysis), creating ideal conditions for meme coin outperformance
--- Strategic Entry Plan ---
The optimal approach to this opportunity is to wait for the pullback to the 0.000010 level, which provides:
- Clear invalidation point (below 0.0000095)
- Exceptional risk-reward ratio (over 5:1)
- Confirmation of higher low pattern formation
4H VIEW HERE
The current market structure suggests this retracement will likely occur within the next 10-14days, creating the perfect entry window before the projected June rally toward the target zone.
This Phoenix pattern represents one of the clearest technical setups currently visible in the crypto market, offering a well-defined opportunity with precise entry, target, and invalidation levels.
HELP US WITH LIKE AND FOLLOW GUYS .. THANK YOU

pepe Updateentry price 0.00001425
stop loss update 0.00001425
take profit
0.00001172
0.00001022
0.0000086
result 1 target and risk free

Pepe towards 0.00001500 target personal idea: we can see some signs of recovery in market as the Bitcoin holding up of 102k price, if this scenario happened, pepe likely take 0.00001500 target. Good 🙂 luck 👍
