PEPE...Hello friends
Regarding the price drop, now that buyers are supporting the price, it was entered within the specified support ranges with capital and risk management.
*Trade safely with us*
PEPEUSDT trade ideas

PEPE/USDT:BUY LIMITHi friends
You can see that after the price fell in the specified support area, buyers came in and supported the price and created higher ceilings and floors.
Now we can buy at the specified levels with capital and risk management and move with it to the specified targets.
*Trade safely with us*

Pepe Bullish Gartley HarmonicI'll probably get told of for a lack of detail here. But this my friends, is a deadly bullish combo. Already bounced of 0.618, and coming back for the 0.618 on a POC for confluence.
I'm not guaranteeing this is bullish, BUT watch for the reaction of the 0.618 again! If we get a good reaction. Super bullish to cover my previous chart resistance levels.
Have to say, Chart Champions - Daniel. Not sponsored and genuine awesome traders. Love them! Check them out. I'm an absolute novice. Still and always will be learning. But Chart Champions are AWESOME! I LOVE THEM!

Strategy - Pepe Descending Triangle - TrainingUsing indicator - Market Order Bubbles by Laviathan
Firstly awesome indicator!
Love it for guaging high volume buying and selling (used for panic selling or panic buying).
The higher the volume the selling the bigger the red bubbles. Inversely, greedy buying, bigger green bubbles.
Sometimes, the bubbles are genuine, as literally big sell offs or strong buys.
So, a little strategy, using these bubbles with the trading 101's is very helpful.
Here a decending triangle on a 5 minute. Mental sell off's. Trading the decending triangle using the seel offs as a guide to add confluence to the decending triangle.
Just an example.
Still a great guide to trading 101s. :) www.ig.com
Couldnt publish on 5 minute. Put on a 5 minute time frame with Market Order Bubbles by Laviathan and you will see what I mean.
Happy trading :)

PEPEUSDT - bottomed out!Pepe has dropped by more than 80% in the past period, making it one of the most heavily declining coins.
The coin is now sitting on a very strong key support level, so we expect a strong rebound in the coming days.

Pepe - Elliott Wave Local and Long Term Idea 22 Mar 2025Eliiot Wave Update
Firstly, I'm bias that I believe were in Wave 4.
Depicted wave count 1 2 3 4 5 in orange may very well be as it is, in that the last low is 5. My bias comes in because from what I've read, 5th wave usually 1.27 fib extension drawn from 1 to 1 to 2. As can be seen, 1.272 is at 0.0000336.
The green paralellel channel from the high to the next higher high. As can be seen with circle support, we found a good reaction to the upside.
Short/medium term looking at the Anchored VWAP (White) and channel top as resistance.
Currently 1.0 a strong support as well as resistance.
My biase based wave theory means that were currently in the 4th wave to the upside, so looking at resitance EXACTLY at the anchored VWAP (white), breaking that to the upside targets of the short fibs drawn to the right that arent extended all the way to the right. Meaning, resistance being,0.382, 0.5, and 0.618.
If that is the end of Wave 4. The price would then see a retracemment to Wave 5, to 1.272.
Non bias view where Wave 5 has been hit already.
Were in a corrective ABC pattern. (This is the part I'm not so sure about).
Then Were in A(1) here no one knows how deep that is but it's good that were going up because A = up B = down and C = up (c or 3 being the longest waves.
If were in the corrective phase, currently were in Wave A (1).
Technically nothing changes. I think. Wait to see how It plays out.
Overall, currently I would NOT be bearish, looking at the next resistance first!Which is (either Wave 4 or correction) 0.236 price 0.000095

PEPE resparking the FLAME to PARABOLICA SKY from here. 0.0000070PEPE 2024 has been a rosy one to say the least.
It has gone parabolic last year reaching an impressive ATH of $0.00002803, a quadruple increase in its valuation.
This year, along side the mother coin BTC, the market went on a bleed mode season --cooling down what has heated up for so long. MEMEs suffer the most -- returning to ground back to the base, or even lower due to extreme volatility.
Today, PEPE is starting to show some basing behavior -- hinting of an impending price shift from the current range. It took weeks for this coin to accomplish this saturation levels.
We expect price to reverse to the upside from this bargain levels. A rare opportunity to seed before it re-attempt the multiple x price growth.
If you notice on our diagram, NET LONGS / BUYERS are trying to respark the price around here conveying massive accumulation -- pre hinting of a massive price surge ahead thats about to transpire soon.
BTC is also showing some long term shifting behavior -- which will benefit the market including PEPE. When the heat up starts, fomo season starts, and you know what happens thereafter.
Spotted at 0.00000700
Target at x4 price at ATH 0.00002803
TAYOR. Trade safely.

$PEPE is bouncing from key support!CRYPTOCAP:PEPE is bouncing from key support!
The price is holding inside an ascending channel, and history shows strong moves from this level.
If the trend holds, we could see another leg up soon!
Drop your thoughts below.

PEPE: Bear Market Bottom or Just a Dead Cat Bounce?Overview:
BINANCE:PEPEUSDT PEPE experienced a brutal three-month bear market, shedding around 80% of its value from its peak. Currently, PEPE is at a crucial juncture, having reached an important cluster support level—a zone historically respected by traders and often indicative of short-term reversals.
Technical Analysis:
- Bearish Trend (3 months): An 80% decline signals severe selling pressure, common in meme coins after parabolic rises.
- Cluster Support Zone: The current price area (highlighted clearly on the chart) has historically attracted buying interest. It has served multiple times as a pivot point.
- Price Action: The recent bounce looks tentative, indicative of a potential "dead cat bounce" scenario—a temporary recovery in prices before a continuation of the bearish trend.
Key Levels to Watch:
- Immediate Support: Current cluster around 0.006-0.007 USDT. A decisive break below may trigger another sharp sell-off.
- Resistance: Strong overhead resistance around 0.010 USDT, crucial for bulls to regain control. A failure to breach could confirm bearish continuation.
Opinion:
From my experience navigating multiple crypto cycles, meme coin rallies typically end in severe corrections like this one. A bounce at current levels is expected, but caution is essential. This looks like a classic bear market relief bounce rather than a true trend reversal.
Trading Strategy Recommendation:
- Short-term traders may consider playing the bounce cautiously, setting tight stops below the recent lows.
- Long-term investors should remain cautious. Wait for stronger confirmation, ideally above resistance at 0.010 USDT, to confirm the bearish trend is weakening.
Conclusion:
PEPE is currently at a critical inflection point. While a short-term bounce is probable, remain vigilant for confirmation before taking major positions. Protect your capital and trade wisely.
Stay safe & trade smart.
What do you think about PEPE's current situation? I'd love to hear your insights below.
#PEPE #CryptoTrading #TechnicalAnalysis #CryptoVeteran #TheCryptoFire

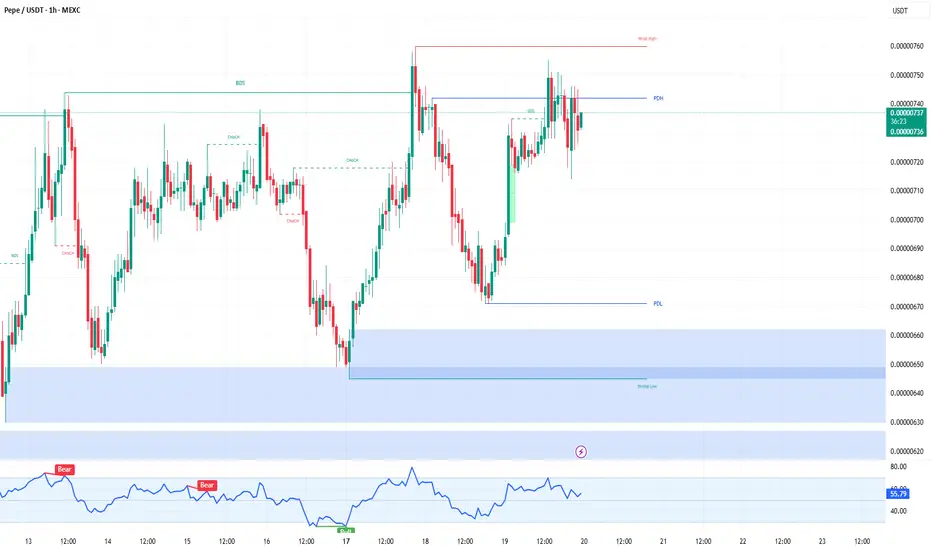
PEPE/USDT 1H: Testing Resistance – Can Bulls Push Toward 0.0000PEPE/USDT 1H: Testing Resistance – Can Bulls Push Toward 0.00000780?
🚀 Follow me on TradingView if you respect our charts! 📈 Daily updates!
Current Market Conditions (Confidence: 7/10):
Price at 0.00000734, currently testing a key resistance level.
RSI at 54.41, indicating neutral conditions with room for further upside.
Clean order block formation at 0.00000640, suggesting strong underlying support.
No significant divergences present, making confirmation crucial for continuation.
LONG Trade Setup:
Entry: 0.00000720 - 0.00000734 zone.
Targets:
T1: 0.00000760 (first resistance).
T2: 0.00000780 (next liquidity zone).
Stop Loss: 0.00000640 (below recent support).
Risk Score:
6/10 – Moderate risk setup; requires confirmation at resistance levels.
Market Maker Activity:
Accumulation visible at higher lows, with decreasing selling pressure.
Recent higher low formation suggests potential continuation toward upside targets.
Strong support established at 0.00000640, reinforcing a favorable risk-to-reward ratio.
Recommendation:
Long positions are favorable in the 0.00000720 - 0.00000734 range.
Watch for breakout confirmation above 0.00000740 before increasing exposure.
If rejection occurs at resistance, wait for a retest of 0.00000700 before re-entering.
🚀 Follow me on TradingView if you respect our charts! 📈 Daily updates!
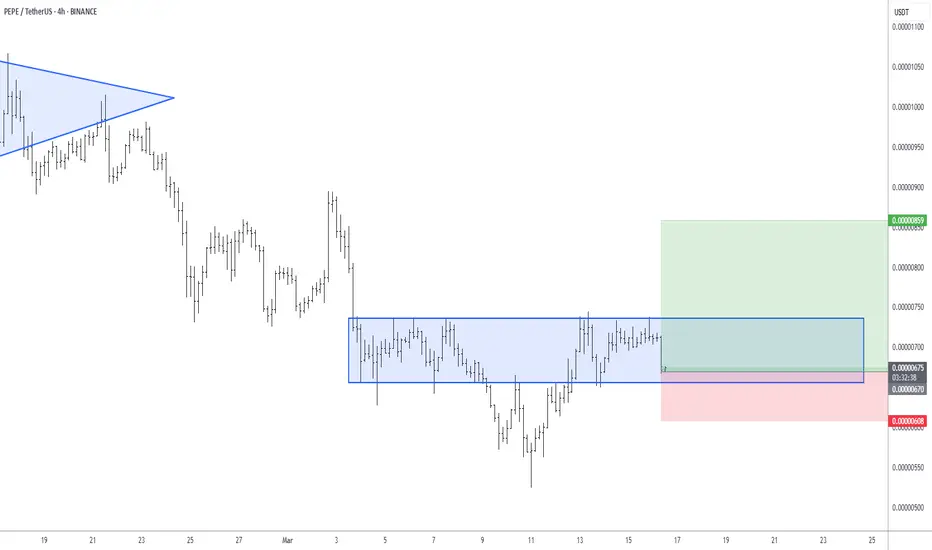
PEPEUSDT LongWe see consolidation on the PEPE H4 chart. Buyers have already been liquidated at the top of the downtrend. Now, the market is moving up to liquidate the sellers of this consolidation. Risk-reward ratio 1:3
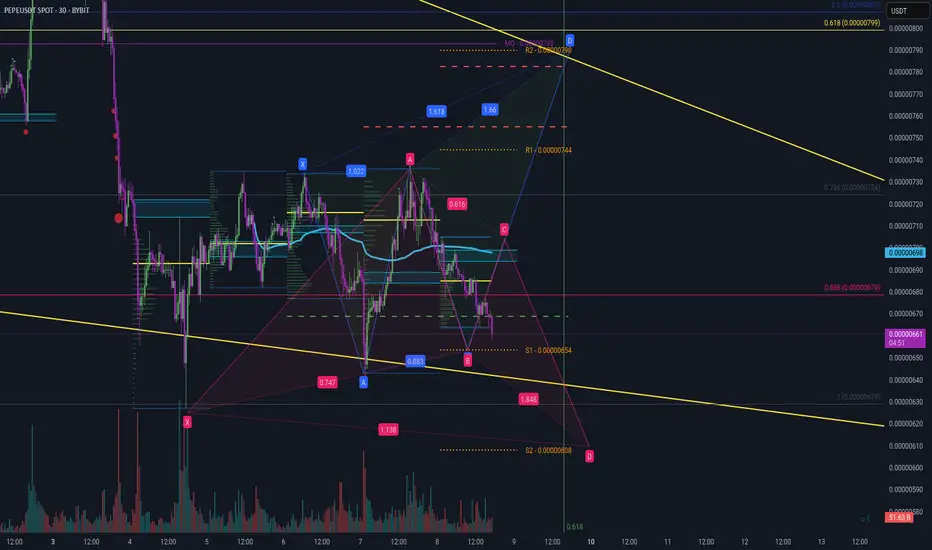
Pepe - Bullish Gartley B to DBullish Gartley continuation uptrend from previous uptrend.
Gartley drawn loking for continuation to the upside with Anchored VWAP and fibs. Anchored VWAP in white (Amen =))) .. previous trend here:

Pepe Previous Levels Trend Based Fib - Observation 1Trend based fibs pulled from A B C - in red left.
This is not the full picture, work with me BUT still levels. The downtrend is a 1-1 extension from high to low.
There is a caveat. I'll explain over the weekend. Basically the next level down is 1.618 at 0.0000464
Fib 1.0 current resistance.
Explain more over the weekend. We have time.

Pepe Previous Levels Trend Based Fib - Obs 1 - UpdateFlipped Resistance to Support from previous Trend Based Fib Extenstion as seen here:
Currently bouncing off the 1.0 fib which to left was a support, middle resistance, now support!
Taken the value area range of the initial Trend Based Fib to the current price and if you zoom out, the PoC of the Fixed Range Volume Profile is pointing to 0.5 Trend Based Fib.
Above resistance labelled.
I see no reason from writing, as long as we hold 1.0 fib to see higher, even after +10% rise already!
Technicals are bullish. Thats what they are.
There's also a parallel channel which seems to be well respected. As well as a possible end 5 wave extension found here:
That Gartley - I knew from previous bounces. When B AND D have a reaction at the same price
- SUPER BULLISH!
We had a fake out at the high, then came back down to B at 0.5 fib Gartley and rallied!
Enjoy! :)

I love pepe, pepe is one of good player of meme coinepersonal idea: pepe after of my last post about pepe rallied around, 300% and technically tested it's old resistance as support, currently is in the beginning of it's movements and first needs to pass 0/750 and in my opinion two prices should be watched 0/-105 and 0/-2, totally if Bitcoin record new ATH again, pepe also will record new ATH again. Good 🙂luck👍

Lingrid | PEPEUSDT anticipating a BEARISH Move after PullbackBINANCE:PEPEUSDT market declined to its August lows. Given that it has been in a bearish trend for over eight weeks, I anticipate that the price may now move sideways around this level to facilitate accumulation. Typically, following a period of strong momentum, markets tend to consolidate and trade in a horizontal pattern. Observing the price action, we can see that it is forming an ABC pullback, which often precedes a rollback. I expect the market to retest this support level, potentially establishing a range zone. Historically, if we look back, the price has previously formed a range zone before breaking through, and this pattern may repeat itself. My goal is support zone around 0.00000610
Traders, If you liked this educational post🎓, give it a boost 🚀 and drop a comment 📣

Is Pepe’s bearish trend about to test the 0.000005 support?Hello and greetings to all the crypto enthusiasts, ✌
All previous targets were nailed ✅! Now, let’s dive into a full analysis of the upcoming price potential for Pepe 🔍📈.
Pepe is currently positioned at the upper boundary of a descending channel, signaling potential bearish momentum. I foresee a minimum decline of 29%, targeting the critical support level at 0.000005. While the primary trend points downward, there may be temporary upward movements or periods of consolidation along the way. These fluctuations are typical in such market conditions and could offer brief opportunities for traders. Overall, the downward trajectory remains the dominant outlook.📚🙌
🧨 Our team's main opinion is: 🧨
Pepe’s stuck at the top of a falling channel, with a 29% drop to hit the 0.000005 support, but some quick pumps or sideways action might pop up. 📚🎇
Give me some energy !!
✨We invest hours crafting valuable ideas, and your support means everything—feel free to ask questions in the comments! 😊💬
Cheers, Mad Whale. 🐋


PEPEUSDT UPDATEPEPEUSDT is a cryptocurrency trading at $0.00729. Its target price is $0.01400, indicating a potential 100%+ gain. The pattern is a Bullish Falling Wedge, a reversal pattern signaling a trend change. This pattern suggests the downward trend may be ending. A breakout from the wedge could lead to a strong upward move. The Bullish Falling Wedge is a positive signal, indicating a potential price surge. Investors are optimistic about PEPEUSDT's future performance. The current price may be a buying opportunity. Reaching the target price would result in significant returns. PEPEUSDT is poised for a potential breakout and substantial gains.

Pepe - Internal Bullish & External Bearish Gartley - 11/03/2025Fistly, the only harmonis I can find that extends so far on C or D is shark harmonic. Not sure if these are actually valid however, I'm finding them useful to guage on fib retracements at very least!
Internal Gartley in Red - Target A - Mediumm term
External Gartley in Blue - Target D (Best case) at 1.618. Taking us to those evil 3 peaks!
Given these analysis on BTC and Futures, I'm pro bullish.
Just an idea. Happy trading. :)

Pepe Daily Targets 08 March 2025Hi guys, just thought to post my ideas for a setup.
Bullish Gartley at S2 retracement (RED)
Bearish Gartley at S1 retracement (BLUE)
Wait for confirmations - don't rush into any trades.
PEPEUSDT 2DPEPE ~ 2D Analysis
#PEPE If you still have a Conviction on this coin, maybe this support you can consider to start buying back with a short -term target of at least 15%+.

Key Resistance Zone for Pepe – 39% Drop Ahead?Hello and greetings to all the crypto enthusiasts, ✌
In several of my previous analyses, I have accurately identified and hit all of the gain targets. In this analysis, I aim to provide you with a comprehensive overview of the future price potential for PEPE , 📚💡
The price of Pepe Meme Coin has been experiencing an atypical and sharp downtrend, approaching a critical monthly resistance zone. If this resistance fails to hold, we could face another substantial drop of approximately 39% , potentially bringing the price to the 0.00000500 level. This price point serves as a significant support area, historically acting as a strong defense against further declines. The outcome largely hinges on whether this support can withstand the selling pressure in the coming days. 📚🎇
🧨 Our team's main opinion is: 🧨
Meme Coin Pepe is facing a sharp drop and nearing a key resistance; if it breaks, we could see a 39% decline to the 0.00000500 support level, which has historically held strong. 📚🙌
Give me some energy !!
✨We invest countless hours researching opportunities and crafting valuable ideas. Your support means the world to us! If you have any questions, feel free to drop them in the comment box.
Cheers, Mad Whale. 🐋
