PEPE Bullish Flag Daily time frame forming a bullish flag pattern for the next move up! Buy and hold!
PEPEUSDT trade ideas

SasanSeifi|Is PEPE Poised for Another ATH After Corrections?Hey there, In this analysis, we examine the price movement of BINANCE:PEPEUSDT cryptocurrency in the daily timeframe. As shown on the chart, the price started its bullish phase from the $0.000010 range and, after breaking the structural level (BMS) at $0.000012, attracted additional demand. This upward momentum pushed the price beyond its previous all-time high (ATH) of $0.000017, leading to the formation of a new ATH at $0.000025.
Currently, after a significant rally, PEPE has undergone minor corrections. These corrections appeared as a pullback to the previously broken resistance level, with the price showing a positive reaction at $0.000018. Given the current price behavior, it is anticipated that in the medium to long term, PEPE could reach new price targets at $0.000027, $0.000029, and $0.000030.
If the price can maintain the support levels between $0.000018 and $0.000017, the bullish trend is likely to continue, potentially reaching new ATHs.
❌However, given the highly volatile nature of this cryptocurrency and its characteristics as a meme coin, it is advisable to allocate only 1% of your portfolio to this asset.
💡 Keep in mind, this is just my personal perspective and shouldn't be considered as financial advice. I’d love to hear your thoughts and engage in a discussion!
Happy trading!✌😎
Feel free to reach out if you have any questions or need more clarification. I'm always here to assist!✌
If you want any further adjustments, just let me know!

Pepe outlookPepe has been trading in a giant megaphone pattern.
It has broken out of the flag pattern looking like it's going to test the top of the megaphone trend line.
Target 0.3 - 0.33
If it breaks out, price discovery.

$PEPE READY FOR THE NEXT LEGCRYPTOCAP:PEPE is forming a falling wedge pattern and should be ready for the next pump in a few days. In my opinion, the minimum target for this pump is $0.00003650.
Trade carefully
DYOR. Good luck! 🐂📈

PEPE USDTPepe is forming a bullish symmetrical triangle pattern.
Next move:
Breakout: $0.00002210
Target 1 : $0.00004100

Pepe (PEPE) may be poised for a new ATH. Here's why:Following the channel breakout rally in PEPE price creating an ATH in November, the meme coin shows a post-retest rally. As the bull run restarts in PEPE, bulls anticipate the rally to create a new ATH next week.
In the daily chart of PEPE, the meme coin shows a bullish recovery, regaining momentum. The ongoing recovery trend started near the $0.000075 with a Morning Star pattern.
This rally peaked at nearly 200%, nearly $0.000025. However, the falling channel breakout rally took a quick retest of the previous all-time high near the $0.000017223.
The 10% surge last night, creating a bullish engulfing candle, ended the five-day consecutive red-candle streak. It also marked the post-retest bounce back for the meme coin.
Currently, the bull run is extended with an intraday gain of 2.79% as the PEPE price trades at $0.00002126.
Using the trend-based Fibonacci levels, the uptrend is approaching the 23.60% Fibonacci level at $0.00002303. Considering that the recovery run of the broader market will be prolonged, the PEPE price bull run is likely to reach $0.00002989 by the end of November.
Hence, the PEPE price will explode with a massive upside of 40% in the next week. On the flip side, the $0.00001879 will likely provide bullish support.

BUY Opportunity for PEPE/USDT – More than +10% Upside Potential!Is it now, or will you miss the boat?
PEPE has broken out of a descending triangle pattern and is currently testing the breakout level near 0.00002000, offering an excellent buying opportunity with a potential upside of over 10%. This classic descending triangle breakout, combined with a pullback to retest the breakout line, often signals the beginning of a bullish trend.
Entry Plan:
Traders are advised to wait for rejection confirmation from 0.00002075 (support entry line) on lower timeframes (1H/30M) before entering. This validation ensures strong buyer activity and improves the chances of a successful trade.
Final Note:
PEPE is at a critical decision point. If buyers step in now, it could lead to a significant upward push. However, as with any trade, proceed with caution, monitor price action closely, and always manage risk effectively.
Sidenote:
Share your thoughts or results if you’re already trading this setup or planning to enter. Let’s grow together. Good luck! 🚀

Destiny PEPE 1HTraders who are in profit should take their profits, as this currency is expected to experience a 50% drop. The four-hour trend line has been broken in the past, and a pullback should occur in the direction of the break for continued growth. In any case, you are free to make your own decision.

Destiny PEPETraders who are in profit should take their profits, as this currency is expected to experience a 50% drop. The four-hour trend line has been broken in the past, and a pullback should occur in the direction of the break for continued growth. In any case, you are free to make your own decision.

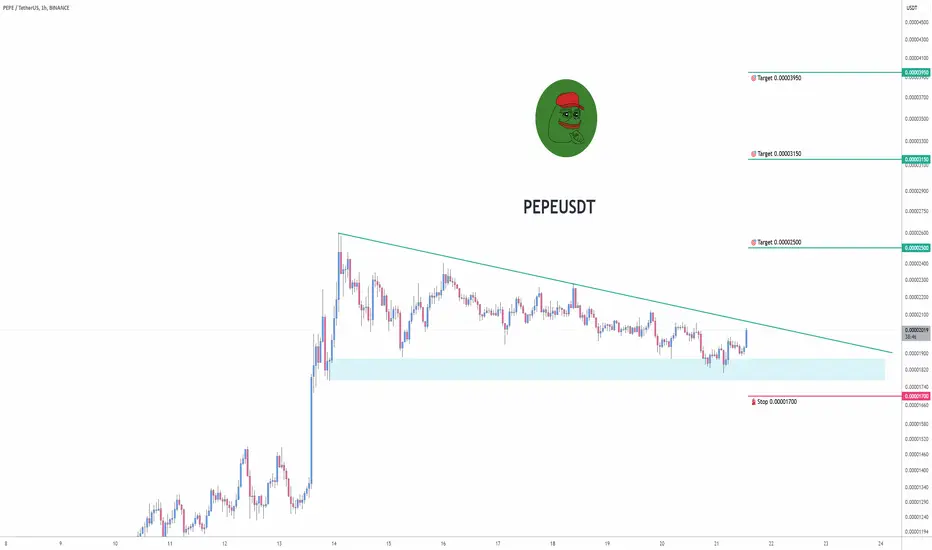
Trading opportunity for PEPEUSDTBased on technical factors there is a Buy position in :
📊 PEPEUSDT
🔵 Buy Now
🪫Stop loss 0.00001700
🔋Target 1 0.00002500
🔋Target 2 0.00003150
🔋Target 3 0.00003950
💸RISK : 1%
We hope it is profitable for you ❤️
Please support our activity with your likes👍 and comments📝
pepe is going to go crazy from these levelsI have marked up my levels where there is a high potential to go up and liquidity grab. There is valid pull back which will act as a inducement and a high probability buying zone. From these level pepe will bounce up making a new high so don't miss this opportunity.

PEPE Long Trade I think price is at a strong demand zone fro here and a long entry can be taken .
BTC is also showing bullish signs so expecting the entire market to start going up overall.
Strong buying volume coming in as well

PEPE Long : Bull Pennant On 4hr timeframe we have the bullish entry trigger (morning star candlestick pattern formation within demand zone).
Ready for break out now. Next target area is 0.0003 region .

Big Pets: Are $PEPE, $BONK, $FLOKI, and $WIF Preparing for the NBig Pets: Are CRYPTOCAP:PEPE , CRYPTOCAP:BONK , CRYPTOCAP:FLOKI , and CRYPTOCAP:WIF Preparing for the Next Big Move? 🚀
The "Big Pets" tokens— CRYPTOCAP:PEPE , CRYPTOCAP:BONK , CRYPTOCAP:FLOKI , and CRYPTOCAP:WIF —have already delivered impressive gains of 80-100% from earlier entry points. 🚨 But what’s next?
📊 Current Market Status:
These tokens are now entering a consolidation phase, where prices stabilize after sharp rallies.
This phase often signals accumulation, where savvy traders position themselves for the next upside leg.
Holding key support areas during consolidation is
While consolidation may take time, these tokens remain in focus for their potential to deliver another round of explosive growth. As always, trade cautiously and look for solid setups before making moves.
@RosePremiumm

PEPE Long Update : Bull PennantAt first pattern being formed looked like a symmetrical triangle but is actually a bullish pennant.
Wait for big candlestick break above upper resistance line for confirmation trigger

PEPE new ATH is coming Hello and greetings to all the crypto enthusiasts, ✌
In this analysis, I aim to provide you with a comprehensive overview of the future price potential for PEPE, 📚💣
A substantial and encouraging influx of capital has recently been directed towards this stock, reflecting strong investor confidence and growing market interest. This surge in investment activity is particularly noteworthy, as it signals a positive shift in sentiment towards the stock's future performance. At the same time, the key first-layer Fibonacci support levels have been holding up effectively, providing a solid foundation for the price action and reaffirming the strength of the current trend. These technical indicators suggest a robust level of price stability and resilience, even in the face of potential market fluctuations. 📚💡
Given this favorable combination of capital inflow and solid technical support, the stock appears to be on the verge of a significant upward movement. In the near term, we could witness an establishing a new historical high. Such a move would not only signal the continuation of the stock's bullish momentum but also present new opportunities for both short- and long-term investors. As the market dynamics continue to unfold, this stock seems poised for impressive growth, making it a key one to watch in the coming months. 📚🙌
🧨 Our team's main opinion is A significant influx of capital and strong first-layer Fibonacci support levels suggest the stock is well-positioned for substantial growth. In the near future, a sharp rally and a potential new all-time high are likely. 🧨
Thank you for your attention. If you have any questions or comments, I’m here to respond to you. 🐋💡


PEPE ~40% Imminent Breakout?!The breakout to the upside appears to have failed, and the retest of the resistance trendline strengthens this view.
The price seems likely to head towards the demand zone unless strong bullish momentum develops to invalidate the current bearish sentiment.
Monitor closely for signs of strength or weakness near the demand zone or during another attempt at the resistance level.
BINANCE:PEPEUSDT

A currency that I always loved #pepeThis currency has always been profitable for me, so far I have not lost on this currency.
When the falling trend line was broken, I entered and took a profit of almost 20%. Now this currency has shown a good position for an upward movement. If you are going to buy from these places, don't forget risk and capital management.

Symmetrical breakoutIf PEPE breaks out of the descending symmetrical triangle, a buy will be possble

PEPE Long : Symmetrical Triangle PathwayI have used trend lines to try and plot out the expected move for the symmetrical triangle pattern .
The key thing is the highs and lows; doesn't usually shape out in the conventional manner.

PEPE Long : Symmetrical TrianglePrice action for PEPE has formed symmetrical triangle pattern.
Break out above upper resistance on 1 hr time frame.
Next target is 0.3 area.
