Pepeusdt trading opportunityPEPEUSDT remains in an uptrend, recently breaking above a bullish pennant structure, suggesting a strong potential to reach the current setup target. The plan now is to seek buy opportunities on a retest of the previous all-time high (ATH) level. An immediate demand zone is also marked in case of a deeper pullback, while the final target is provided to support informed decision-making.
PEPEUSDT trade ideas

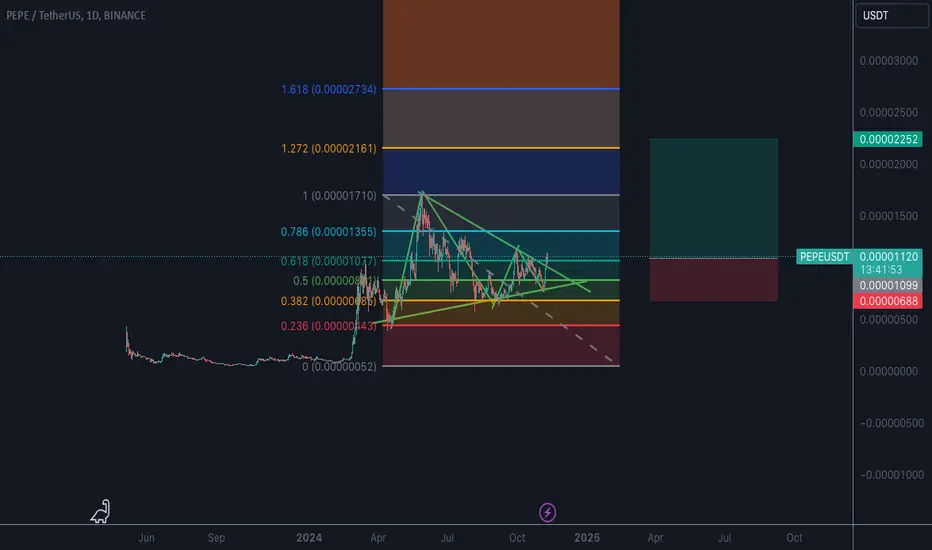
PEPE - NO CONTEXT - UPDATE
I have a god feeling that we are in a wave 4 formation and I think it will be a Running Triangle for the fact that we have seen 150% extension for it wave B- but I am not disregarding the fact that we could get other variation such as a Flat, Running Flat or an Extended Flat. Either way we will see BINANCE:PEPEUSDT losing at least 10-20% in coming weeks. (see previous analysis for context)
OTHER ANALYSIS
BINANCE:ARBUSDT
BINANCE:PEOPLEUSDT
BINANCE:RSRUSDT
BINANCE:NEARUSDT

PEPE price targets its highest level since May 2024PEPE price has been on a strong rally, climbing nearly 60% over the past seven days. The bullish momentum has been fueled by positive technical indicators, including supportive EMA lines and a healthy RSI level.
However, some signs suggest that while buyers remain in control, the intensity of the uptrend may be starting to moderate.
PEPE’s Relative Strength Index (RSI) is currently at 60.56, down from nearly 80 just a few days ago. This decrease indicates that the buying pressure has eased significantly after reaching overbought conditions.
PEPE’s EMA lines are currently displaying a very strong bullish configuration, with short-term EMAs positioned above long-term EMAs, and the price sitting comfortably above all of them.
If the uptrend continues, PEPE could test its next resistance at $0.00001580. Should this resistance be broken, the price could potentially climb to $0.00001726, which would be its highest level since May—a move representing a possible 30.85% increase.
However, if the bullish momentum fades and selling pressure emerges, PEPE price could correct down to a support level of around $0.00001084.
If this support fails, the price could drop further to $0.0000089, marking a potential 32% decline from current levels.

Here I buy Pepe at $0.000018Time to buy Pepecoin too
Market orders starting at $0.000018
and Pepe suppy shock is happening
There is a big difference between knowing the path and walking the path
You know the path
I walk the path
That's what I'm doing here:
Walking the path
so please don't disturb my alteseason
Because the path has just begun.

I'll look for shorts in #PEPE/USDT in 1-hour TF!I'll look for shorts in #PEPE/USDT in 1-hour TF!
Will be waiting to see something like this. CRYPTOCAP:PEPE local resistance level is PWH $0.000013, and the support level is PMH $0.0000115.

Is #PEPE Ready for another Massive Rally or Not? Key Levels Yello! Is #PEPEUSDT on the verge of a breakout or are we about to see a major reversal? Here's what you need to know right now about #PEPE:
💎#PEPEUSDT is showing strong signs of a bullish continuation as it moves from a key support level toward retesting the minor resistance above. If price action holds momentum here, we could witness a break above the descending trendline, setting the stage for a powerful bullish surge. Over time, we’ve noticed that #PEPE consistently respects this resistance zone, and if momentum sustains, an imminent breakout is on the horizon.
💎However, the bullish scenario isn't confirmed yet. The crucial level to watch is the minor resistance at $0.0000118. We need a decisive break above this level, accompanied by strong engulfing candles and sustained momentum. Until that happens, we must stay cautious and avoid rushing into positions. It’s all about patience in these moments.
💎If #Pepe fails to break above $0.0000118 and loses momentum, the bears may take control. In that case, the key level to monitor is the bullish order block (OB) between $0.0000069-$0.0000074. This zone has already been tested twice and has held strong. If the price rebounds here, the bullish outlook could remain intact.
💎On the other hand, if #PEPE breaks below this Bullish OB, the next target would be the major support at $0.0000059. A fall below that, and the bullish setup would be invalidated, likely triggering a sharp drop in price.
Stay focused, patient, and disciplined, Paradisers! 🥂
MyCryptoParadise
iFeel the success🌴

PEPEPEPE is a meme coin launched on Ethereum that gained popularity and resulted in high-volume trades. If Pepe maintains this high-volume trade, future growth will happen; most probably. Currently, Pepe is in a downtrend move and has to wait for the price to break the downtrend line. Two possible scenarios are depicted on the chart. Let's see what happens.
P.S. PEPE is a meme coin. So be careful with your trades since sudden popularity and high-volume trades will bring high oscillations.

pepe usdt This currency has not been satisfied with giving so far and it has good goals according to technical analysis..
patience, patience, patience

pepe usdt update Do you remember this currency when I analyzed it in July 2023.. Check the previous analysis
the price was 0.0000180 reached 800% and I did not benefit from it:( because I forgot to enter :)
Anyway, now I believe you will achieve 300% profits
good luck

PEPE Technical Outlook: Bulls and Bears Battle Near Key LevelsIn the latest analysis of BINANCE:PEPEUSDT , the 1-hour chart reveals a complex interplay of resistance and support levels, presenting traders with a mix of signals. The current price stands at $0.00001226, showing a pullback from a recent high of $0.00001245, indicating a struggle to break through higher resistance.
Key resistance levels to monitor include $0.00001267 and $0.00001297. A surge in buying momentum could lead to a bullish trend if these levels are surpassed. Conversely, strong support is identified at $0.00001192, $0.00001178, and $0.00001073. Maintaining above these levels is essential for any potential recovery.
The analysis of moving averages shows the 9 EMA hovering around the 20 EMA, reflecting market indecision. The MACD indicates a bearish inclination, while the RSI remains neutral at 52, suggesting traders should exercise caution before making aggressive moves.
For those considering trading strategies, a long position may be validated by a close above $0.00001267, targeting $0.00001297 with a stop loss at $0.00001192. Alternatively, a short position could be warranted if the price fails to hold above $0.00001192, with potential targets at $0.00001178 or $0.00001073.
Overall, PEPE's technical indicators suggest a balanced yet cautious market outlook. Traders are encouraged to seek further confirmation before making significant decisions.


PEPEUSDT two major daily support aheadTwo major daily supports now are going to stop the price from more correction and fall which are:
A. 0.000008$
B. 0.000004$
we are looking for rise and gain for price after touching these supports like green arrows mentioned on the chart.
DISCLAIMER: ((trade based on your own decision))
<

PEPE: Keep an eye on this level! If you're looking to trade PEPE at the moment, here's a quick setup that you might find helpful!
The idea is: Buy when the price breaks above 0.0000116$ and take profits at the levels shown in the chart.
Targets:
1. 0.000012$
2. 0.0000129$
3. 0.0000138$
-------------------------------------------
About our trades:
Our success rate is notably high, with 10 out of 11 posted trade setups achieving at least their first target upon a breakout price breach (The most on TW!). Our TradingView page serves as a testament to this claim, and we invite you to verify it!

PEPE DAILYRULES:
-If price break Point 2, 4, 6, or 8 cancel the setup
-Price needs to break Point 1, 3, 5, or 7 to confirm the setup
When price reach the 100FE(BLUE BOX) it normally does a pullback/retest or reversal
The market can Truncate(fall short)

Ascending Triangle SetupHighlighted is the setup formation for an ascending triangle .
-Price broke out of pennant resistance line
-Ascending triangle pattern begun to form ; higher lows with increased attempt at breaking out of triangle resistance line.
-Price breaks out of triangle resistance and retraces flipping resistance to support .
-Long position triggered on break above new higher high with SL below the last low below the new support

PEPE take profit level TP 1Previously i marked my levels on Pepe buy and now its flying. But we need to book our profits on a certain level. Here i have marked my non mitigated valid ob. If incase any rejection or sweep, then we can take out profit in this particular zone. Overall Pepe is bullish and showing a very rapid momentum.

PEPE/USDT BUY NOW!!!!!!!On 1D timeframe pepeusdt created a falling wedge pattern and breakouts was completed from the demand now is heading to revisit 0.00001729 am going long from this point holding till new highs and liquidity run.....
JOIN AND ENJOY
Lets know your take on this............?

PEPE/USDTPEPE/USDT
the price has successfully reached the first target at 0.00001270 USDT following a bullish breakout from the converging triangle pattern. This achievement boosts confidence in the continuation of the uptrend, suggesting that the price may advance toward the next targets at
0.00001389$
0.00001508$
Sustained buying momentum and holding above the support level at 0.00001136$ support the potential for reaching these remaining targets.

PEPEUSDT - deserve to be in ur portfolioConsolidated a massive bullish pennant in 3D chart
u can see the price action and how the last candle respect the 0.618fib level
successful breakout make it rise in midterm
Best regards Ceciliones🎯

Pepe Update: Market Conditions Have Not ChangedI am using the same drawings as before for this update to show that market conditions remain the same. I only adjusted the upper trendline to account for the latest pull-back. Each time a target is hit, there is a pull-back or retrace.
We are looking at PEPEUSDT with a bearish bias. The bearish bias is based on a long-term sequence of lower highs and lower lows. Our SHORT trade hit 5 targets already and this pull-back opened the door for a new entry, a second chance.
After the 4-November session, we had three very strong green candles. The fourth candle, yesterday, ended red and as a reversal signal. Today's candle is also red. This chart setup can be traded with a tight stop-loss. I say with a tight stop-loss because even though the bias is bearish, market conditions can always change.
Lower highs lead to lower lows. Everything on the chart is pointing lower and we trade based on the chart.
Today can be a decisive day. A weak close, reinforces the bearish bias and secures the next drop. A strong close (bullish), would put this chart setup at risk.
Thanks a lot for your continued support, it is truly appreciated.
Patience is key.
Namaste.

PEPE Long : Bull PennantLooks like PEPE price is done consolidating and potential big move to the upside in play .
Looking at higher timeframe bull pennant pattern formed .
The meme cycle continues $PEPEThe exciting cycle and incessant hype around memes continues, which not only sustains but also intensifies interest in these digital phenomena. Bitcoin, for its part, is not left out of this wave, updating its all-time highs (ATH), leading to a significant reallocation of liquidity in the market.
Large investment funds, such as a16z, are beginning to take a serious interest in the meme sector, seeing them not only as entertainment but also as potential for investment. This shows that memes are turning from simple Internet jokes into full-fledged financial instruments that attract serious capital.
A detailed review is expected to be published in the near future that will reveal how memes work in the cryptoeconomy - from their creation to their peaks of popularity and possibly decline. This will provide a better understanding of how memes influence market trends and how they can be used to predict or even shape investment strategies.
Horban Brothers!

Pepe Price Set for Breakout Amidst Whale Accumulation The Pepe (PEPE) token is once again capturing attention as it gears up for what analysts predict could be a remarkable 200% price breakout. Trading at $0.00001051, Pepe’s price action has been fueled by intensified whale activity, a promising symmetrical triangle pattern, and a steady stream of buying pressure. This combination of technical and fundamental indicators suggests that PEPE could be on the cusp of a substantial price surge, making it a focal point in the current crypto market.
Technical Analysis
PEPE’s price movement within a symmetrical triangle pattern—a chart formation typically signaling potential for a breakout—is drawing interest. This technical pattern, characterized by converging trend lines that indicate a balance between buyers and sellers, often concludes with a decisive move once price exits the triangle. As CRYPTOCAP:PEPE consolidates within this formation, crypto analyst World of Charts highlights that a breakout above the upper resistance line could propel the token to new highs.
A number of technical indicators align with this optimistic outlook:
1. MACD (Moving Average Convergence Divergence): The MACD is bullish, with the MACD line diverging above the signal line, signaling positive momentum and increasing buying pressure. This setup often precedes strong upward movement.
2. RSI (Relative Strength Index): Currently, the RSI stands at 69, placing PEPE in bullish territory but not yet indicating overbought conditions. This level suggests the token has room for further gains before encountering potential selling pressure.
3. Resistance and Support Levels: PEPE is approaching an immediate resistance level around $0.00001092. Analysts suggest that breaking past this level could pave the way for a climb toward $0.00001350, supported by continued volume and buying interest.
Whale Accumulation and Community Optimism
Whale activity has further strengthened the case for a bullish breakout. Significant holders, often called “whales,” have withdrawn massive amounts of PEPE tokens from exchanges, implying confidence in a price rise. For instance, one whale recently withdrew 535.81 billion PEPE tokens—worth over $5 million—from Binance. Such large withdrawals are typically seen as a signal of strong investor confidence, as whales often hold onto tokens in anticipation of price appreciation.
This accumulation by whales has increased optimism within the PEPE community. As whale addresses continue moving tokens off exchanges, it suggests a strategy to hold and wait for potential future gains, potentially limiting the immediate supply available on exchanges and contributing to upward price pressure.
Robinhood’s Expansion: Growing Accessibility and Demand for PEPE
In a boost to PEPE’s accessibility, Robinhood recently launched a PEPE transfer feature for European users. This move expands the token’s availability, potentially increasing its demand and adoption across the European crypto market. With PEPE’s heightened exposure, more retail investors could join the wave, adding to the bullish sentiment already building around the token.
Sentiment, Profitability, and Market Impact
Beyond technical indicators, PEPE’s recent price action reflects a broader increase in profitability and bullish sentiment. According to data from IntoTheBlock, approximately 72% of PEPE holders are currently “in the money,” which has helped sustain buying interest and long-term holding within the community. This profitability metric underlines the appeal of PEPE to its existing base and may draw in new investors looking to capitalize on its growth potential.
The combination of whale accumulation, profitable holders, and heightened demand reinforces the bullish outlook for PEPE. If the breakout is confirmed by a surge in volume and price movement above resistance levels, analysts project that PEPE could see gains up to 200%, solidifying its position as a high-growth token in the market.
Conclusion
As PEPE’s price consolidates within the symmetrical triangle pattern, the convergence of technical and fundamental indicators suggests the token is positioning itself for a major move. Should it break past resistance levels with continued whale support, increased accessibility via Robinhood, and strong community sentiment, PEPE could indeed reach a new price target of approximately $0.00001350, offering a substantial return for its holders.
For now, all eyes are on PEPE’s resistance levels and the bullish indicators that point toward a potential breakout. As trading volume and whale interest continue to build, PEPE could be set for a breakout that cements its role as a key player in the altcoin market.
