Pepe Coin Battles Last Defenses For 17% Move To $0.000013Hello✌️
Let’s analyze Pepe Coin’s price action both technically and fundamentally 📈.
🔍Fundamental analysis:
Big holders own 43% of PEPE, which can make prices jump or drop fast. If price stays above $0.000010 it could hold steady, but selling near $0.000014 might slow gains.
📊Technical analys
Related pairs

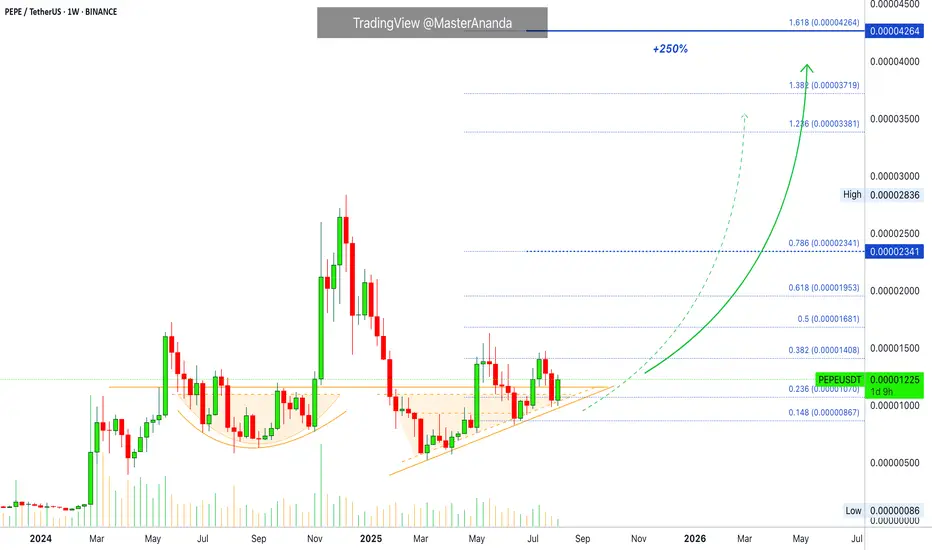
Pepeusdt trading opportunityPEPEUSDT remains in an uptrend, recently breaking above a bullish pennant structure, suggesting a strong potential to reach the current setup target. The plan now is to seek buy opportunities on a retest of the previous all-time high (ATH) level. An immediate demand zone is also marked in case of a

Major trendline resistance is broken also retest completed One of the major resistances which was red trendline is now broken also retest is completed and market is ready to explode and pump to the upside if BINANCE:BTCUSDT hold strong.
major supports and resistances are also all mentioned on the chart.
First target is easy to hit now but for second one

Pepe Update · 5th Dimensional Technical Analysis & Rising PricesThe energy changes. Do we really have to look at a chart?
The market sentiment is so different when the market is trending compared to when the market is sideways. The energy is very different when the market is dropping compared to when it is rising. We can tell what is coming based on how the mar
PEPEUSDT AND LONGPOSITIONAnd Pepe is a lovely and popular cryptocurrency and a great buy trading opportunity for the next three to six months with a great risk to reward.
Follow me and boost my analysis for timely and very low risk purchases and great signals.
Contact me in the comments section or private message

Head And Shoulders Continuing to fall?Context 1:
Supply Zone: 00000400 - 00000970
Support: 00000975 - 00001075
Demand Zone: 0001798 - 00002850
Resistance: 00001550 -00001420
Psychological Levels: 00001500, 00001000
Context 2:
Technical Structure 1: Top Down Analysis shows us a Head and Shoulders pattern of which we are in the final sta
Buy SignalTrend in trends of a major W and a minor w after a descending channel.
Tp has been indicated

PEPE Breakout Watch – Red Resistance Being Tested! 🚨 CRYPTOCAP:PEPE Breakout Watch – Red Resistance Being Tested! 🔴⏳
CRYPTOCAP:PEPE is testing the red resistance zone.
📊 If breakout confirms, next move could target:
🎯 First Target → Green line level
A breakout could trigger bullish continuation and upside momentum.

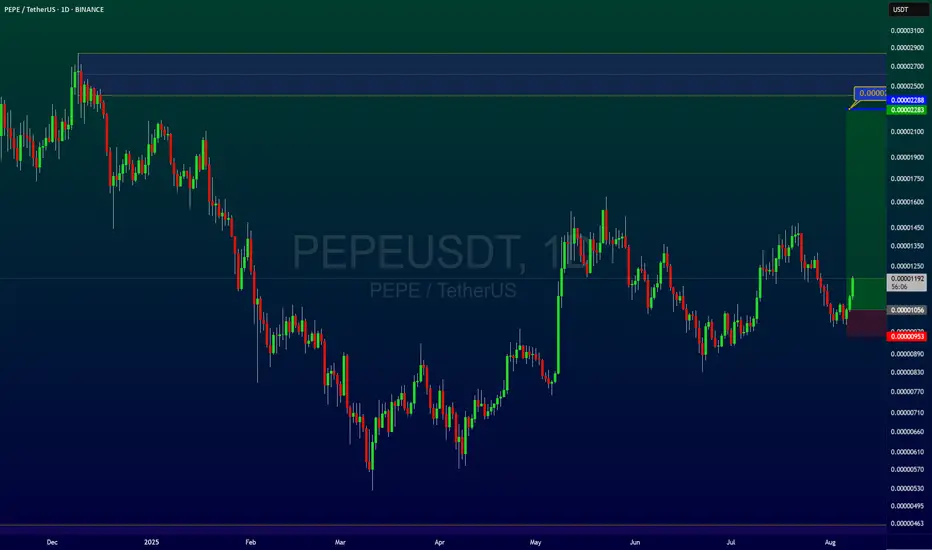
PEPE/USDT Technical Analysis – August 10, 2025📊 PEPE/USDT Technical Analysis – August 10, 2025
On the weekly timeframe, PEPE has successfully bounced from its long-term ascending trendline, showing a notable bullish reaction. Currently, the price is approaching the key resistance at 0.00001213.
🔹 Bullish Scenario:
If this resistance is broken

See all ideas
Summarizing what the indicators are suggesting.
Oscillators
Neutral
SellBuy
Strong sellStrong buy
Strong sellSellNeutralBuyStrong buy
Oscillators
Neutral
SellBuy
Strong sellStrong buy
Strong sellSellNeutralBuyStrong buy
Summary
Neutral
SellBuy
Strong sellStrong buy
Strong sellSellNeutralBuyStrong buy
Summary
Neutral
SellBuy
Strong sellStrong buy
Strong sellSellNeutralBuyStrong buy
Summary
Neutral
SellBuy
Strong sellStrong buy
Strong sellSellNeutralBuyStrong buy
Moving Averages
Neutral
SellBuy
Strong sellStrong buy
Strong sellSellNeutralBuyStrong buy
Moving Averages
Neutral
SellBuy
Strong sellStrong buy
Strong sellSellNeutralBuyStrong buy
Displays a symbol's price movements over previous years to identify recurring trends.
Frequently Asked Questions
The current price of PEPE / UST (PEPE) is 0.00001151 USDT — it has fallen −5.01% in the past 24 hours. Try placing this info into the context by checking out what coins are also gaining and losing at the moment and seeing PEPE price chart.
PEPE / UST price has risen by 8.17% over the last week, its month performance shows a −7.78% decrease, and as for the last year, PEPE / UST has increased by 44.96%. See more dynamics on PEPE price chart.
Keep track of coins' changes with our Crypto Coins Heatmap.
Keep track of coins' changes with our Crypto Coins Heatmap.
PEPE / UST (PEPE) reached its highest price on Dec 9, 2024 — it amounted to 0.00002820 USDT. Find more insights on the PEPE price chart.
See the list of crypto gainers and choose what best fits your strategy.
See the list of crypto gainers and choose what best fits your strategy.
PEPE / UST (PEPE) reached the lowest price of 0.00000061 USDT on Sep 17, 2023. View more PEPE / UST dynamics on the price chart.
See the list of crypto losers to find unexpected opportunities.
See the list of crypto losers to find unexpected opportunities.
The safest choice when buying PEPE is to go to a well-known crypto exchange. Some of the popular names are Binance, Coinbase, Kraken. But you'll have to find a reliable broker and create an account first. You can trade PEPE right from TradingView charts — just choose a broker and connect to your account.
Crypto markets are famous for their volatility, so one should study all the available stats before adding crypto assets to their portfolio. Very often it's technical analysis that comes in handy. We prepared technical ratings for PEPE / UST (PEPE): today its technical analysis shows the buy signal, and according to the 1 week rating PEPE shows the buy signal. And you'd better dig deeper and study 1 month rating too — it's buy. Find inspiration in PEPE / UST trading ideas and keep track of what's moving crypto markets with our crypto news feed.
PEPE / UST (PEPE) is just as reliable as any other crypto asset — this corner of the world market is highly volatile. Today, for instance, PEPE / UST is estimated as 2.85% volatile. The only thing it means is that you must prepare and examine all available information before making a decision. And if you're not sure about PEPE / UST, you can find more inspiration in our curated watchlists.
You can discuss PEPE / UST (PEPE) with other users in our public chats, Minds or in the comments to Ideas.