PEPEUST trade ideas

$PEPE will hit ATH again and again?analysis using SNR ORIGINAL Chart Pattern. trade at ur own risk ya. stick with SL

PEPE/USDT 1H: Bulls Poised for a Breakout to $0.00002100!PEPE/USDT 1H Chart Analysis
🚀 Follow me on Tradingview if you respect our charts 📈
Current Market Analysis:
Price: Consolidating in a tight range.
RSI: Bullish divergence at 40, indicating potential reversal.
Support: $0.00001450
Resistance: $0.00001750
Trade Setup (Confidence Level: 7.5/10):
Entry Zone: $0.00001500-$0.00001550
Targets:
T1: $0.00001750 (previous resistance).
T2: $0.00001900.
T3: $0.00002100.
Stop Loss: Below $0.00001400.
Risk/Reward: Favorable with a 1:3 ratio.
Smart Money Analysis:
Accumulation: Visible at support level, suggesting preparation for an upward move.
Liquidity Target: Market makers likely aiming above $0.00001900.
RSI Divergence: Hidden bullish divergence supports the bullish case.
Risk Score: 7/10 (moderate risk, manageable with position sizing).
Recommendation:
A long position is favorable within the entry zone.
Employ strict risk management to safeguard against potential downside.
Watch for volume confirmation as price approaches resistance levels.
Confidence Level: 7.5/10 for a bullish setup.
🚀 Follow me on Tradingview if you respect our charts 📈

PEPE USDT LongPEPE USDT can show bullish run due to divergence at RSI, we can take entry at current level keeping the stop loss below the last low.

$PEPE - Price Action, MACD, RSI, Stoch RSII have had accumulated some Pepe back in May of 2023. I have not sold any and am looking to exit my position sometime this year.
I have charted up the divergence between Price action making lower lows while RSI and MACD have made higher lows. I have gone back through the past to find 3 different examples of divergences resulting in trend shifts from being bullish to bearish. Then after the bearish correction with some time you can see that there is a consolidation period. RSI MACD And Stoch RSI resets. Price RSI and MACD then diverge and after sometime price will base or then break out of a base resulting into a higher leg up.
Pepe has been a very well performing Crypto Coin and has yet to make a higher high this year. Last time was in dec of 2024.
I am currently looking for continued consolidation, Divergence of Price action RSI and MACD which I see some development of and I expect that in the near future we will see another leg Higher. What I will look for is a break out either above or below the consolidation and see how that correlates to the indicators I am starting off using this year. I do expect a higher leg up given the current environment of a President, Regulators and sentiment Leaning PRO Crypto.

PEPE/USDT Breakout or Fakeout?The price has broken through our LL. Now the question is: is this just a false breakout and will the price actually continue in the buy direction or will it continue in the sell direction after rebounding from the LL? To avoid bad trades, we need to wait for confirmation from the market.
What do you think – will the price continue in the sell direction or is this just a false breakout and it will continue in the buy direction?

PEPE/USDT 1H: Bulls Gearing Up for a Reversal!PEPE/USDT 1H Chart Analysis
Current Price: $0.00001528
Market Structure:
Bearish trend with lower highs and lower lows.
Consolidation phase near potential reversal zone.
Smart Money Analysis:
Distribution phase evident after the recent high at $0.000021.
Multiple Break of Structure (BOS) confirmations to the downside.
RSI indicating bullish divergence, suggesting potential reversal.
Trade Setup (Confidence Level: 7.5/10):
Entry Zone: $0.00001500-$0.00001528
Targets:
T1: $0.00001650
T2: $0.00001750
Stop Loss: Below $0.00001450
Market Maker Activity:
Accumulation signals at current price levels.
Selling volume exhaustion indicates a possible shift in momentum.
Discount blocks formed, highlighting a likely reversal area.
Key Observations:
RSI bullish divergence supports a reversal setup.
Smart money appears to be accumulating in preparation for a potential upside move.
Recommendation:
Consider a long position within the entry range, keeping tight stops.
Monitor volume and breakout confirmations for sustained bullish momentum.
Confidence Score: 7.5/10 for a cautious bullish setup.

PEPE bullish scenarioPrice has come back down to the gap.
Might see it drop once more to get liquidity.
If it does push up after, watch out when it approaches resistance near the top of that descernding channel

Pepe is bearishI am in short postion on this memecoin because Bitcoin and eth look in bearish trend aswell

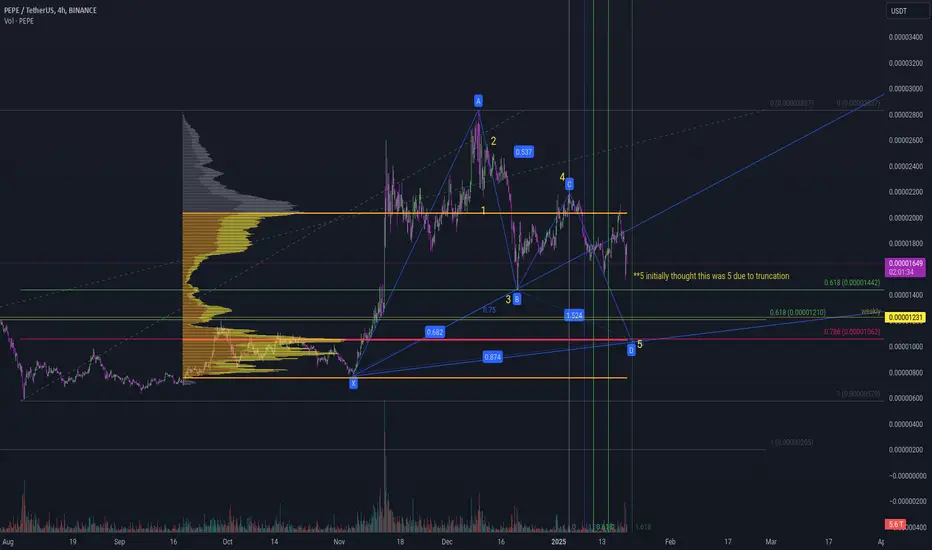
Pepe - Elliot Wave with Volume ProfileRevised Gartley Harmonic / Elliot Wave(s) with Volume Profile as confluence.
Tracking this as price and time moves on. I'm 99.99% sure that Wave 1234 are correct. Reading along with a book and all the levels match.
The trick is getting the last 5th wave correct!? Why? Because it hasn't played out yet. :D Its easy once its happened already.
The real think, and I dont think its me. "They" dont make it easy. Initially I thought with sceptisism because I read it, that 9 times out of 10 it looks like Wave 5 is truncated but its likely that Wave 5 hasnt played out yet. I think this is the case.
I think were, probably still in the 5th wave. Gartley and levels along with Volume profile to judge the end of the 5th wave.
Side note. Previous post with BTC/USD. Similar but for that asset Wave 2 hasn't played out.
Important to know that I'm only learning.
Thank you
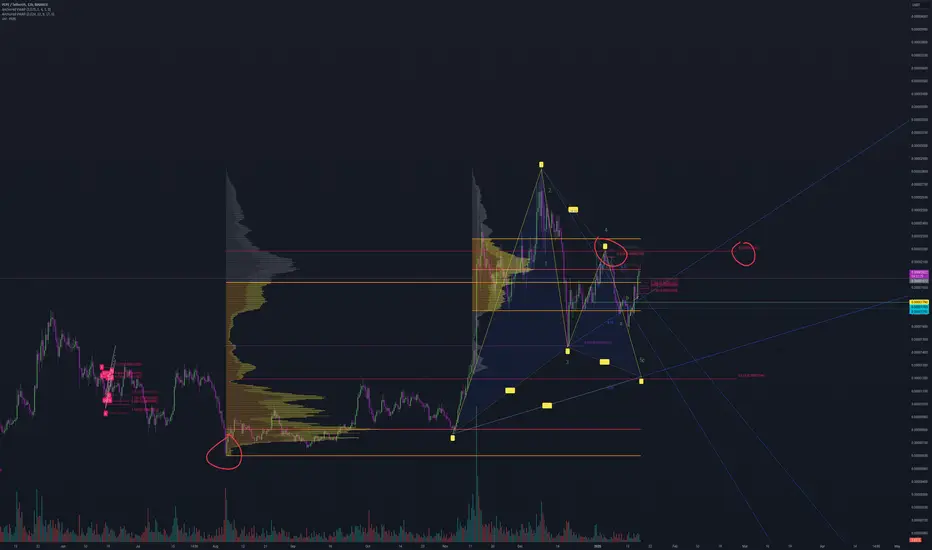
Pepe - Zoomed in ABC (123)Gartley Harmonic into Wave 3 grand cycle. Gartrley Harmonic then from D. Massive Wave 3?!

Confirmation will be the break of .00001500Im new to this....
but my thinking is that many memes are losing momentum,
and that this needs to head toward the lower BBand.
Support level is shown below.
Any feedback is appreciated

$PEPE - Mini DistributionOn the daily chart, we can see a mini-distribution is taking place on CRYPTOCAP:PEPE
The immediate resistance is currently at .000020
If we lose .0000168 support, we can see it retesting .000012s or it can wick down to daily imbalance at .00009 area

Pepe - Important Level 2WaveThis pink line is the line that determines the next wave structure! i.e. UP or Down TREND!
Reading my book! :D But want to stress the importance of this line.

PEPE Took this Scalp trade on $PEPE.
I think we see a continuation here. Straight-up parabolic since day one. CRYPTOCAP:PEPE

PEPE chart levels to watch PEPE left chart RSI shows when goes below green trendline is time to buy.
Right chart yellow arrows show when daily orange EMA21 goes above yellow MA55 after being below it. These are failed rallies.
Right chart red arrows show when daily orange EMA21 goes above yellow MA55 after being below it. These are confirmed rallies.
We are waiting to see next cross of the daily EMA21 over MA55 and expect a confirmed rally.
Trendline above shows target with yellow fib level major target for parabolic move.
Don't forget to smash that rocket like button!

Pepe Volume Profile GartleyVolume Profile low to highest low for 0.618. Looking for confluence based on my previous posts.
Pepe Gartley Phase 0Hey guys, based on my previous post, this is the big daddy of waves. I'm not sure as yet how to describe this because of time. Looks like this is the bigger picture from the last post. All leading as confluence to the low.
If I'm right will post my findings.

Pepe Gartley PhaseHey guys, Gartley Harmonic formation ultimately playing out. I was trying to depict in previous charts how the outer and inner Gartleys all correlate.
This just an idea lets see how it plays out.
JCIG!

Pepe Gartley Phase 1Hey guys, emotions are hectic as are mine. Been doing some analysis, in all the excitement this is what I have at the moment. 3 Phases in my opinion. I cant get the charts with the same Layout to show three charts on the same layout at the same time!
So 0.786 large ABC pattern. 0.618. See if we break this level. I don't think it will. Post later the broader picture.

#PEPE: Fundamental Insights & Risk Disclaimer **Description:**
Discover a comprehensive trading strategy for **PEPE**, the popular meme-inspired cryptocurrency, combining fundamental analysis and risk management. PEPE has gained significant attention in the crypto market due to its strong community backing and viral appeal. This strategy focuses on leveraging key fundamentals, such as market sentiment, community engagement, and adoption trends, to identify potential entry and exit points.
**Fundamental Insights:**
PEPE's value is heavily influenced by its meme culture and social media presence. The token thrives on community-driven momentum, making it highly volatile yet potentially rewarding. Key factors to monitor include social media trends, influencer endorsements, and trading volume spikes. Additionally, keep an eye on broader market conditions, as PEPE often mirrors the performance of major cryptocurrencies like Bitcoin and Ethereum.
**Risk Disclaimer:**
Cryptocurrency trading, including PEPE, involves substantial risk and may not be suitable for all investors. The market is highly volatile, and prices can fluctuate dramatically within short periods. Always conduct your own research and consider your financial situation before trading. Never invest more than you can afford to lose. This strategy is for informational purposes only and does not constitute financial advice.
By combining fundamental analysis with disciplined risk management, this PEPE trading strategy aims to help you navigate the dynamic crypto market effectively. Stay informed, stay cautious, and trade responsibly.

PEPE long Mid-Term IDEAokay so what we can see today is PEPE on the 1D time frame rebouncing from the support level.
info:
PEPE has made a strong resistance/support pattern starting from 2024 January,
which has just been hit again with it seems to be the same reaction as before.
if we can trust that the History will repeat it self then we can expect another 160% move these months.
i am still learning so recommend keeping it in mind for until it hits the resistance and when it breaks enter so you can secure a 60% profit.

PEPE/USDT 1H Analysis: Bearish Momentum ContinuesPEPE/USDT 1H Analysis: Bearish Momentum Continues
Current price: $0.00001605, down 0.19%, reflecting strong bearish pressure.
Support and resistance:
Immediate support: $0.0000155 – potential short-term relief zone.
Key resistance: $0.0000177 – acting as a barrier for recovery attempts.
Recent price action:
Clear breakdown from the equilibrium zone, with price falling through multiple support levels.
Consecutive red candles breached the POL (Point of Loss) level, signaling persistent selling pressure.
Volume profile:
Indicates an ongoing distribution phase, with sellers dominating the market.
Trade setup:
Rated 3/10 for longs – current conditions are unfavorable for bullish entries.
Best to wait for:
A clear reversal signal.
Formation of a double bottom around key support zones.
Market outlook: Bearish sentiment dominates until price reclaims resistance at $0.0000177 or shows signs of accumulation.
What’s your perspective on this bearish structure? Drop your insights below! 📉👀
