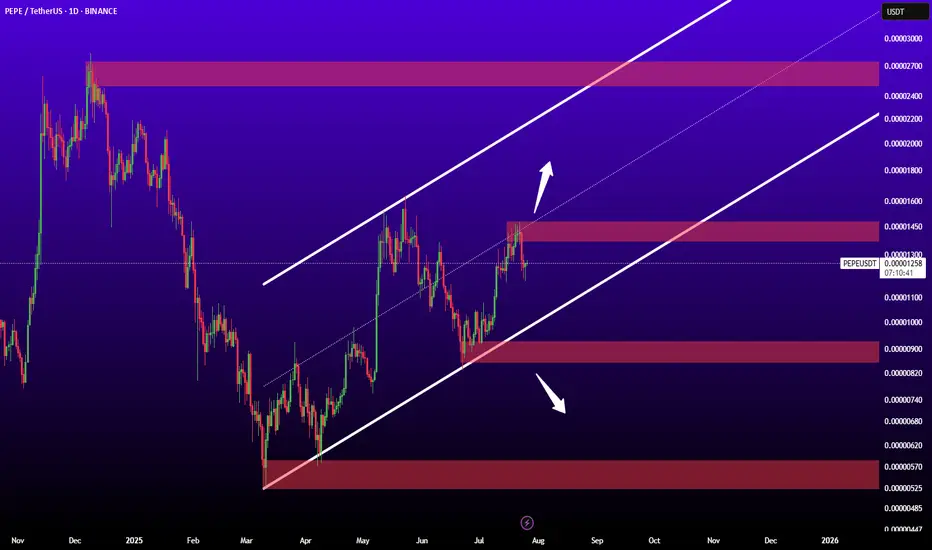
PEPEUSDTIf reaked midlle trend channel may ready for jump to nest levels.
Key levels:
0.00002700
0.0000145
0.00000900
0.00000570
PEPEUST trade ideas
PEPEUSDT – Downtrend Breakout & Golden Zone Retest in Play!📊 Chart Analysis:
On this daily timeframe chart of PEPEUSDT, price has successfully broken above the descending trendline that had capped the price since late 2024. This breakout is a strong early signal that bearish momentum is weakening and a potential trend reversal may be underway.
After the breakout, the price is now performing a retest at a key confluence support zone, including:
Fibonacci Retracement levels 0.5 (0.000011580) and 0.618 (0.000010835) — the Golden Zone
Previous horizontal demand zone (highlighted in yellow)
Retest of the broken descending trendline
This retest area will be crucial for determining the next directional move.
---
🐂 Bullish Scenario:
If price holds above the Fibonacci Golden Zone and forms a bullish confirmation candle, we could see a continuation of the uptrend toward:
0.000014191
0.000015000
0.000016836
0.000021533 (medium-term target)
Possibly retesting the High at 0.000028364
This would confirm the start of a major trend reversal and renewed bullish momentum.
---
🐻 Bearish Scenario:
If price fails to hold above the 0.000010835 level and breaks down below the Golden Zone:
Expect a drop toward psychological support around 0.000010000
And potentially further down to the strong support near 0.000007000
Such a move would invalidate the breakout and put PEPE back into a consolidation or extended downtrend phase.
---
🧠 Chart Pattern Notes:
Descending Trendline Breakout
Golden Zone Retest (Fibonacci 0.5 & 0.618)
Potential formation of an Inverted Head & Shoulders pattern (in early stages)
---
🎯 Conclusion:
PEPEUSDT is at a critical turning point after breaking out of a long-term downtrend. If the support at the Golden Zone holds, there is strong potential for a sustained bullish rally. However, traders should remain cautious and apply proper risk management in case of a breakdown below key levels.
#PEPEUSDT #CryptoBreakout #GoldenZoneRetest #TechnicalAnalysis #FibonacciLevels #PEPECoin #AltcoinAnalysis #TrendReversal #BullishSetup #BearishRisk

PEPE last season alive?🔥 The alt season is beginning on the market. Many alts are yielding tens and even hundreds of percent per day. But there are also those among them from whom we clearly expected more.
And I'm talking about old memes like Doge, PEPE, SHIB, and others.
Over the past month, PEPE has grown by only 60%. Is everything really that bad? Let me explain:
1️⃣ The latest growth impulse formed a divergence with the price in terms of volume. Throughout the growth over the last 4 months, purchase volumes continued to decline. This signals a waning interest in PEPE as the price rises.
2️⃣ Money Flow also shows a near-total lack of new liquidity. Fresh money is not flowing into the asset, and even now, in such an euphoric phase, PEPE's liquidity indicator is in the neutral zone.
3️⃣ PEPE has formed a local lower high and has already deviated from resistance at $0.00001439. It has already corrected by 6% today. This shows that there is currently no liquidity in the asset to drive the price higher.
4️⃣ GAP was formed at the levels of $0.00001241 - $0.00001027. And as we know, 99% of GAPs close sooner or later.
Nevertheless, we see high levels of interest at lower prices. When the fifth 0 appears. However, these zones can also change quickly in the event of a major correction of the entire market, and no other correction will bring the asset to such prices in the short term.
📌 Conclusion:
Right now, old memes really do look sad. Thousands of new memes are created every day that can give big returns, and people are asking themselves, “If I buy a meme with no value, why should I buy an old one?”
🔔 So, at current prices, PEPE is clearly of no interest to anyone. But, as is usually the case, once such coins fall below a certain price, whales will take positions and start pushing them up. Everyone will suddenly notice how undervalued this wonderful coin was.
So, for those who want to buy, I advise you to relax, you are not missing out on anything. And there will definitely be better prices for buying.
And stay in tune by subscribing, for more insightful ideas!

Are old PEPE meme dead?🔥 The alt season is beginning on the market. Many alts are yielding tens and even hundreds of percent per day. But there are also those among them from whom we clearly expected more.
And I'm talking about old memes like Doge, PEPE, SHIB, and others.
Over the past month, PEPE has grown by only 60%. Is everything really that bad? Let me explain:
1️⃣ The latest growth impulse formed a divergence with the price in terms of volume. Throughout the growth over the last 4 months, purchase volumes continued to decline. This signals a waning interest in PEPE as the price rises.
2️⃣ Money Flow also shows a near-total lack of new liquidity. Fresh money is not flowing into the asset, and even now, in such an euphoric phase, PEPE's liquidity indicator is in the neutral zone.
3️⃣ PEPE has formed a local lower high and has already deviated from resistance at $0.00001439. It has already corrected by 6% today. This shows that there is currently no liquidity in the asset to drive the price higher.
4️⃣ GAP was formed at the levels of $0.00001241 - $0.00001027. And as we know, 99% of GAPs close sooner or later.
Nevertheless, we see high levels of interest at lower prices. When the fifth 0 appears. However, these zones can also change quickly in the event of a major correction of the entire market, and no other correction will bring the asset to such prices in the short term.
📌 Conclusion:
Right now, old memes really do look sad. Thousands of new memes are created every day that can give big returns, and people are asking themselves, “If I buy a meme with no value, why should I buy an old one?”
🔔 So, at current prices, PEPE is clearly of no interest to anyone. But, as is usually the case, once such coins fall below a certain price, whales will take positions and start pushing them up. Everyone will suddenly notice how undervalued this wonderful coin was.
So, for those who want to buy, I advise you to relax, you are not missing out on anything. And there will definitely be better prices for buying.
And stay in tune by subscribing, for more insightful ideas!

Bounce or Breakdown? PEPE Eyes 0.000016 Target!38% BounceHello✌
Let’s analyze PEPE memecoin’s upcoming price potential 📈.
BINANCE:PEPEUSDT is approaching a key daily support level, which also aligns with the 0.61 Fibonacci retracement. If this level holds, a potential bounce toward the 0.000016 area could offer around 38% upside. 📈🟢
✨We put love into every post!
Your support inspires us 💛 Drop a comment we’d love to hear from you! Thanks , Mad Whale

PEPE – Highest Weekly Close in 6 Months: Eyes on New HighsMajor Breakout Level:
Last week’s candle closed above the 1W S/R (~0.000013845), marking the highest weekly close in half a year.
Bullish Structure:
Price reclaimed and closed above a crucial weekly resistance. This flips the structure bullish, increasing odds of continuation.
Next Targets:
Immediate resistance lies near the 1M S/R (around 0.000020193–0.000020272). Break and close above opens way toward the 1.27–1.618 Fib extensions (0.000029793+).
Invalidation:
Failure to hold above the 1W S/R and a weekly close back below (~0.000013845) would invalidate the breakout, putting risk back toward mid-range support (0.000009697).
The weekly close above key resistance signals strong buyer interest and market acceptance of higher prices, especially after a multi-month consolidation. This “highest close in 6 months” is a classic trend continuation setup. The next natural target is the higher time frame resistance (1M S/R), with Fibs aligning to previous price action. Failure to hold the breakout level would suggest a failed move and likely mean-reversion.

$PEPEUSDT Breakout: 180% Ahead?CRYPTOCAP:PEPE just broke out of a long-term triangle.
If the move holds, it could pump up to 0.00002313, that’s a potential 180% gain.
Watch for a retest before making a decision.
DYOR, NFA

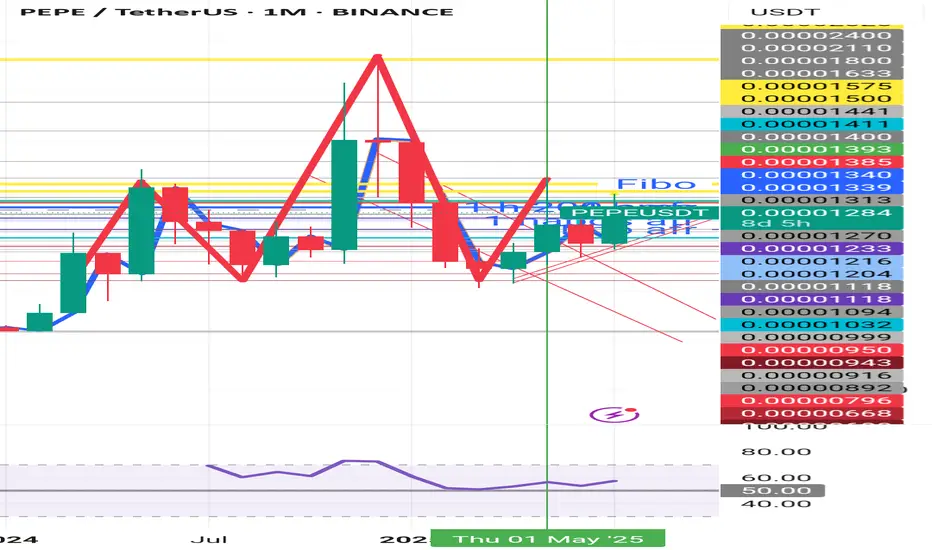
Is the alt season over at Pepe?PEPE
This is not a little suspicious to me. H&S is forming on a 1-month timeframe. I also discovered 4 divergences on a 4-hour timeframe looking back at the past few weeks, which may support my assumption that this is what the off-season was all about and a longer break may be in order.
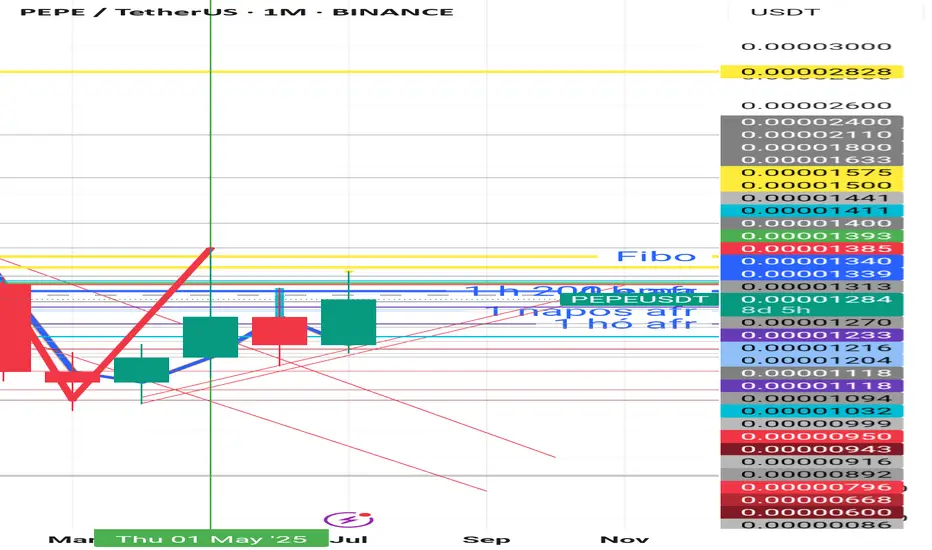
Was that all the offseason was for Pepe?PEPE
This is not a little suspicious to me. H&S is forming on a 1-month timeframe. I also discovered 4 divergences on a 4-hour timeframe looking back at the past few weeks, which may support my assumption that this is what the off-season was all about and a longer break may be in order.
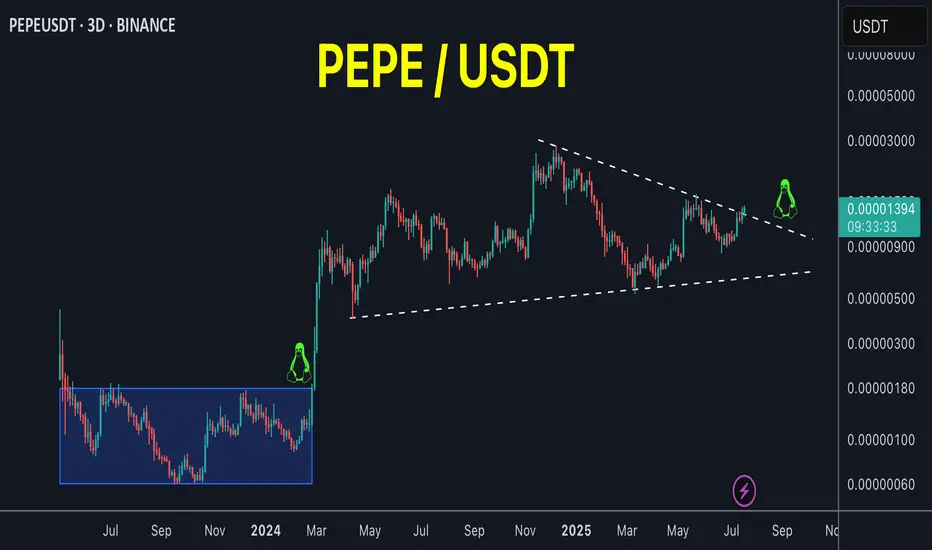
PEPE on the verge of breakout!PEPE / USDT
Price is trying to breakout massive downtrend line since 7 months
Incase of breakout we will see strong bullish momentum
Keep an eye on it
Crypto BOOMING What Does that Mean? PEPEI've entered crypto when it was low and it paid off it can take a long time, but you will make your profit back and some more as long as your patient I see this making 300% later if it comes back to my sweet spot
BINANCE:PEPEUSDT
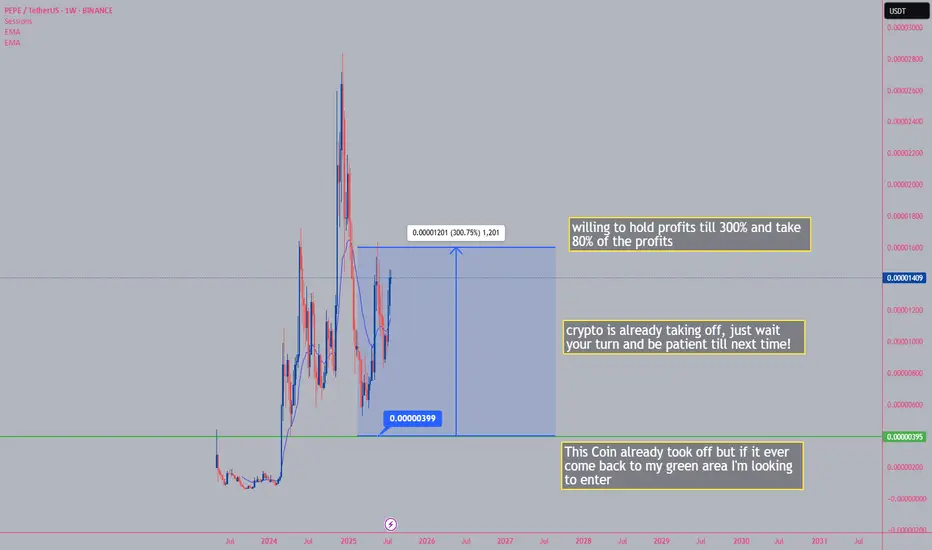
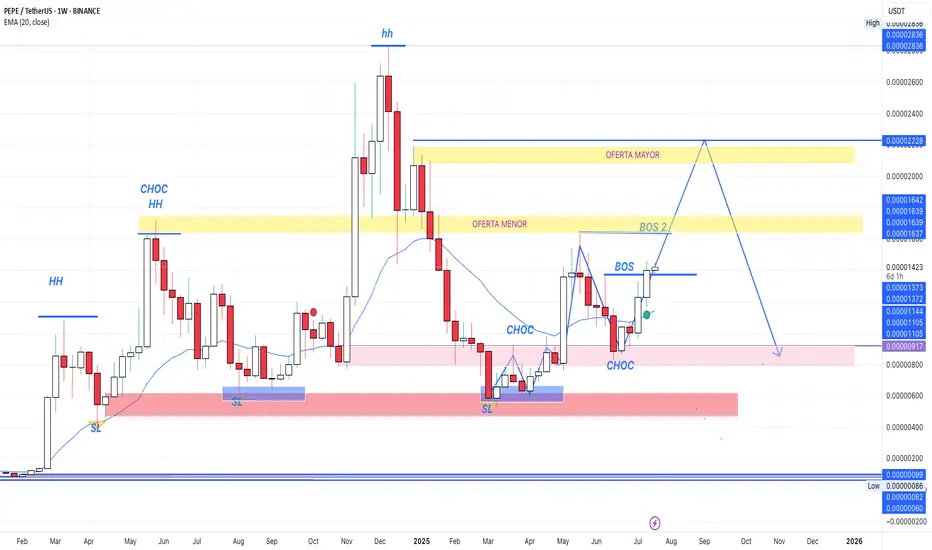
TAKE PROFIT .00001639-.00001642 ? In a weekly analysis:
I bought Pepe in the lower demand zone, held the loss, and I plan to take partial profits in the lower supply zone while leaving some positions to capture gains in the higher supply zone.

$PEPE going up. Double in the weeks ahead?CRYPTOCAP:PEPE has one of the highest beta for meme coin with high trading volume. Over 400k of hodlers on chain. Looks likely to double from here in the weeks to come as BTC D drops.

PEPEUSDT Dipping Down for Key Zone 0.00001230 to TouchBINANCE:PEPEUSDT has been quite on bullish trend and last week has been stopped being bullish, and started ranging, now PEPEUSDT will correct itself slightly by dipping down towards 0.00001230 which is very important level.
After 0.00001230 then next key level is 0.00001117 but we need to see if it really need to go down there or will bounce back up from 0.00001230.
0.00001327 is the Key Resistance Level, if its respected well then our target is very obvious to hit.
Use proper risk management
Lets monitor.
Use proper risk management.
Disclaimer: only idea, not advice

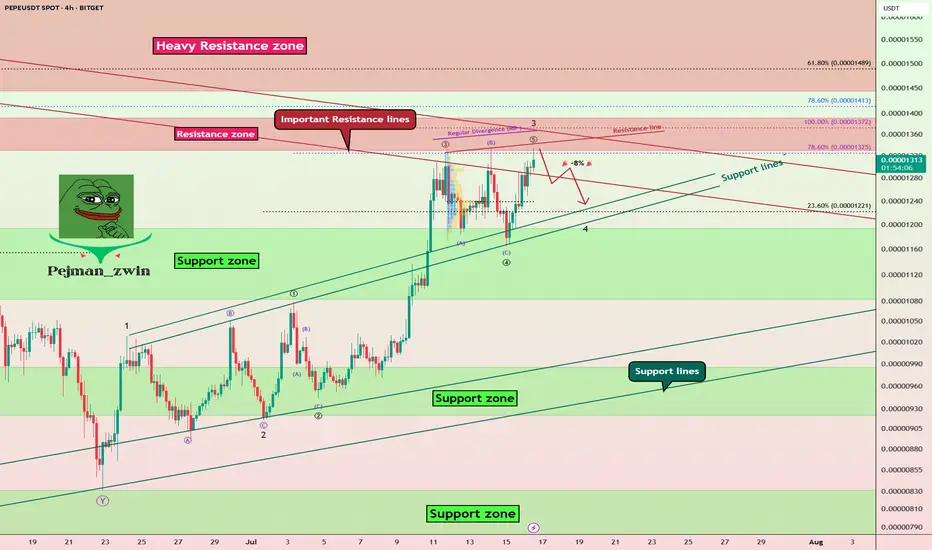
PEPE Faces Key Resistances – Is a -8% Pullback Coming?The PEPE memecoin ( BINANCE:PEPEUSDT ) is currently near the Resistance zone($0.00001392-$0.00001330) and Important Resistance lines . This is the third time that PEPE has attacked the Important Resistance lines .
In terms of Elliott wave theory , it seems that PEPE is completing the microwave 5 of the main wave 3 , so that the main wave 3 is of the extended type .
Also, we can see the Regular Divergence(RD-) between Consecutive Peaks.
I expect a -8% drop for PEPE in the coming hours.
First Target: $0.00001251
Second Target: $0.00001212
Note: Stop Loss(SL)= $0.00001400
Please respect each other's ideas and express them politely if you agree or disagree.
PEPE Analyze (PEPEUSDT), 4-hour time frame.
Be sure to follow the updated ideas.
Do not forget to put a Stop loss for your positions (For every position you want to open).
Please follow your strategy and updates; this is just my Idea, and I will gladly see your ideas in this post.
Please do not forget the ✅' like '✅ button 🙏😊 & Share it with your friends; thanks, and Trade safe.
PEPEUSDT broken trendline and bullish market aheadAs we can see on the major resistances which was red trendline broke and price now after more range here or without it can see more gain at least to the targets like 0.000017$.
DISCLAIMER: ((trade based on your own decision))
<<press like👍 if you enjoy💚

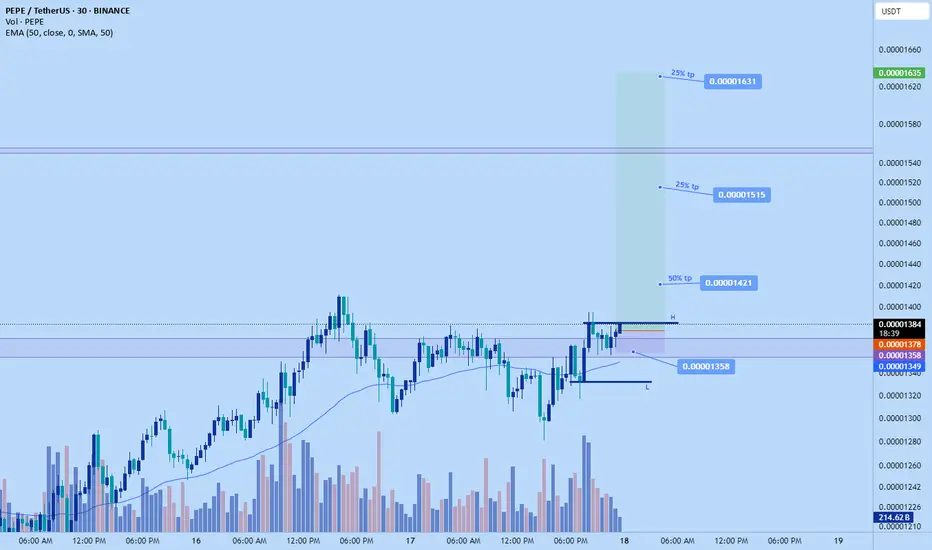
PEpe long to $0.00001635Just hopped into a pepe long long. Mainly aiming for the $0.00001421 target in the night but if the market decides to pump hard I'll scale out gradually until $0.00001631
DTT analysis applied. Learn more on my x page.
sL: $0.00001358
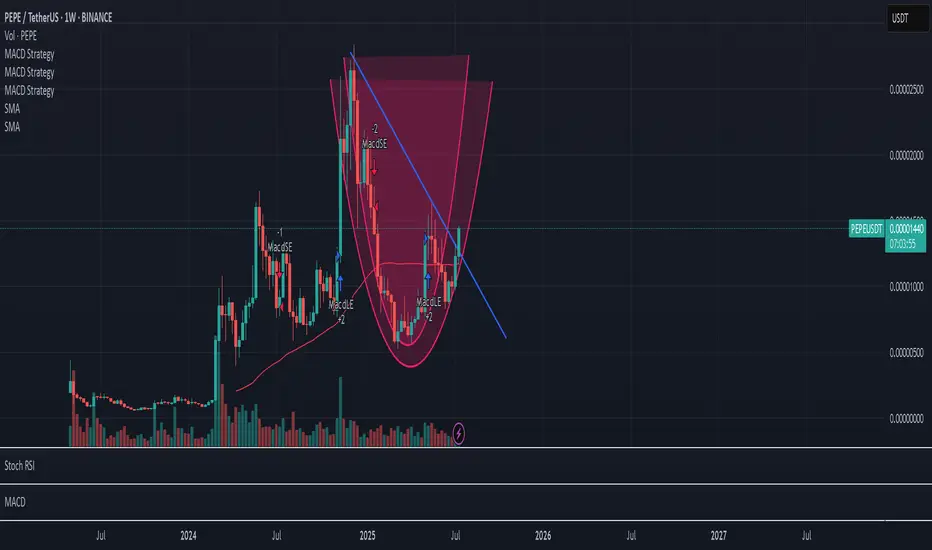
PEPE Pressing Into Its Macro Downtrend — AgainPEPE is back at the same trendline that’s slapped it down twice before — but this third attempt comes with strength.
We’ve got higher lows, reclaimed support, and a solid grind into resistance.
Still, a macro downtrend is a macro downtrend… until it breaks.
This next move will decide if this is the real deal or just another fakeout.
#PEPE #PEPEUSDT #MemeCoinCharts #CryptoAnalysis #TrendlineTest #BacktestEverything #TradingView #QuantTradingPro #CryptoBreakout

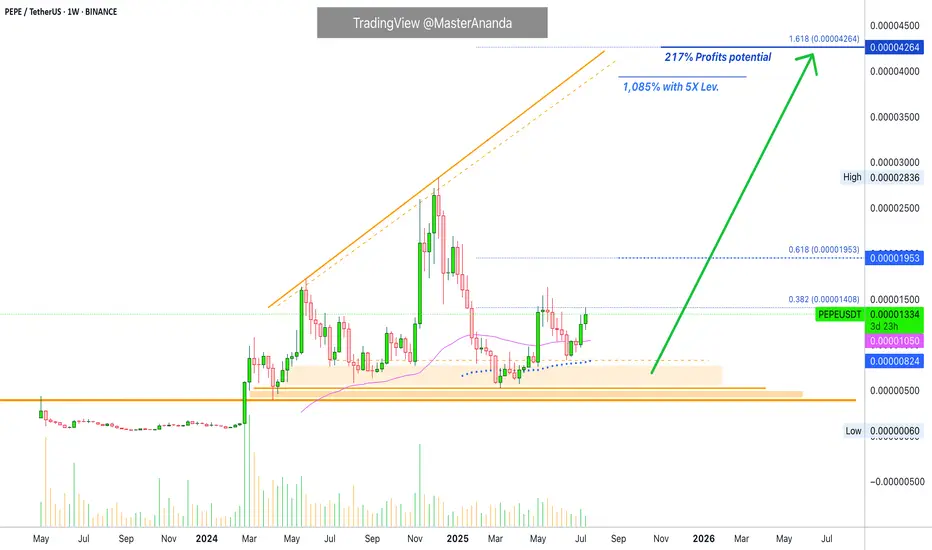
Pepe's Bullish Bias Intensifies · 217% PP = 1085% 5X Lev.The bullish bias for PEPEUSDT is starting to intensify, still early of course. It is still early on this one because the action is still lower than the 19-May high. There are many projects that are already trading above their last high. So it is good news to find a pair that is moving below because we know that soon it will be moving above. In the coming days.
While the 19-May wick high reached 0.00001632, the weekly close happened at 0.00001361. As you can see from the chart, the current price is already higher than the highest weekly close and this gives us a strong bullish signal.
Notice again how the action moved above EMA89 back in mid-April. When the retrace happened, May-June, the recovery happened above this level. A signal of strength.
PEPEUSDT moved briefly below EMA55 only two recover and this is the second week above this level. Trading weekly above EMA55 & EMA89 means that the bullish bias is fully confirmed. A fully confirmed bullish bias means we are set to witness a higher high, and a higher high means prices moving above 0.00001953, short-term. In a matter of days.
The main target for this move is 0.00004264 giving us a nice 217%. With 5X leverage, relatively low risk, that would be beyond 11X (1,085%).
In a matter of days, the entire altcoins market will be bullish and moving higher. Make sure you are fully invested by the time everybody is rushing to buy. That is, you should be all-in now. It is not too late.
Thank you for reading and for your continued support, it is truly appreciated.
Namaste.
PEPEUSDT – Back Into the Trap Box | Fib Support BelowPEPE is retesting the same high-volume resistance that sparked a selloff in May.
With price pressing into the top box again, this becomes a key decision point.
A breakout sends us higher — but rejection could send price back toward the golden pocket between 0.00001104 and 0.00000979.
Watch the reaction closely.
This is where the next major move begins.
#PEPEUSDT #MemeCoin #SupportResistance #FibRetracement #QuantTradingPro #TradingView
