PEPEUST trade ideas

PEPE/USDT Update 🚀
🎯 +12% Profit Achieved!
CRYPTOCAP:PEPE has successfully bounced from the Fibonacci zone ($0.00001515), confirming it as a strong support level.
Price has moved upward by +12%, reaching the first stage of its bullish recovery.
Next Targets 📈
🎯 Target 1: $0.00002511
🎯 Target 2: $0.00002942
🎯 Target 3: $0.00003340

Pepe Coins: Predicting More Gain in Crypto’s Next WaveHello and greetings to all the crypto enthusiasts, ✌
In several of my previous analyses, I have accurately identified and hit all of the gain targets. In this analysis, I aim to provide you with a comprehensive overview of the future price potential for PEPE , 📚💡
This coin has become a top contender in the market, backed by a large, active community. Despite strong support and the overall bullish trend, it hasn't yet seen the same significant price increase as its competitors, which is unusual. 📚✨
The coin benefits from strong media attention, high trading volume, and a solid technical chart, all pointing to strong growth potential. These factors suggest a potential price increase of at least 54%. Considering the current market conditions, it presents a highly attractive investment opportunity. 📚🎇
🧨 Our team's main opinion is: 🧨
Backed by a strong community, high trading volume, and solid technical, this coin shows potential for a 54% price increase, making it a compelling investment.
Give me some energy !!
✨We invest countless hours researching opportunities and crafting valuable ideas. Your support means the world to us! If you have any questions, feel free to drop them in the comment box.
Cheers, Mad Whale. 🐋

PEPE hourly update#PEPE in hourly time frame has a nice pattern for a drop as i noticed there is a obvious demand hit in past of the market but i think its not strong enough to make the market rise and also there is a bearish pattern which shows us that there can be another bearish spike before the main rise !

PEPE DUMP !#PEPE has a neg pattern as you can see in lower time frame pepe hit a supply zone if the market pass it so nothing can stop pepe but i dont think so ! this supply can dump pepe like other coins in the market !

Shake & Bake PEPE broke out of a 6-7 month symmetrical triangle base and is currently working on a ~6 week base, which appears to be a minor rest before the bigger continuation move.
Within this current base, price undercut the recent lows and reclaimed the range. Elon Musk just changed his X profile picture to Pepe, which triggered an upside breakout of the daily range. Looks like one of the best charts in crypto atm.
For reference, DOGE hit an ATH market cap of LSE:89BN which is about a 10x from here

PEPE Looks bullish (1H)PEPE appears to be completing an ABC pattern, where wave B has formed a triangle.
We are looking for buy/long positions around the green zone.
Closing a daily candle below the invalidation level will invalidate this analysis.
For risk management, please don't forget stop loss and capital management
Comment if you have any questions
Thank You

PEPE/USDT: Rising Wedge Targeting $0.000002483PEPE/USDT on the 30-minute chart is forming a rising wedge, with the price currently at $0.000002025. This short-term bullish structure could lead to a breakout if the price pushes above the $0.000002185 resistance level, targeting the next levels at $0.000002483 and $0.000002489.
The MACD is showing bullish momentum, with the histogram gaining strength, indicating that buyers are in control. However, the Stochastic RSI is overbought, which may signal a potential pullback or consolidation before another leg higher.
If the price fails to maintain the wedge and breaks below $0.000001917, it could retest lower support levels at $0.000001889 or even $0.000001705. For now, the trend remains bullish, but it’s essential to watch for confirmation of a breakout or signs of exhaustion.

flag$COINEX:PEPEUSDTThe price of this currency is clear, and its path can be entered after confirmation.

PEPE has broken out of its sideways channel PEPEUSDT has broken out of its sideways channel on the 1-hour chart with a strong volume candle, surpassing last week's high.
My first target is the identified area of interest. If you're not already in the trade, consider waiting for a pullback to the previous week's high before entering.
Always ensure you set a stop loss when entering a trade to manage your risk effectively.
REMARKS: DYOR
• This advice is NOT financial advice.
• We do not provide personal investment advice and we are not a qualified licensed investment advisor.
• All information found here, including any ideas, opinions, views, predictions, forecasts, commentaries, suggestions, or stock picks, expressed or implied herein, are for informational, entertainment or educational purposes only and should not be construed as personal investment advice.
• We will not and cannot be held liable for any actions you take as a result of anything you read here.
• We only provide this information to help you make a better decision.
• While the information provided is believed to be accurate, it may include errors or inaccuracies.
Good Luck and have fun,
The CryptoSignalScanner Team

PEPEUSDT %85 Daily Volume SpikeWe previously observed a 25% reaction from the blue box in PEPEUSDT, as mentioned in my earlier analysis. As you can see here:https://www.tradingview.com/chart/PEPEUSDT/VP77qwjf-PEPEUSDT-Flash-Crash-I-m-Ready/
If you utilized low-time frame market breakdowns, you could have caught some excellent risk-to-reward (RR) opportunities. From the latest blue box.
Currently, the price seems to be consolidating, and there is an 85% increase in trading volume today, which is significant. Despite my overall bullish outlook, I believe the price may seek lower levels before continuing its upward trajectory. This potential pullback could provide a new and favorable positioning opportunity.
How to create a position?
When price going down, sometimes CDV goes up, it means an opportunity if general outlook is bullish.
Sometimes we took a retest from volume profile "Point of Control" line and when we reach there we see huge buyers coming in Volume Footprint, it means you can look for an entry.
When trading the blue box, I will rely on indicators like:
Cumulative Delta Volume (CDV)
Liquidity Heatmap
Volume Profile
Volume Footprint
Additionally, I will look for upward market structure breaks in lower time frames for confirmation.
If you'd like to learn how to utilize CDV, liquidity heatmaps, volume profiles, and volume footprints effectively, feel free to visit my profile and contact me.
Best of luck and manage your risk wisely!
If you think this analysis helps you, please don't forget to boost and comment on this. These motivate me to share more insights with you!
I keep my charts clean and simple because I believe clarity leads to better decisions.
My approach is built on years of experience and a solid track record. I don’t claim to know it all, but I’m confident in my ability to spot high-probability setups.
If you would like to learn how to use the heatmap, cumulative volume delta and volume footprint techniques that I use below to determine very accurate demand regions, you can send me a private message. I help anyone who wants it completely free of charge.
My Previous Analysis (the list is long but I think it's kinda good : )
🎯 ZENUSDT.P: Patience & Profitability | %230 Reaction from the Sniper Entry
🐶 DOGEUSDT.P: Next Move
🎨 RENDERUSDT.P: Opportunity of the Month
💎 ETHUSDT.P: Where to Retrace
🟢 BNBUSDT.P: Potential Surge
📊 BTC Dominance: Reaction Zone
🌊 WAVESUSDT.P: Demand Zone Potential
🟣 UNIUSDT.P: Long-Term Trade
🔵 XRPUSDT.P: Entry Zones
🔗 LINKUSDT.P: Follow The River
📈 BTCUSDT.P: Two Key Demand Zones
🟩 POLUSDT: Bullish Momentum
🌟 PENDLEUSDT.P: Where Opportunity Meets Precision
🔥 BTCUSDT.P: Liquidation of Highly Leveraged Longs
🌊 SOLUSDT.P: SOL's Dip - Your Opportunity
🐸 1000PEPEUSDT.P: Prime Bounce Zone Unlocked
🚀 ETHUSDT.P: Set to Explode - Don't Miss This Game Changer
🤖 IQUSDT: Smart Plan
⚡️ PONDUSDT: A Trade Not Taken Is Better Than a Losing One
💼 STMXUSDT: 2 Buying Areas
🐢 TURBOUSDT: Buy Zones and Buyer Presence
🌍 ICPUSDT.P: Massive Upside Potential | Check the Trade Update For Seeing Results
🟠 IDEXUSDT: Spot Buy Area | %26 Profit if You Trade with MSB
📌 USUALUSDT: Buyers Are Active + %70 Profit in Total
🌟 FORTHUSDT: Sniper Entry +%26 Reaction
🐳 QKCUSDT: Sniper Entry +%57 Reaction
📊 BTC.D: Retest of Key Area Highly Likely
I stopped adding to the list because it's kinda tiring to add 5-10 charts in every move but you can check my profile and see that it goes on..


PEPE NEW ATHAs price dropped to an important S/R zone. I think we can see a rally lead to a new ATH. TP mentioned in the chart

Pepe big picture Gartley I am concious but unsure of this happening now. Timing wise. Mini Gartley posted earlier bullish but to put on your radar theres a bigger picture. Nee more data to confirm. Unbias until receive more data. Now is the time based on Fib Based time for a dump. Unsure so play it safe until then.


Pepe Gartley Harmonic BullishHey guys, have to call this one in real time. Gartley Harmonic classic. Short time frame . classic. Lets see how it plays out

PEPE/USDT Analysis$PEPE/USDT Analysis
Fibonacci Retest and Bullish Setup
#PEPE is consolidating within the 0.618 Fibonacci Zone, around 0.00001515, which is a critical accumulation area.
The chart shows a rounding bottom formation, suggesting a potential bullish reversal
Projected Breakout Targets 📈
🎯 Target 1: 0.00002511
🎯 Target 2: 0.00002942
🎯 Target 3: 0.00003340


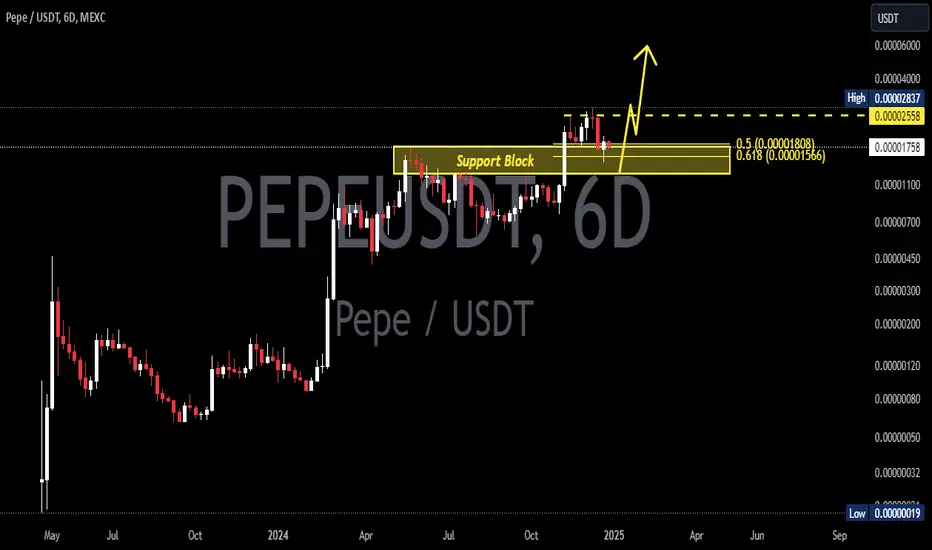
PEPEUSDT 6DPEPE Update ~ 6D
#PEPE So far it still maintains its bullish structure. Buy gradually within this support block,. it's only a matter of time these Memes will make new highs.
Pepe 1H chart1 inch is fib 0.5 zone, diversion on the stoch, let hope it work out.
After bleeding the market these days.
Sunny regards
