#pepeusdt 4hThere is a possibility of forming a zigzag pattern in this currency, according to which we will have a growth and then an accelerated correction
PEPEUST trade ideas

MY PEPE USDT BUY SELL ALERTS EXPERIMENTFolks, I have been toying with this idea for the past week. I use it to send alerts to a secondary dedicated GMAIL address, I then use Python to connect to the account using an APP password. It fetches alerts, and then submits buy sell orders using Binance API. Sharing it as keen to hear your feedback and welcome enhancement ideas. I hope you find it useful :)
Configuration Inputs
Entry and Exit Pivot Lengths: Defines the number of bars used to calculate low pivots for buy signals and high pivots for sell signals. The flexibility in defining different lengths for entry and exit allows the strategy to adapt to varying market conditions.
Volatility Factor: Modulates the atr (average true range) to scale the offset for labels, enhancing visual clarity based on market volatility.
RSI Confirmation for Buy: Incorporates an RSI filter to confirm buy signals, aiming to avoid potential false entries during oversold market conditions.
Trend EMA Length: Establishes a long-term exponential moving average (EMA) to identify the overall market trend, filtering trades to occur only in favorable conditions (uptrend).
Logic and Conditions
Pivot Calculation: Uses pivot points to determine potential entry and exit positions. Entry pivots are based on lows (for buying opportunities) and exit pivots on highs (for selling opportunities).
Uptrend Confirmation: Trades are only executed when the price is above the defined EMA, ensuring that trades are aligned with the primary market trend.
Signal Conditions:
Buy Signal: A buy signal is triggered when the price crosses above an identified entry pivot, the market is in an uptrend, and optionally if the RSI is below a defined oversold threshold, ensuring the entry is at a potentially undervalued point.
Sell Signal: A sell signal is triggered either when the price crosses above an exit pivot or falls below the EMA trend line, indicating a potential peak or a weakening trend.
Visualization and Alerts
Plot Lines and Labels: Plots the entry and exit pivot lines and the EMA trend line with distinct colors for clarity. Labels are dynamically placed to indicate buy and sell points with details on entry price and profit percentage.
Alerts: Configured to send notifications for buy and sell triggers, providing timely trade information.
This strategy provides a robust framework for traders looking for systematic entry and exit points based on technical indicators, adjusted for volatility and trend, with additional confirmation from the RSI to enhance trade accuracy and effectiveness.

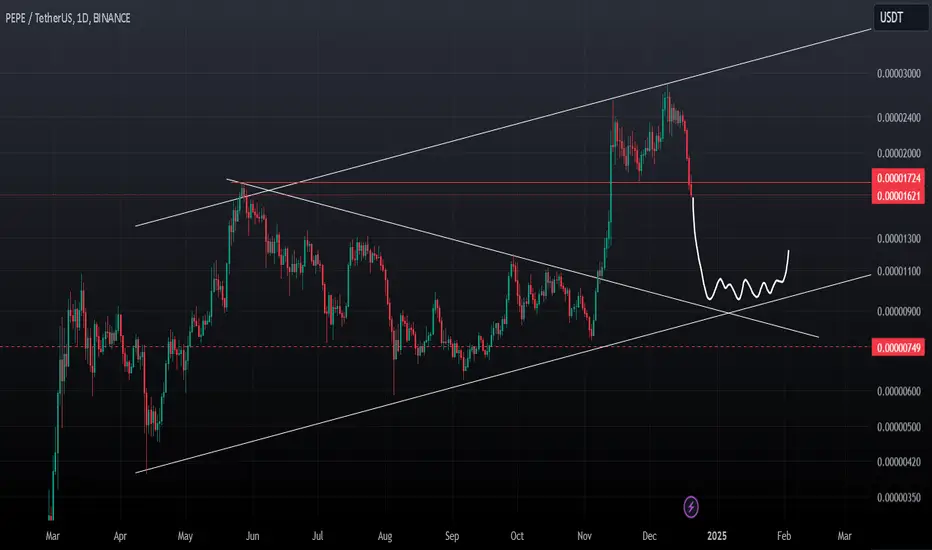
Lingrid | PEPEUSDT buying PULLBACK in the BULLISH trendThe price perfectly fulfilled my previous idea. It reached the target. BINANCE:PEPEUSDT made a deep pullback following the double top at the resistance zone. The price broke the support level, creating a long tail bar that indicates a liquidity grab. Currently, the price is retesting the consolidation zone that lasted for more than four months. This scenario suggests a breakout-pullback-retest situation. If the price holds above this consolidation zone, I expect the market to gradually push higher, likely starting next year. Patience will be key as we watch price action for confirmation. My goal is resistance zone around 0.00002340
Traders, if you liked this idea or if you have your own opinion about it, write in the comments. I will be glad 👩💻

Whether it can be supported and rise from BW(0) is the key
Hello, traders.
If you "Follow", you can always get new information quickly.
Please also click "Boost".
Have a nice day today.
-------------------------------------
(PEPEUSDT 1W chart)
The key is whether it can rise above the HA-High indicator point of 0.00001898.
To do so, the point to watch is whether it can be supported and rise near the M-Signal indicator on the 1W chart.
Accordingly, if it falls, you should check whether it can be supported near 0.00001463.
The strong support area is around 0.00000723.
-
(1D chart)
Since the BW(0) indicator was created at the 0.00001767 point, it is important whether it can be supported and rise around this area.
If it falls, it is important whether it can touch the M-Signal indicator on the 1W chart and rise.
In order to turn into a short-term uptrend, the MS-Signal (M-Signal on the 1D chart) indicator must rise above and maintain the price.
To do so, it must rise above 0.00001898 and be supported.
-
From this perspective, if it rises, the area around the M-Signal indicator on the 1D chart is likely to be the first resistance area, and the area around the M-Signal indicator on the 1W chart is likely to be the first support area.
------------------------------------------------
(1000PEPEUSDT.P 1D chart)
-
Thank you for reading to the end.
I hope you have a successful trade.
--------------------------------------------------
- Big picture
I used TradingView's INDEX chart to check the entire range of BTC.
(BTCUSD 12M chart)
Looking at the big picture, it seems to have been following a pattern since 2015 and has been rising.
In other words, it is a pattern that maintains a 3-year uptrend and faces a 1-year downtrend.
Accordingly, the uptrend is expected to continue until 2025.
-
(LOG chart)
Looking at the LOG chart, you can see that the uptrend is decreasing.
Accordingly, the 46K-48K range is expected to be a very important support and resistance range from a long-term perspective.
Therefore, it is expected that prices below 44K-48K will not be seen in the future.
-
The Fibonacci ratio on the left is the Fibonacci ratio of the uptrend that started in 2015.
In other words, it is the Fibonacci ratio of the first wave of the uptrend.
The Fibonacci ratio on the right is the Fibonacci ratio of the uptrend that started in 2019.
Therefore, it is expected that this Fibonacci ratio will be used until 2026.
-
No matter what anyone says, the chart has already been created and is already moving.
It is up to you how to view and respond to this.
If the ATH is renewed, there are no support and resistance points, so the Fibonacci ratio can be appropriately utilized.
However, although the Fibonacci ratio is useful for chart analysis, it is ambiguous to use it as support and resistance.
The reason is that the user must directly select the important selection points required to generate Fibonacci.
Therefore, since it is expressed differently depending on how the user specifies the selection points, it can be useful for chart analysis, but it can be seen as ambiguous to use it for trading strategies.
1st: 44234.54
2nd: 61383.23
3rd: 89126.41
101875.70-106275.10 (when overshooting)
4th: 134018.28
151166.97-157451.83 (when overshooting)
5th: 178910.15
-----------------

PEPE Analysis - What Shall we Expect !!!After breaking the ascending triangle, the price experienced significant growth. As you can see, the price has now dropped to the 0.618 Fibonacci line. Market volume indicates that the price may not be able to break above the 0.618 line, which means the price could drop to the 0.382 line before rising again.
Previous analysis
Give me some energy !!
✨We spend hours finding potential opportunities and writing useful ideas, we would be happy if you support us.
Best regards CobraVanguard.💚
_ _ _ _ __ _ _ _ _ _ _ _ _ _ _ _ _ _ _ _ _ _ _ _ _ _ _ _ _ _ _ _
✅Thank you, and for more ideas, hit ❤️Like❤️ and 🌟Follow🌟!
⚠️Things can change...
The markets are always changing and even with all these signals, the market changes tend to be strong and fast!!

pepeusdt 1hI expect the price to turn from the timeline and continue along the path that has been drawn.

PEPE/USDT Chart Analysis $PEPE/USDT Technical Analysis
#PEPE The price is undergoing a healthy correction within an ascending channel, stabilizing near the key support at 0.00001515 USDT. Holding above this zone could push the price towards 0.00002511 USDT and 0.00003340 USDT. Breaking below the support may lead to further correction to 0.00001290 USDT.

$PEPE/USDT Analysis📊 $PEPE/USDT Analysis 📊
CRYPTOCAP:PEPE is holding the Daily FVG so far!
If this level gets invalidated, expect further downside. The local resistance level is PMH $0.000025914.

PEPE - Hold box to go higherPEPE - Hold orange box to go higher. Which I think will happen if BTC behaves

Pepe/UsdtBINANCE:PEPEUSDT
### **Pepe Current Price: $0.00001630 💰 (Support Level)**
The current price of **Pepe (PEPE)** is at **$0.00001630**, which is a **key support level**. A **support level** is a price point where the coin is expected to find buying interest, preventing the price from dropping further. In simple terms, if the price stays above this level, it shows that buyers are willing to step in and prevent a decline.
If the price manages to hold **$0.00001630**, it suggests that there could be **potential for upward movement**, as long as it doesn't break below this level.
---
### **Resistance Levels and Trendline:**
- **Resistance at $0.00001764 🚀**:
The **first resistance level** is at **$0.00001764**. Resistance is the price level at which the coin may face selling pressure, as more traders might decide to sell, preventing the price from rising further. If the price reaches this point, it could face difficulty breaking above it, and it may consolidate or even drop back down.
- **Trendline Resistance Levels:**
- **$0.00001900 🔝**:
This is the first **trendline resistance**. If **Pepe** breaks through the previous resistance at **$0.00001764**, it might head towards the **$0.00001900** level. Trendlines act as visual indicators of where the price might struggle due to past price actions. If the price crosses this level, it might signal stronger bullish momentum.
- **$0.00002142 ✨**:
The next **trendline resistance** is at **$0.00002142**. If the price breaks through $0.00001900, the next barrier will be around this level. Here, the price might again face more selling pressure, and it could be a tough level to break if there is not enough buying interest.
- **$0.00002353 💥**:
The **final resistance** level is **$0.00002353**, which is the highest point in your analysis. If the price manages to surpass **$0.00002142**, it could then aim for this level. If it breaks this point, it may signal a major upward movement, as this could be the last major resistance preventing further gains.
---
**Note**: This is **not financial advice**. Always conduct your own research before making any trading decisions. 📊

PEPE Break Support LinePepe break support line
With massive movement before i expect it will non stop correction to this memecoin
PEPEUSDT: Technical Insights and Trading Strategy
Market Overview
- PEPEUSDT is currently in a corrective phase after a sharp decline, with price approaching a key demand zone around 0.00001578 USDT.
- The analysis suggests potential accumulation and a bullish recovery if the support holds.
---
Technical Analysis
1. Support and Resistance Levels:
- Support Zone:
- 0.00001578: Key accumulation level identified for potential entries.
- Below this level, price may test the next support near 0.00001450.
- Resistance Levels:
- 0.00001900: Initial resistance for price recovery.
- 0.00002514: Target resistance zone aligned with the bullish breakout projection.
2. Fibonacci Retracement:
- The price has retraced deeply, approaching the 78.6% Fibonacci retracement level, a common area for reversals in crypto markets.
3. Trendline Analysis:
- A potential reversal pattern is visible as price consolidates near the demand zone.
- A breakout above 0.00001900 confirms a short-term trend reversal.
---
Momentum and Indicators
1. RSI (14):
- RSI is approaching oversold conditions, signaling potential bullish divergence.
- A rise above 40-50 would confirm increasing bullish momentum.
2. Volume Analysis:
- Decreasing sell volume near support suggests diminishing bearish pressure.
- A spike in buy volume at this level would reinforce the reversal signal.
---
Trading Plan
1. Entry Points:
- Accumulate positions near 0.00001578.
- Add more positions on breakout confirmation above 0.00001900.
2. Stop-Loss:
- Place stop-loss below 0.00001500 to manage downside risk.
3. Profit Targets:
- Primary Target: 0.00002514 (aligned with the chart projection).
- Stretch Target: 0.00002800, if bullish momentum persists.
4. Risk Management:
- Risk no more than 2% of total capital on this trade.
---
Scenarios
1. Bullish Scenario:
- Price holds the 0.00001578 level and breaks above 0.00001900 with rising volume.
- Targets 0.00002514, with possible extension to 0.00002800.
2. Bearish Scenario:
- Failure to hold the 0.00001578 support may lead to further downside, targeting 0.00001450 or lower.
---
Pro Summary
PEPEUSDT is showing signs of accumulation at a critical support level. A breakout above 0.00001900 will confirm a reversal toward 0.00002514 and higher. Traders should exercise caution and set strict stop-loss levels to minimize risks.
---
Disclaimer: This analysis is for informational purposes only and does not constitute financial advice. Trading cryptocurrencies carries significant risk, and you should conduct your own research or consult a financial advisor before making investment decisions.

PEPE/USDT 4-Hour Chart Analysis. PEPE is trading at 0.00001862, in a downtrend, moving away from the key Ichimoku Cloud resistance area.
Significant bearish momentum after breaking below 0.00002285 (key support turned resistance).
Immediate support at 0.00001732–0.00001700 (highlighted green area).
Strong demand area below at 0.00001641 (key level to watch for risk of further declines).
Nearest resistance: 0.00002285.
Key breakout levels for potential recovery: 0.00002360 and 0.00002690.
Stop loss: Located slightly below 0.00001641, protection against further declines.
Take profit zone: Above 0.00002831, targeting a significant correction towards the previous highs.
If PEPE sustains the 0.00001732–0.00001700 zone, expect a rebound towards:
Short-term target: 0.00002285.
Mid-term target: 0.00002690.
A breakdown below 0.00001641 could lead to further declines, testing lower unknown levels.
Maintaining caution below the Ichimoku Cloud zone is a must for longs.
Disclaimer: This analysis is for informational purposes only and does not constitute financial advice. Always conduct your own research and consult a financial advisor before making investment decisions.
For updates on other coins or personalized insights, feel free to reach out via DM.
@Peter_CSAdmin

Pepe drops 8%, further weakness expected: analysisPEPE’s price has dropped nearly 8% in the past 24 hours, days after reaching its all-time high on December 9. Momentum indicators, including the RSI at 33.3, show that PEPE is nearing oversold territory but has not yet hit the critical threshold of 30, leaving room for further correction.
Additionally, the 7D MVRV Ratio at -9.3% points to significant short-term holder losses, with historical data indicating a potential downside toward -12% to -15% before a rebound. Whether PEPE holds its key support at $0.0000188 or breaks lower will likely define its next major price movement.
PEPE RSI is currently at 25.87, reflecting a sharp decline since December 16. This indicates that the meme coin is approaching oversold territory, as its RSI nears the critical threshold of 30.
On the chart, the support at $0.0000188 is a critical level for PEPE price, as a breakdown below it could lead to further declines. If this support fails, PEPE may test $0.000017, with the potential to drop as low as $0.000011, representing a 47% correction from current levels.
This bearish outlook is reinforced by its EMA lines, which have formed a death cross as short-term EMAs cross below long-term EMAs, signaling continued downside momentum.
On the other hand, if PEPE price can regain positive momentum, it could challenge the resistance at $0.0000227.
A breakout above this level could open the door to further gains, with targets at $0.0000259 and potentially $0.000028 if the uptrend strengthens.

$PEPE update after this huge pump!We love CRYPTOCAP:PEPE —one of the coolest meme coins out there.
This pump was massive and unexpected. However, all indicators are now overheated. While forecasting a meme coin is always tricky (they can be influenced by exchanges or whales playing with the price), the chart is giving us signals.
I expect a correction as those who drove the pump may start selling to free up liquidity for other coins.
If indicators follow through, we’re looking at a correction down to 0.00001000-0.00001400 within the green box, making it a good entry point to capture the second part of altseason in Q1 2025.
With strong support at 0.00001000, it’s unlikely that CRYPTOCAP:PEPE will drop lower this cycle.
**DYOR**

PEPE - Important LinesQuickly wanted to provide the important trendlines for PEPE.
After the breakout to the upside we saw one successful retest that was outlined in this post:
Also focus on our green trendline. It acted as a level of support for most of the uptrend, the price had a breakdown, retested it twice as new resistance, and we have seen price fall ever since.
Now with this recent drawdown we are looking for a second successful test of the white trendline. If we cannot hold it as support price could drop all the way to our purple line again that represents our previous ATH.

Pepe’s Path to ATH: Big Gains AheadHello and greetings to all the crypto enthusiasts, ✌
In several of my previous analyses, I have accurately identified and hit all of the gain targets. In this analysis, I aim to provide you with a comprehensive overview of the future price potential for PEPE , 📚💡
This coin has emerged as one of the most promising opportunities in the market, supported by a large and highly engaged community. Despite its strong backing and the overall bullish market trend, it has yet to experience the substantial price surge seen by many of its competitors, which stands out as a significant anomaly. 📚✨
Beyond media influence, which certainly contributes to its growing visibility, the coin benefits from high trading volume and a solid technical chart, both of which indicate a strong upward potential. These factors collectively suggest a clear path for a potential price increase of at least 32%. Given the current market dynamics, this makes the coin an exceptionally compelling investment opportunity. 📚🎇
🧨 Our team's main opinion is: 🧨
This coin stands out with a large, engaged community and strong market support, yet has not experienced the price surge of its competitors. With high trading volume, solid technical indicators, and a potential 32% price increase, it presents a compelling investment opportunity.
Give me some energy !!
✨We invest countless hours researching opportunities and crafting valuable ideas. Your support means the world to us! If you have any questions, feel free to drop them in the comment box.
Cheers, Mad Whale. 🐋

PEPE 4H. Awaiting Trend Confirmation: Why Patience Pays OffThe asset price has not dropped below a key support level.
If the current candle closes above the support level with increased volume, this would confirm the strength of the trend.
If this condition with volume and support holds true, it could push the price upwards toward the next resistance level, where growth might face challenges again.
I am considering entering the trade only after confirming that the trend is likely to continue.
DYOR.

Pepe/UsdtOKX:PEPEUSDT
🚨 ** CRYPTOCAP:PEPE Price Update**: **0.000022901$** 📉
Will the price hold at this level? 🤔
### **Current Scenario:**
- **Price holding at 0.000022901$**:
- **Bullish Scenario** 🚀: If the price **holds above 0.000022901$**, we could see the price move toward the **resistance level at 0.000028734$**. This would signal a potential **upward trend**. 📈
- **Bearish Scenario** 🐻: If the price **doesn’t hold**, we could see it drop to lower support levels, indicating a **possible downtrend**. ⬇️
---
### **Key Levels to Watch:**
🔑 **Resistance** (Upside Targets):
- **0.000028734$**: The first major resistance. If the price breaks above this, it could continue higher! 📊
📉 **Support** (Downside Risks):
- **0.000022091$**: First support level if the price starts falling. ⚠️
- **0.000017534$**: A deeper support level to watch in case the price continues to drop. ⬇️
- **0.000012005$**: A critical low point for further downside risk. 🛑
---
### **What You Should Watch For:**
1. **If the price holds at 0.000022901$**, watch for the **breakout** towards **0.000028734$** (resistance). 📈
2. **If the price breaks below 0.000022091$**, it might head toward the **next support levels** (0.000017534$ and 0.000012005$). ⚠️
---
### **Strategy (Long):**
If you're considering a **long position** (buying), you want the price to **hold above** 0.000022901$ and aim for **0.000028734$** (resistance). 📈 Keep an eye on support levels in case of any pullbacks. 🧐
### **Important Reminder:**
This is **not financial advice**! Always do your own research (DYOR) before making any decisions. ⚖️
---
Good luck with your trades! 💡🚀

Pepe/UsdtOKX:PEPEUSDT
🚨 ** CRYPTOCAP:PEPE - Neutral Zone Daily Update** ⏳
Is a **price explosion** 🚀 coming soon? Here's what you need to watch:
🔑 **Key Support**:
- The important support level to watch is **0.0002280$**. If this holds, we could see bullish momentum starting up! 📈
⚠️ **Caution with Fake Moves**:
- There are **major resistances** ahead! Be careful of fake upward moves that might trap buyers. 🛑
- **Reduce your targets** for safety! ⚖️
---
📉 **Main Resistances Above**:
- **0.0002450$**: First resistance level ⬆️
- **0.0002510$**: Next resistance zone ⬆️
- **0.0002630$**: Strongest resistance level 🔥
---
**Important Tip**:
- Keep an eye on the support at **0.0002280$**! If it holds, we could see a move upwards, but remember to be cautious around the resistance levels. 👀
⚖️ **Be strategic and watch for confirmation!** 🧐
---
Disclaimer:It's not Financial Advice

PEPE / USDT : rebounding from support, prepping for breakout PEPE/USDT: Rebounding Strongly from Trendline Support, Prepping for a Breakout
PEPE/USDT is showing signs of strength 📈 as it rebounds from a critical trendline support zone 📊. The pair is forming a bullish setup, indicating a potential breakout 💥 in the coming days. If this breakout materializes, we could witness a powerful bullish rally 🚀. Stay vigilant 👀 and wait for confirmation before taking action.
Key Insights:
1. Trendline Support: PEPE/USDT is respecting a long-standing trendline support, providing a solid foundation for a potential upward move. A breakout above resistance could trigger a strong bullish trend.
2. Volume Surge: Monitor trading volume closely—a significant increase during the breakout will confirm buyer strength 🔥.
3. Bullish Signals: Momentum indicators such as RSI and MACD are turning upward ⚡, supporting the likelihood of a bullish breakout.
Steps to Confirm the Breakout:
Wait for a decisive 4H or daily candle closing above the immediate resistance level 📍.
A noticeable spike in volume during the breakout will confirm strong buying activity 📊.
A successful retest of the broken resistance as a new support zone adds credibility to the move ✅.
Watch out for fake breakouts, such as wicks above the resistance or sudden reversals ⚠️.
Risk Management Strategies:
Set stop-loss orders below the trendline support to protect your capital 🔒.
Position sizing should align with your overall trading plan and risk tolerance 🎯.
This analysis is for educational purposes only and not financial advice. Always conduct your own research (DYOR) 🔍 before making investment decisions.

PEPEUSDT Analysis And Next Market MoveName: PEPE MEME coin
Symbol: PEPE
Type: Meme Token
Timeframe: 8H
Analysis: Technical+Fundamentals
Trend : Bullish
Details:-
PEPE is setting at a strong support level. From this support level. Expecting 30% + quick gain. PEPE is a meme coin and people are thinking this is next DOGE coin.
Bullish Target:-
0.000030
0.000040

Hunting for the Next 1000X Cryptocurrency:A Statistical AnalysisThe cryptocurrency world is a gold rush for dreamers chasing life-changing gains. With stories of tokens skyrocketing in value, the appeal is undeniable. But here’s the reality: with over 5,300 new tokens hitting the market daily in 2024, as reported by CoinGecko, your odds of finding the next PEPE, BONK, or SHIBAINU are incredibly slim. Most new cryptocurrencies fail within months, and many are scams designed to drain your wallet. Let’s break down the numbers and the challenges of uncovering a gem amidst the flood.
The Numbers: New Tokens and Their Survival Rate
By April 2024, over 540,000 tokens had already been launched — a staggering number. Yet, very few will ever succeed. Here’s a snapshot of the harsh realities:
Failure Rates: Around 80-90% of new tokens fail in their first year. This is often due to lack of purpose, poor adoption, or outright abandonment.
Rug-Pulls: A worrying number of tokens—about 10-15%, based on data from CertiK—are rug-pulls. This means developers vanish after pocketing investors' money.
Breakout Tokens: The odds of hitting it big are microscopic. In 2023, fewer than 50 tokens out of 830,000 reached 1000X growth, showing just how rare these success stories are.
What Does It Take to Achieve 1000X Growth?
For a token to grow 1000X, its market cap needs to multiply by 1,000. Achieving this requires a combination of:
Early Entry: You must buy in at the lowest prices, often during presales or right after launch.
Massive Hype or Demand: Whether through meme-driven excitement or actual utility, the token must capture the market’s attention.
Smart Tokenomics: Low supply or deflationary mechanisms can push prices sky-high.
The Odds of Finding the Next Moonshot
Let’s do some quick math:
Total Tokens Launched in 2024: With 5,300 tokens a day, around 2 million tokens were launched this year.
Success Rate for 1000X Growth: If fewer than 50 tokens reached 1000X in 2023, your chance of finding one is about 0.0026%, or 1 in 38,000.
The jump to 10,000X is even harder, requiring not just perfect timing but incredible luck and sustained demand.
In short, it’s like playing the lottery but with higher stakes and more scams.
The Risks You’re Up Against
Rug-Pulls and Scams
Some tokens are outright traps. Be wary of:
- Anonymous teams with no verifiable background.
- Projects making outrageous promises.
- Lack of liquidity locks or audits.
Market Overload
With millions of tokens flooding the market, standing out is harder than ever.
Speculative Hype
Even promising projects can implode if their growth is built solely on speculation, as seen with many memecoin fads.
How to Improve Your Odds
While the odds are stacked against you, there are ways to tip the scales slightly in your favor:
- Do Your Homework: Look for projects with clear value, experienced teams, and a real use case.
- Follow Trends: Emerging sectors like AI, GameFi, or decentralized sience are hot spots for innovation.
- Track Launch Platforms: Presale platforms and launchpads can be a good source of vetted tokens.
- Diversify: Spread your investments across multiple tokens to lower risk.
- Set Limits: Never invest more than you’re prepared to lose.
Final Thoughts
Chasing the next 1000X token in today’s crowded crypto market is an uphill battle. While success stories like PEPE make headlines, the reality is that most tokens fail, and many investors lose money. The key is to stay realistic, do thorough research, and focus on long-term, informed decisions. The crypto market rewards patience and strategy far more than blind luck. Good hunting!
