What awaits Pepe (PEPE)?The PEPE price experienced a huge bearish heat after remaining elevated for quite a long time in the past few days. Currently, the token is struggling to hold above the ascending resistance after gaining levels above the range. In the coming days, market participants may expect a decent drain in prices as the bulls remain passive at the moment.
Soon after rebounding from the interim lows, the bulls consumed more time than required before triggering a rebound and entering within the range. However, the MACD displays a drop in the selling volume and hence, a drop in the pressure may drag the levels slightly down. The market participants appear to have taken the profit from PEPE but the upcoming ETH ETF is believed to revive a strong ascending trend in a short while from now. This may raise the levels within the ascending triangle and after hitting the edge, it may rise towards new highs.
PEPEUST trade ideas


Meme Coins: What’s Behind the Curtains ?Have you ever wondered how meme coins keep pumping? Are people really getting rich from them?
How the Pumps are Made ?
Step 1: Establishing Credibility
First, the creators spend significant investment capital to demonstrate good credibility. This ensures that the strongest platforms list them. During the Initial Public Offering (IPO), coins are sold massively to investors. However, as their is no more buyers, prices begin to decline.
Step 2: Accumulation Phase
Next, the coin enters an accumulation phase where big whales start buying from bored speculators at the lowest prices. The whales objective during this phase is to accumulate the maximum quantities for the lowest price possible. The long accumulation time will breakdown the enthusiasm of the speculators , selling their coins for a loss or no profits.
Step 3: Controlling Supply and Demand
When accumulation reaches its peak, the whales start withdrawing their coins from the platform, leaving the market with small quantities. They then inject a significant amount of capital, such as $1 million, causing the price to take off.
Step 4: Advertising
Following this, the coin creators and whales invest heavily in advertising , attracting a big community and more investors. This new crowd keeps injecting liquidity into the pumps, leading to noticeable price increases.
Getting Rich Quick?
Can you get rich quick from meme coins? The reality is nuanced. Even if speculators buy at the bottom, their investments are often too low, leading them to sell at modest gains during the pumps. On the other hand, people who buy after a 1000% increase are typically looking for substantial returns. However, their small capital makes even a 5x return seem insufficient.
The meme coin trend is aggressive and driven by a powerful crowd. While investing in these coins can bring profits, it’s essential to remember that you are always at the mercy of the whales. If they decide to sell off, the market can crash just as quickly as it pumped. Therefore, caution and awareness of the market dynamics are crucial when dealing with meme coins.

PEPE Triple 3 Combo CompletionLooks like we are completing a triple 3 combo wave here. I see a triangle or a zigzag. This will stay in range until complete. enjoy!!! :D


PEPE — Bullish EMA Crossover on the Daily Chart & Higher Low ForPEPE has signaled several bullish signs lately, which we will analyze in this post. However, as mentioned in previous posts, I won't enter a long trade until PEPE reaches a crucial level.
Here are all the details 👇
1️⃣ Bullish EMA Crossover: This trade signal flashes when a short-term jumps above a longer-term moving average. This usually signals a trend change and, in this case, the start of an uptrend. Although PEPE's historical data is limited, it shows that the price increased by more than 10% every time the signals flashed.
2️⃣ Higher Low (4H): If PEPE can maintain 0.000012 and reverse at this level, it has formed a higher low and a perfect launchpad to tackle the major resistance at 0.000013.
3️⃣ Bullish MACD Crossover: PEPE flashed a bullish MACD crossover a few days ago on the daily chart. The last time we had a clear crossover, PEPE added more than 120% in the following 30 days.
‼️ Why It Is Not Time To Enter, Yet: Despite the various bullish signals, one crucial aspect tells us to wait with an entry: The resistance at 0.000013. Since the beginning of June, PEPE has been rejected several times due to this resistance. Therefore, a break of this line + confirmation on a higher timeframe + (preferably) retest will be the ultimate entry signal.
PEPE/USDT - Bullish Signs
Show some strong signs:
1- Bounce from 200 ma
2- Break VWAP
3- Bounce from level (red box)
Price Target
1434
1725

Long PEPE
PEPE is retesting the local trendline.
I started to buy PEPE here and increase position when bounce from trendline.
Trade setup is as in chart.
Disclaimer:
This analysis is based on my personnal views and is not a financial advice. Risk is under your control.

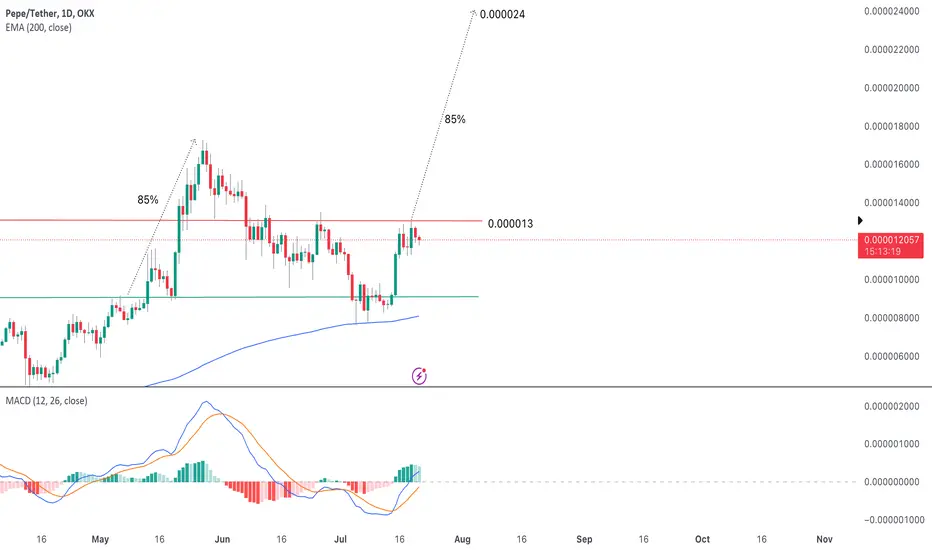
Let's Do It Again, PEPE! All Eyes On 0.000024PEPE recently pumped almost 50% and is consolidating below significant resistance. Moreover, it seems like PEPE replays its performance between March and May — if this continues, 0.000024 would be the consequence.
Here are all the details 👇
1️⃣ Chart Analysis
PEPE's chart shows strong similarities to its performance between March and the end of May. At that time, PEPE corrected after its massive pump, bounced off the EMA200 line, attacked a significant resistance several times, finally broke through, and pumped 100% again.
Afterward, PEPE corrected again until it bounced (again) off the EMA200 level at the beginning of July. Currently, PEPE had its first attempt to break through the significant resistance.
If history repeats, PEPE will enter a consolidation phase right below the resistance and try to break through. Based on the current (bullish) market conditions, this might happen much faster than in April/May.
Once the resistance breaks, PEPE could quickly rally to its previous ATH. However, if PEPE mirrors its earlier performance, the target sits at 0.000024, resulting in another 100% compared to its current level.
2️⃣ Technical Indicators
PEPE's trend indicators continue to signal a strong uptrend. Based on the recent bounce, momentum indicators have flashed overbought signals. Therefore, it is likely that we will see a (short) period of consolidation, as explained above.
3️⃣ Trade Signals
PEPE does not provide any significant and relevant trade signals on higher timeframes, such as the daily or weekly charts. Yesterday, the 4H chart flashed some Power Scalper signals. However, they've already played out. Moreover, the Power Scalper is usually the signal that appears at the end of a trend before a consolidation starts.
--
Check my profile and bio for more analyses and free trade strategies.

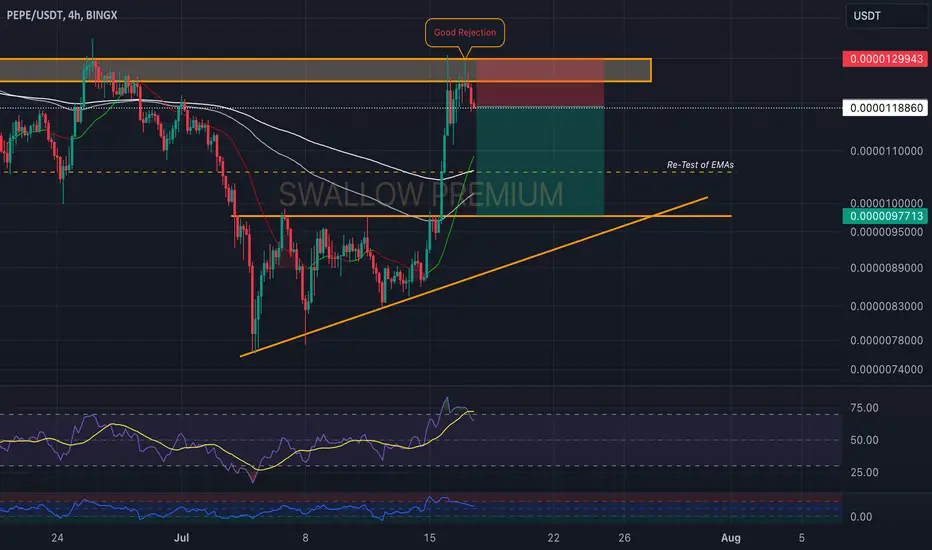
Pepe (PEPE): Possible Drop Incoming!Pepe has made a nice rejection from the resistance zone, where the price has a good chance to re-test both the broken triangle formation and the 200 EMA.
RSI is on the bear side as we are in overbought markets right now so eyes are on possible downward movement here!
Swallow Team
PEPE Price Analysis: Key Support and Resistance Levels RevealedAs of the latest analysis, BINANCE:PEPEUSDT exhibits notable activity on the 4-hour chart, demonstrating potential opportunities for traders. Closing prices have seen minor fluctuations, indicating a stable yet cautious market sentiment.
The 9 Exponential Moving Average (EMA) shows a consistent upward trajectory, closing at approximately $0.00001192, suggesting short-term bullish momentum. This is further supported by the 20 EMA, which has also been on the rise, currently around $0.00001146. The convergence of these EMAs implies a potential continuation of the upward trend if the price remains above these averages.
Moving Average Convergence Divergence (MACD) values highlight a slight bearish divergence. The MACD line has been declining relative to the signal line, resulting in a series of negative histogram values. This indicates weakening bullish momentum, suggesting caution for traders considering long positions. However, the MACD values are still relatively close to the signal line, leaving room for potential bullish reversals if the market sentiment shifts.
Meanwhile, the Relative Strength Index (RSI) has fluctuated between 60.93 and 65.31, reflecting a moderately bullish outlook without reaching overbought territory. The RSI suggests that while there is buying interest, it is not overwhelming, which may point to a period of consolidation or a mild correction before any significant price movements.
Key support levels are identified at $0.00001167, $0.00001162, and $0.00001159. If the PEPE price experiences downward pressure, these levels could serve as potential entry points for long positions, anticipating a bounce back. On the upside, resistance levels are marked at $0.00001214, $0.00001231, and $0.00001245. A breakout above $0.00001214 could signal further upward movement, making it a potential entry point for long trades.
For traders considering long positions, entering around the support levels with a stop-loss just below $0.00001159 could be a prudent strategy. Targeting the resistance levels, particularly $0.00001214 and beyond, might offer favorable risk-reward ratios. Conversely, those looking to short could do so near resistance levels, with a stop-loss slightly above $0.00001245, aiming for profits near the identified support levels.
In conclusion, PEPE displays a cautiously optimistic outlook with potential for both upward and downward movements. Traders should closely monitor the support and resistance levels, as well as the evolving EMA and MACD signals, to make informed decisions.
Disclaimer: The information presented in this article is for informational and educational purposes only. The article does not constitute financial advice or advice of any kind. Ecoinimist is not responsible for any losses incurred as a result of the utilization of content, products, or services mentioned. Readers are advised to exercise caution before taking any action related to the company.

PEPE → A condition that will lead to growth. Is the buyer back?BINANCE:PEPEUSDT is undergoing a deep correction phase. The price is resting on the strong support and the "discount" zone appears the buyer, holding the market. The focus on the upper boundary of the range...
! For convenience, I will indicate key zones without zeros.
Bulls do not let the price below 0.0761, forming a limit support area, in the neighborhood of which a strong buyer appears, it can be determined by the growth of volumes and the pattern of redemption with the subsequent retest without updating the minimum.
At the moment it is not excluded that the coin can continue falling, but based on the general situation there is a chance that PEPE can move into the recovery phase, but provided that the coin can pass the area of 0.0951-0.0991 with the price fixing above this zone, which will generally define an intermediate bottom for the market.
Resistance levels: 0.0952, 0.0991, 0.1084
Support levels: 0.0886, 0.0761
Technically, the situation is complicated because of bitcoin, which is consolidating in the discount zone, but in general there are bullish prerequisites. If the guide (BTC) goes up, it may favor altcoins.
Rate, share your opinion and questions, let's discuss what's going on with PEPE / USDT ;)
Regards R. Linda!

Pepe support at 77t breaker + 618 + ndPOCWe could see a bounce from the bullish breaker below.
Lots of confluence
77t breaker + 618 + ndPOC
Lets see what happens.
Push Play
Not Ever Financial Advice.

PEPE wait break S/R📊 PEPEUSDT Chart Analysis
Key Points:
Strong Resistance 💪:
A strong resistance is observed at the 0.00000991 - 0.00001032 zone. This level has acted as a barrier multiple times.
Indicated by the blue horizontal line.
Take Profit (TP) Levels 🎯:
TP-1: 0.00000991 🟢
TP-2: 0.00001032 🟢
TP-3: 0.00001082 🟢
TP-4: 0.00001131 🟢
TP-5: 0.00001208 🟢
Technical Analysis 🔍:
Previous Downtrend 📉:
The chart shows a strong downtrend previously, with the price dropping from around 0.00001313 to the low of approximately 0.00000763.
Current Zone 📈:
The current price is around 0.00000924, close to the strong resistance zone.
The red area represents the risk zone, indicating the potential for a price drop if this area is broken downward.
Potential Upside 🚀:
If the price can break the strong resistance around 0.00000991, there's potential for movement towards the subsequent TP levels.
Given the current position and the strong resistance, breaking this zone could signal a good buying opportunity.
Trading Strategy 💹:
Enter Long Position 🛒:
Consider entering a long position if the resistance at 0.00000991 is broken.
The take profit targets (TP) are sequentially TP-1 to TP-5.
Stop Loss 🛑:
Place the stop loss below the red zone (0.00000897) to limit losses in case of a sudden price drop.
Conclusion 📝:
The PEPEUSDT chart indicates a strong resistance zone. Breaking this resistance can lead to a potential price increase towards the specified TP levels. Therefore, entering a long position upon breaking this resistance and setting a stop loss below the red zone can be a sound strategy.

PEPE/USDTTo continue monitoring PEPE/USDT, we need to see a breakout of the resistance level at 0.00001350 USDT with a clear daily close. If the price manages to break this level and close above it, we can expect it to reach the following targets:
- 0.00001570 USDT
- 0.00001723 USDT
- 0.00002003 USDT
- 0.00002324 USDT
If the price successfully surpasses 0.00001350 USDT and closes daily above it, we might see a stronger upward movement towards these mentioned targets. Keep a close watch on this level to confirm the uptrend.

Displaying Current Market Cap Next to Price on TradingView ChartConcept Overview
The proposed feature will display the current market capitalization of an asset directly next to its price on TradingView charts. This real-time integration will allow traders and investors to see both the current trading price and the overall market value of the asset simultaneously. By having this information readily available, users can make more informed trading decisions without needing to switch between different sources or perform manual calculations.
Detailed Feature Description
1. Real-Time Market Capitalization Display
Dynamic Calculation: The market capitalization will be calculated in real-time using the formula:
Market Capitalization = Current Price × Number of Outstanding Shares
Current Price: Utilize the existing real-time price feed that TradingView provides.
Outstanding Shares: This value can be static, retrieved from the company's latest financial disclosures, or updated periodically from trusted financial databases.
2. User Interface Integration
Positioning: Display the market capitalization next to the current price in the chart’s price scale. This could be on the right side, just below or above the current price.
Formatting: Use a clear, concise format, such as:
Price :$123.45
Market Cap:$1.23𝐵
Price:$123.45 Market Cap:$1.23B
Color Coding: Match the market cap text color with the price color for consistency and easy association.
3. Customization Options
Toggle Visibility: Allow users to enable or disable the market cap display through the chart settings.
Update Frequency: Provide options to set the update frequency (e.g., real-time, every minute, hourly) to manage performance.
Font and Size: Include customization for the font size and style to match user preferences.
Technical Implementation
1. Data Integration
Data Source: Integrate with reliable financial data providers to fetch the number of outstanding shares for each asset.
API Access: Use APIs to retrieve the latest data and ensure it’s updated regularly.
2. Pine Script Modification
Extend Pine Script: Enhance Pine Script to support the calculation and display of market capitalization.
For example:
pinescript
//@version=5
indicator("Market Cap Display", overlay=true)
// Define the number of outstanding shares (for example, 1 billion shares)
var float outstandingShares = 1e9
// Fetch the current price of the asset
currentPrice = close
// Calculate the market capitalization
marketCap = currentPrice * outstandingShares
// Convert market cap to a readable format
marketCapStr = str.tostring(marketCap, "#.##a")
// Display the market cap next to the price on the chart
label.new(x=bar_index, y=close, text="Price: $" + str.tostring(currentPrice) + " | Market Cap: $" + marketCapStr, style=label.style_label_down, color=color.white, textcolor=color.black, size=size.small)
3. Performance Optimization
Efficient Calculation: Optimize the script to ensure minimal performance impact, even with frequent updates.
Caching Data: Implement data caching for outstanding shares to reduce API calls and improve performance.
Benefits and Impact
Enhanced Decision-Making: Traders can quickly assess the market value of an asset alongside its price, aiding in more informed decisions.
User Convenience: Eliminates the need for external tools or manual calculations to determine market cap, streamlining the trading process.
Increased Engagement: Providing additional value through real-time financial metrics can enhance user satisfaction and platform engagement.
Implementation Roadmap
Research & Planning: Identify and integrate with reliable data sources for outstanding shares.
Development: Enhance Pine Script capabilities and user interface components to support the new feature.
Testing: Conduct thorough testing to ensure accuracy and performance across various market conditions and asset types.
User Feedback: Roll out the feature to a subset of users for feedback and iterative improvements.
Full Deployment: Implement the feature across the platform with user guides and support.
This feature will empower TradingView users by providing immediate access to market capitalization data directly on the charts, facilitating better trading strategies and market insights.

PEPE/USDT BUY NOW!!!!!!!!!PEPE took out the buyside liquidity with a retest from the discount zone and now price is heading to create a new highs am taking buys from here holding till we run liquidity above the buyside levels
JOIN AND ENJOY
Tell us your take on this.......

$PEPE trollololing from 0.00000920 to 0.0000260-270 price 185%upAfter hitting a low post-correction we are very much still in a bull market with BINANCE:PEPEUSDT after the correction from 0.00001600 happened. Majority selling volume sitting at 0.00002642.
Invest smart, invest hard.
Boost my post if you like this idea 💡
Also follow and subscribe for more uproars. Let's spread the word together.
Roaring Puppy 🐶 out.
BINANCE:PEPEUSDT

PEPE Rockets Upward: Eyeing Explosive Gains!hello guys.
let's analyze PEPE!
- Current Price: The current price of PEPE is $0.00001177, showing a 3.98% increase.
- Support and Resistance:
- Support Level: The price has recently bounced off an internal trendline, acting as a significant support level.
- Resistance Level: The target price is set at $0.00004128, indicating a potential resistance point in the future.
- Trend Analysis:
- Ascending Channel: The chart predicts an ascending channel, suggesting that the price might continue to rise if it stays within this channel.
- Internal Trendline: The price has reacted quickly to the internal trendline, indicating strong buying interest at this level.
- Pattern Formation:
- Double Bottom: The recent bounce could be seen as a double bottom pattern, which is typically a bullish reversal signal.
- Quick Reaction: The quick reaction to the trendline suggests strong momentum and buyer confidence.
- Predicted Movement:
- If the price continues to follow the predicted ascending channel, it is expected to reach the target of $0.00004128.
- The price might face some resistance along the way, particularly around the mid-line of the channel, but overall, the momentum seems bullish.
- Market Sentiment: The increase in price and the strong reaction at support levels indicate a positive market sentiment. Traders seem optimistic about the future price movement of PEPE.
Key Points to Watch:
- Trendline Support: Ensure the price remains above the internal trendline for the bullish trend to continue.
- Mid-channel Resistance: Monitor price action as it approaches the mid-line of the predicted ascending channel for potential resistance.
- Volume: Increasing trading volume would further confirm the bullish trend and provide additional confidence in reaching the target price.
___________________________
✓✓✓ Always do your research.
❒❒❒ If you have any questions, you can write them in the comments below, and I will answer them.
❤︎ ❤︎ ❤︎And please don't forget to support this idea with your likes and comment

Pepe is almost squeezed out, will it break the downward trend?
Pepe is almost squeezed out, will it break the downward trend, it looks like it is now at a crucial point to break through and will then have free space to reach all time highs again

PEPE COIN PRICE ANALYSIS AND NEXT POSSIBLE MOVES !!CRYPTOCAP:PEPE Coin Update !!
• in Last 3 days we see 45% move in PEPE Coin Price !!
• Now incase its price reach 0.00001331-1350$ OR 0.00001386$ then i will look for instant future short trade setup with Tight Stoploss🫡
• Short term spot traders that buy it in a dip few days ago should take profit upto 70% & move SL AT Entry Point.

PEPEUSDT Daily tf Range Updated till 16-07-24PEPEUSDT Daily timeframe range. PA is into a box range. its trying to stay above 0.00001133. a well formed candle can push it till 0.00001416, its not that far. it got some selling pressure but a little bit retail interest can overcome it.
