PEPE RIGHT TIME TO BUY PEPE coin is currently gaining momentum as market sentiment turns bullish across meme coins. With increased community engagement, rising trading volume, and attention from crypto influencers, PEPE appears poised for its next leg up. If current support holds and broader market conditions remain favorable, PEPE could break out from its current consolidation and target the next resistance level, potentially setting a new short-term high.
PEPEUST trade ideas

Impulse or Illusion? Key Level to Watch If you find this information inspiring/helpful, please consider a boost and follow! Any questions or comments, please leave a comment!
Recap
Since the price surge off the March 11 low, structure appears to be developing into a potential 5-wave impulse. However, with only three legs printed so far, it remains premature to confirm the full impulse structure.
Structure Assessment
The move resembles a possible ABC zigzag, but the center leg (possible wave 3) is showing strong impulsive characteristics — momentum, follow-through, and vertical lift. That raises the probability of it being an unfolding wave 3, rather than just a C wave.
What’s missing? A clear wave 4.
Until a fourth wave correction is established, and followed by a decisive wave 5, the bullish impulsive count remains tentative.
Outlook
📌 Key level: 0.00001087
The hold of this level will make the look of the structure ideal.
A break below 0.00001087 would dip into unacceptable territory for a developing wave 4 and opens the door to a bearish reassessment — and if the PA enters the price territory of the wave 1 cause a conclusive invalidation of the potential impulse.
✅ If price holds the level and a shallow wave 4 consolidates, we can then watch for signs of wave 5 to confirm the impulse and unlock bullish continuation potential.
Watch this level. Structure will confirm or collapse soon. More updates to follow.
Trade safe, trade smart, trade clarity.

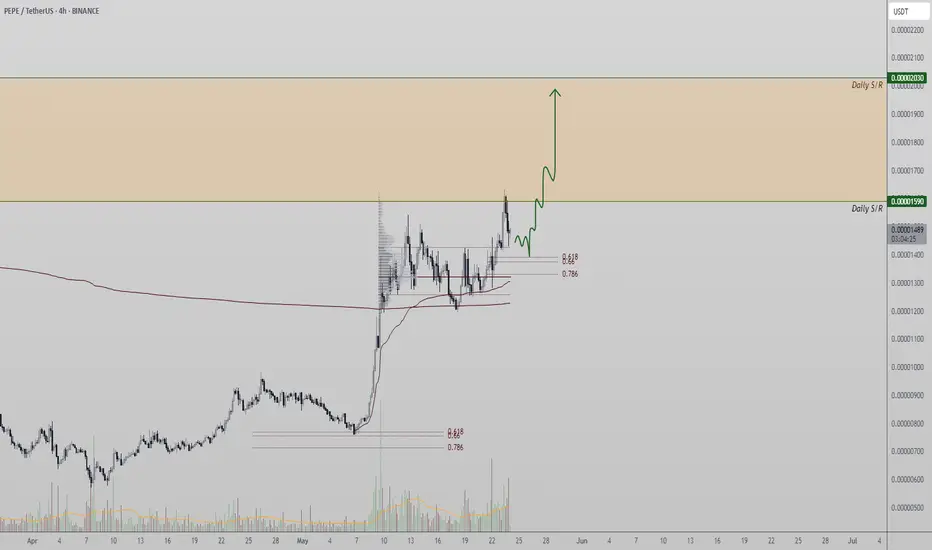
PEPE/USDT – Bullish Pullback Sets Up Next Leg HigherPEPE has recently pulled back from local resistance after establishing a new higher high in its ongoing bullish trend. Rather than being a sign of weakness, this rejection is a typical development in trending markets—where a higher low often follows to build momentum for the next leg up.
Looking at the 4H timeframe, price action is currently hovering around a key support zone near the value area high, which aligns closely with the 0.618 Fibonacci retracement level. This area is acting as a technical confluence and could serve as the next potential higher low if PEPE can hold above it on multiple 4-hour candle closes.
A sustained hold at this level would likely trigger a rotation back toward the recent resistance, increasing the probability of a breakout and further continuation to higher levels. The current correction should be viewed as a bullish retest, presenting a possible “buy the dip” opportunity within a strong market structure.
From a technical perspective, as long as PEPE maintains support at this zone, the bullish trend remains intact. Momentum indicators continue to lean in favor of the bulls, and volume behavior remains consistent with prior accumulation phases before impulsive moves.
In summary, PEPE is showing signs of healthy consolidation within a bullish framework. The recent rejection is more likely a setup for continuation rather than reversal. If the support zone holds, the market could soon be eyeing a fresh breakout and a test of higher resistance levels in the sessions ahead.
PEPE 1D Harmonic Pattern Setting Up for a Bullish Breakout!Hey traders!
I'm spotting a potential bullish setup on #PEPEUSDT — and it’s one worth watching closely.
🔍 Technical Overview:
On the 1D time frame, #PEPE is forming a textbook harmonic pattern — still confirming.
No bearish divergence or reversal signs spotted so far — momentum remains intact.
Key level to watch: B point of the harmonic pattern, acting as strong horizontal resistance.
🎯 Trade Idea:
Plan: Wait for a clean breakout above the B-level, followed by a successful retest.
If the retest holds as support, I’ll be entering a long position with tight risk management.
TP-1: 0.00001292
TP-2: 0.00001647
SL: 0.00000549
⚠️ Why patience matters: Jumping in too early can expose you to fakeouts. Confirmation = confidence!
💬 What do YOU think? Is #PEPE about to explode or will the resistance hold? Drop your thoughts below! 👇
📈 If you find this helpful, don’t forget to: 👍 Like
💬 Comment
🔁 Share
📌 Follow me for more high-probability setups!
Let’s trade smart, not emotional. 💡
#PEPE #CryptoTrading #HarmonicPattern #BreakoutSetup #TechnicalAnalysis #TradingView #CryptoCommunity #Altcoins

Pepe Hits New Daily High, What Now?Pepe just hit a new high today, and the highest price since late January 2025. A full correction recovery is now in place but the action is never flat on this pair. We can see down-waves and up-waves. It alternates.
This new high is good. It is not so strong but still, slow and steady growth which is bullish. Trading volume is still low which at this point we take as a continuation signal, which means that there is plenty of room left available for additional growth.
Imagine this pair keeps rising and rising, still low volume. When huge volume comes in, that's when the strong advance will happen and we see 200-300% in a matter of days. While the rest of the time, months and months of growth, the pair is always growing but slowly. That is why patience is key.
See this, PEPEUSDT has grown by almost 200% since its March/April low, wow. And it will continue growing.
Thanks a lot for your continued support.
You can see the related publications for the full trade-numbers with leverage for this pair.
Thank you for reading.
Namaste.


PEPE Technical Analysis – Daily TimeframePEPE Technical Analysis – Daily Timeframe
PEPE is currently forming two strong bullish technical patterns, both suggesting significant upside potential if a key resistance level is broken with confirmation.
📌 Scenario 1 : Bullish Flag Pattern
If the price breaks and holds above the $0.00001500 resistance on the daily timeframe, the bullish flag pattern may become active.
This pattern projects a potential move toward the $0.00003000 level, which aligns with the previous all-time high (ATH).
📈 Estimated upside: +90% from the current price.
📌 Scenario 2 : Cup Formation
In the broader structure, PEPE appears to be forming a cup pattern.
A confirmed breakout above $0.00001500 could open the door to a new all-time high around the $0.00004000 level.
📈 Estimated upside: +170%, assuming full pattern completion.
✅ In both scenarios, a strong breakout above $0.00001500 with volume is the key condition for bullish continuation.
Until then, short-term volatility or consolidation remains possible.
📌 This analysis is for educational and informational purposes only and does not constitute financial advice.
This cryptocurrency has two key support levels.
As long as the price remains above these supports, there is still hope for a potential reversal and continuation of the uptrend.
The first support is at $0.00001200
The second support is at $0.00001050
📝 Follow me for updates and more crypto analyses.

PEPE AGAIN!!!Hello friends
Considering the good growth we had, you can see that the price has made a correction and entered a range after reaching its ceiling.
Now, with the price correction, there is a good opportunity to buy in a pipeline and with capital management and move with it to the specified goals.
*Trade safely with us*

PEPEUSDT Creating Retracement? or Start to Downall?Based on current Price Action, Pepe looks like collecting momentum to having a significant bearish movement. But the problem is ; is it bullish retracement or starting of bearish trend.

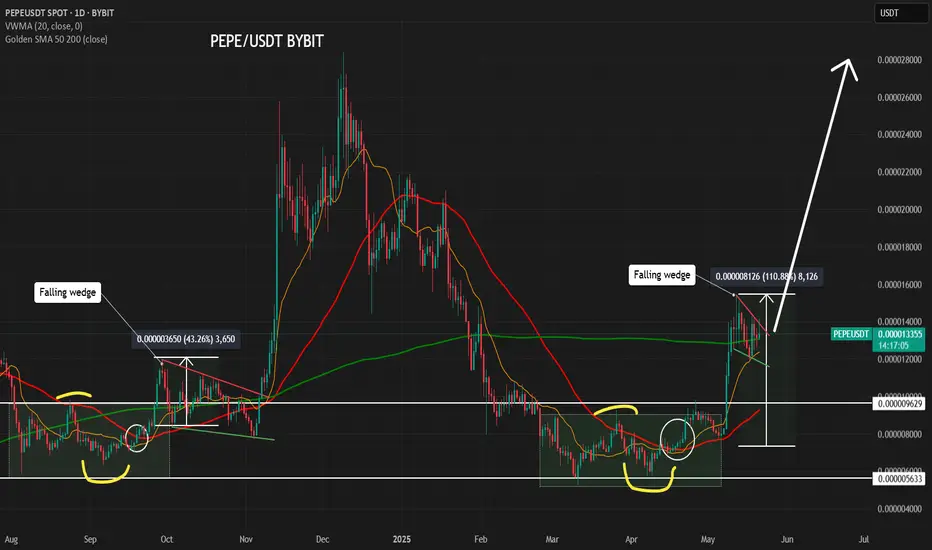
PEPE - PREPARING FOR A BREAKOUT AND NEW ATH??Pepe have performed very similar price action from late february -25 til now, compared to the price action between end of jul to start of october -24.
If history will rhyme - if it doesnt repeat it often rhymes - PEPE is preparing for a breakout to the upside, possible looking for new ATH.
Between 12 - 21th May 2025 we also see a falling wedge, similar to the falling wedge between 29th Sep - 07 Nov 2024 followed by a breakout to the upside and new ATH.
Are you prepared for what is coming?
Im looking for a Leverage Long position when we breakout from the falling wedge. This could be a huge monster trade.
(This is not Financial Advice, DYOR. Just sharing my ideas).
Pepe/Usdt Long % 150 A major breakout in Pepe/USDT is expected to start soon. There is a formation similar to the previous bull run. The bull mode is about to be activated, everyone get ready. We are starting.

PEPE PEPE is currently in the $0.000012-$0.000014 area, trying to break through $0.000015 and head towards $0.000018.
Buy area = $0.0000125-$0.0000138
Stoploss = $0.00001210
Target Profit = $0.000017-$0.000018

High R/R Swing Setup on PEPE – Eyes on 100%+ MoveThe 1D chart for PEPEUSDT is showing a clean bullish structure, supported by repeated rejections from a key support level and a recent breakout above short-term resistance. This setup offers a simple yet potentially high-reward trade opportunity for swing traders.
📊 Trade Setup
Entry: 0.00001269 USDT
Price has confirmed a bullish reversal and is currently hovering above a minor consolidation range, presenting a strong opportunity for a long position.
Stop Loss: 0.00001079 USDT
Placed just below the previous local lows to invalidate the setup in case of a breakdown.
Take Profit 1 (TP1): 0.00002135 USDT
This level represents a previous high and a clear horizontal resistance zone.
Take Profit 2 (TP2): 0.00002844 USDT
A higher resistance level, also aligning with historical price action, offering a potential 103% gain from entry.
📈 Technical Justification
Key Support Holding: Price has shown multiple rejections near the 0.00000565 USDT level, forming a strong support base. Each rejection has resulted in a higher low, indicating increasing bullish momentum.
Trendline Confirmation: The ascending trendline shows sustained bullish pressure and confirms the strength of the ongoing trend.
Breakout Setup: Current price action indicates a breakout from consolidation, supported by volume. The bullish structure remains intact as long as the price holds above the 0.00001079 SL region.
Risk-to-Reward: The setup offers an attractive 4.5 R/R ratio, making it highly favorable for swing trading.
📌 Summary
This is a clean, trend-continuation trade with defined risk and strong technical backing. Traders looking for a mid-term opportunity should keep an eye on volume and price action around TP1 for potential partial exits or trailing stop adjustments.

Long trade
1Hr TF overview
🟩 Buyside Trade Log
📈 Pair: PEPE/USDT
🏷️ Type: Intraday | LND Session AM
🧠 Setup: Breakout
📅 Date: Sunday, 18th May 2025
🕥 Time: 10:45 AM
🔹 Entry Price: 0.00001317
🔹 Profit Target: 0.00001480 (+12.38%)
🔹 Stop Loss: 0.00001312 (-0.38%)
🔹 Risk-Reward Ratio: 32.60
🔍 Reasoning:
This buyside trade capitalised on a breakout from consolidation during the London AM session.

PEPE/USDT is Nearing an Important ResistanceHey Traders, in today's trading session we are monitoring PEPE/USDT for a selling opportunity around 0.00001330 zone, PEPE/USDT is trading in a downtrend and currently is in a correction phase in which it is approaching the trend at 0.00001330 support and resistance area.
Trade safe, Joe.

Buy Trade Strategy for PEPE: Riding the Meme Coin MomentumDescription:
This trading idea is based on PEPE, a meme-based cryptocurrency that has rapidly gained popularity within the crypto community. Inspired by internet culture and viral trends, PEPE has seen significant growth fueled by social media attention, community-driven hype, and speculative momentum. While meme coins often lack traditional utility, they thrive on community engagement, branding, and timing — factors that have historically driven explosive gains in the crypto market. PEPE benefits from being part of this high-risk, high-reward niche, attracting traders who aim to capitalize on short- to mid-term momentum.
Still, it's crucial to understand that meme coins like PEPE are among the most volatile and speculative assets in the crypto space. Their price can be heavily influenced by market sentiment, influencer activity, and rapid shifts in investor interest. As such, trading PEPE requires strict risk management and a clear understanding of the speculative nature of the asset.
Disclaimer:
This trading idea is for educational purposes only and does not constitute financial advice. Meme coins like PEPE involve a high degree of risk, and investors should be prepared for extreme volatility and potential total capital loss. Always do your own research, consider your financial position, and consult with a qualified advisor before making any investment decisions. Past performance does not guarantee future results.

PEPEUSDT PEPEUSDT 📉🚨🚨
DISCLAIMER:
what I share here is just personal research, all based on my hobby and love of speculation intelligence.
The data I share does not come from financial advice.
Use controlled risk, not an invitation to buy and sell certain assets, because it all comes back to each individual.

PEPE/USDT – Breaking Higher, But Can It Sustain? - May 16, 2025Timeframe: 1D
Published: May 16, 2025
Author: Kamrani.fxc
📈 Market Structure Outlook
PEPE/USDT is showing early signs of a bullish market structure flip after breaking above a prior swing high and reclaiming the 200-day SMA — a key technical milestone that often signals a trend shift. The current move appears impulsive and has taken price directly into a local resistance zone around 0.00001380, which marks the first major test.
Above this zone, there are two additional higher-timeframe supply areas around:
🟡 0.00002100
🟡 0.00002500
These zones align with previous rejection points and may act as future targets or reversal regions.
🧭 Volume & Momentum
Volume: The rally shows strong relative volume, suggesting legitimate interest and not just a short squeeze.
RVOL: Likely exceeding 1.5 — bullish confirmation.
CVD (Cumulative Volume Delta): Needs to stay positive to support further upside.
Momentum Indicators: RSI is approaching overbought, and traders should monitor for bearish divergence or Stoch-RSI exits in the next few sessions.
☁️ Trend Validation
Price is trading above the 200 SMA, and if Ichimoku’s Chikou Span confirms by holding above price, that will validate the new uptrend.
OBV trend should also be watched for alignment with price action.
🌍 Macro & Sentiment Filters
Macro conditions appear risk-on, which supports continuation:
BTC Dominance ⬇
USDT Dominance ⬇
TOTAL2 ⬆
Final confirmation requires checking:
📰 Sentiment Score (positive headlines & narratives)
📊 Social Buzz (spike in attention relative to price)
💸 Funding Rates (avoid excessive long crowding)
✅ Summary
PEPE is staging a notable recovery and showing potential for a broader trend reversal. Traders should watch the current resistance closely and wait for volume + sentiment alignment before entering. With proper confirmation, this could be the start of a strong move toward prior highs.
📌 Follow for more data-driven altcoin insights.
📩 Drop a comment if you’d like the intraday levels or funding data breakdown.
Disclaimer:
This is an analysis-based idea and not a trading signal. All trading decisions are solely your responsibility. Please manage your risk accordingly.
#PEPE #Crypto #Altcoins #TechnicalAnalysis #TacticalTrading #TradingViewIdeas


PEPE price analysisCRYPTOCAP:PEPE price has grown quite well over the past month.
Now the OKX:PEPEUSDT price, in our opinion, has reached a critical point from where it would be appropriate to correct a bit before continuing to grow:
1️⃣ correction to $0.0000100-0.0000105 can be considered “delicate”, which will only confirm the strength and serious further intentions of buyers.
2️⃣ correction to $0.0000084-0.0000085 can be considered “on the verge of a foul”, but the upward trend will continue and will not be broken.
3️⃣ or do you think there is no time for corrections, and we should continue to grow to ATH right now?
_____________________
Did you like our analysis? Leave a comment, like, and follow to get more

PEPE/USDTPepe currently showing uptrend on daily & weekly time frame, after touching support line showing same uptrend pattern as in past.
Trade Plane
Stop loss : 0.00000393
Target : 0.00003683

PEPE – 2x Move Looks ImminentOne of the strongest alt structures right now.
Given how well it’s held previous swing lows—and the recent deviation and retest—it’s pretty clear where this is headed.
This is a longer-term play. It might take weeks to reach the yearly open, where I’ll look to offload, or slightly earlier depending on how it reacts to the weekly block.
Also worth noting: PEPE is one of the few alts still maintaining an active weekly uptrend.
BINANCE:PEPEUSDT CRYPTOCAP:PEPE

Is PEPE Ready for Its Next Leg Up? Key Support Levels to Watch! PEPE/USDT Analysis: Bullish Trend, Pullback, and Opportunity 🚀🐸
👋 Today, I’m taking a look at the PEPE/USDT chart. We’ve seen PEPE in a strong bullish trend lately, riding a strong momentum wave. Theres a shift at the moment when you look at the broader market—US dollar strength is still in play, and we’re seeing some pullbacks in Bitcoin and other major cryptos. 💵📉
PEPE is starting to pull back. This isn’t a bad thing—in fact, healthy pullbacks are what set up the next big moves. What I’m watching for is a retracement down into a key support zone. If price can hold there and we see a bullish break of structure, that’s my cue to look for a buy opportunity. 🛑➡️📈
The key here is patience. I want to see confirmation that buyers are stepping back in—i.e. strong bullish candles, a clear break of the recent lower high (BoS), or even a spike in volume. If we get that, I’ll be ready to ride the next leg up. Until then, I’m biding my time and letting the market come to me. 🕰️
Remember, no FOMO—let the setup come to you, and always manage your risk.🍀
