NAS100 trade ideas

US 100 Strong Signal Steps In? US100 Breaks Bearish Trendline & Pulls Back Above SMA — Strong Long Signal!
The US100 has just broken out of its bearish trendline, signaling a potential shift in market momentum from bearish to bullish.
What’s more bullish is the recent pullback above the Simple Moving Average (SMA), which now acts as a dynamic support level — a classic confirmation that buyers are stepping back in.
Adding to this bullish case, volume is increasing, showing strong participation and conviction behind the move.
This confluence of technical factors indicates a high-probability setup for a long position on the US100.
Key points:
Bearish trendline broken — trend reversal alert
Price retested and held above SMA — support confirmed
Volume rising — strong buyer interest
Traders might consider entering long positions with appropriate risk management and stop-loss placement below the SMA or recent swing low.
Stay sharp and trade smart!
Follow @GoldenZoneFX For more content and valuable insights.

QQQ best count if we rally above 525 The chart is the qqq wave structure the only alt is it is a triangle formation and that be down and up and down then rally back to above the heavy selling at 531 target I think


Nasdaq giving hints of bearishness failing to close above rangePlease review what I think I'm seeing. If you have any comments in regard to these potential levels they are always welcome.
I believe we may be actually bearish from here but without a daily close below the highest block, my decided choice must be neutral. Purely mechanical analysis will save your portfolio 💎
Don't forget to subscribe & share this with someone who is learning 🙏🏾

BUY NAS100 TO CLOSE GAPBreak of 1HR TL, retest, long. Basics. No greed, just trading to the gap. Monitor SL and let the trade breathe.

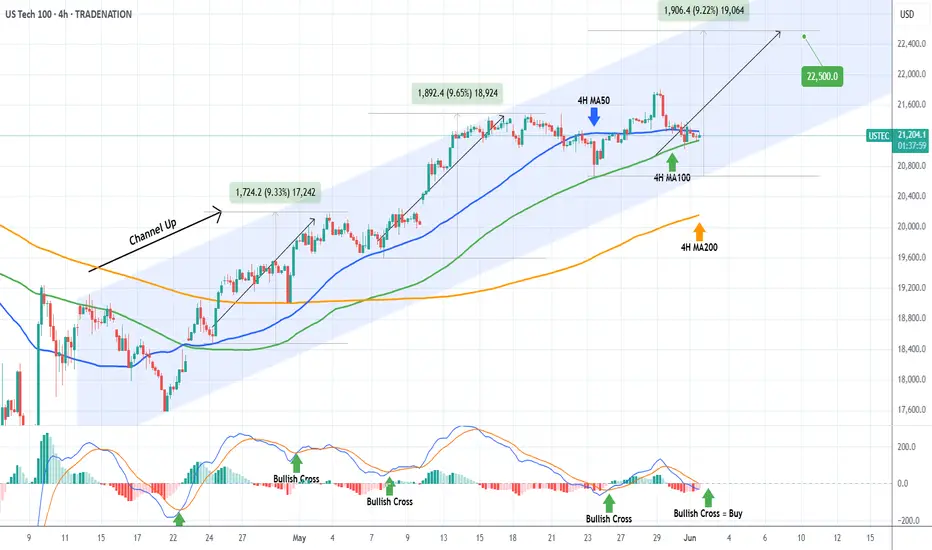
NASDAQ Will the 4H MA100 come to the rescue?Nasdaq (NDX) is trading within a 3-week Channel Up, which is currently supported by the 4H MA100 (green trend-line). In fact, the price is being squeezed in the last three 4H candles within the 4H MA100 and the 4H MA50 (blue trend-line).
This tight compression technically tends to cause violent break-outs either way. As long as the Channel Up holds, we expect that to be upwards and it should be confirmed by the formation of a 4H MACD Bullish Cross.
With the last two major rallies being around +9.50%, we expect to see 22500 on the next Leg Up.
-------------------------------------------------------------------------------
** Please LIKE 👍, FOLLOW ✅, SHARE 🙌 and COMMENT ✍ if you enjoy this idea! Also share your ideas and charts in the comments section below! This is best way to keep it relevant, support us, keep the content here free and allow the idea to reach as many people as possible. **
-------------------------------------------------------------------------------
Disclosure: I am part of Trade Nation's Influencer program and receive a monthly fee for using their TradingView charts in my analysis.
💸💸💸💸💸💸
👇 👇 👇 👇 👇 👇
US100 – Daily Chart Outlook (June 2, 2025)Price is showing signs of weakness after rejecting the 21,386 level, forming a potential shift in structure. Here's what I’m watching:
🔹 Context: After a bullish move in May, price is now stalling near previous highs.
🔸 Key Level: 21,386 marked as a potential rejection zone (also labeled as “Bullish”).
🔻 Scenario: If price stays below 21,386 and breaks the blue support (around 21,040), I expect continuation lower.
🟩 Discount Area: First demand zone between 20,000–20,500. Price could find support here if the bearish scenario plays out.
📌 ADR Levels included for volatility context.
🔄 Plan:
Wait for confirmation of rejection.
Target zone: 20,400–20,000.
Invalidation above 21,386 with bullish structure.
🧠 Bias: Bearish unless price reclaims 21,386 and holds.
📌 This is not financial advice – trade your plan.

Hanzo / Nas100 15 Min Path ( Confirmed Break Out Zones )🔥 NAS100 – 15 Min Scalping Analysis (Bearish Setup)
Bias: Waiting For Break Out
Time Frame: 15 Min
Entry Type: Confirmed Entry After Break Out
👌Bullish After Break : 21310
Price must break liquidity with high volume to confirm the move.
👌Bearish After Break : 21125
Price must break liquidity with high volume to confirm the move.
☄️ Hanzo Protocol: Dual-Direction Entry Intel
➕ Zone Activated: Strategic Reaction from Refined Liquidity Layer
Marked volatility from a high-precision supply/demand zone. System detects potential for both long and short operations.
🩸 Momentum Signature Detected:
Displacement candle confirms directional intent — AI pattern scan active.
— If upward: Bullish momentum burst.
— If downward: Aggressive bearish rejection.
💯 Market Zone: Transition Phase
Asset in premium-to-discount (or vice versa) range — valid for both reversal and continuation trades. Execute with precision.

US100 (NASDAQ100)🎯 Current Bias: Bearish Short-Term
-Price has already formed a lower high and lower low structure.
-Sitting at a key retracement zone after recent drop.
-Smart money concept (CHoCH → BoS) suggests institutional repositioning for shorts.
💡 Trading Opportunities
1. Short Opportunity (Main Bias)
-Entry Zone: Between 0.5 to 0.618 retracement (21,220–21,260)
-Stop Loss: Above 0.382 level / local high (~21,300)
-Target 1: 21,117.5 (marked Fibonacci level)
-Target 2: 21,000 psychological / next POI
Confluence:
-Bearish market structure
-Premium zone tap + Fib retracement zone
-CHoCH and BoS confirming order flow shift
2. Countertrend Long (Aggressive & Lower Probability)
-Entry: If price hits 21,117.5 and forms a bullish CHoCH or internal BoS
-SL: Below 21,050
-Target: Revisit 0.5–0.618 zone or unmitigated supply above
⚠️ Risk Notes
-NFP/major US data could trigger volatility (always check the calendar).
-US100 can whipsaw during macro catalyst moments – avoid overleveraging.

NAS100 - Will the stock market continue to rise!?The index is above the EMA200 and EMA50 on the four-hour timeframe and is trading within the specified range. In case of a valid break of this range, I expect a new trend to form. In case of corrective movements towards the demand zone, we can buy Nasdaq in that range with an appropriate reward for the risk.
A recent report from Bank of America reveals that investors are actively repositioning in global markets. For the second consecutive week, U.S.equities experienced capital outflows, while European stocks saw inflows for the seventh straight week.
Digital assets attracted $2.6 billion in inflows—the largest amount since January. In contrast, Japanese equities recorded the largest weekly outflow in history, while emerging markets equities attracted their highest inflows of 2025. Meanwhile, emerging markets debt also posted its strongest inflows since January 2023.
Jamie Dimon, CEO of JPMorgan, speaking at the 2025 Reagan National Economic Forum, warned that China will not yield to U.S. trade pressure. He urged that the U.S. must first address its internal challenges, including reforming laws, taxes, immigration, education, and healthcare systems. Dimon also underscored the importance of preserving military alliances.
He noted that China is a serious and potential rival, and if the United States fails to maintain its position as the world’s dominant economic and military power over the next 40 years, the dollar will no longer serve as the global reserve currency. Having just returned from China, Dimon added, “The Chinese are not afraid; don’t expect them to bow to America.”
Currently, markets are pricing in two interest rate cuts totaling 50 basis points by the end of 2025—a forecast aligned with the Federal Reserve’s official dot plot projections. Additionally, the latest FOMC minutes, which revealed policymakers’ concerns over persistent inflationary pressures, played a significant role in shaping these expectations.
Federal Reserve Governor Christopher Waller stated that he would support rate cuts later this year if tariffs remain around an average of 10%. However, his support hinges on inflation moving toward the Fed’s 2% target and the labor market maintaining its current strength.
Meanwhile, Morgan Stanley projects that the U.S. dollar could weaken by approximately 9% by mid-2026, citing a slowdown in U.S. economic growth and an anticipated 175 basis point reduction in the Fed’s interest rates. The bank also forecasts that 10-year Treasury yields will reach 4% by the end of 2025 but fall sharply in 2026 as rates decline further. Both Morgan Stanley and JPMorgan hold a bearish outlook on the dollar, expecting safe-haven currencies such as the euro, yen, and Swiss franc to benefit the most from its weakness.
In this context, market participants are closely watching key economic data in the week ahead. The ISM Manufacturing PMI is scheduled for release on Monday, followed by the Non-Manufacturing PMI on Wednesday. However, the main highlight will be Friday’s May Non-Farm Payrolls (NFP) report, which has exceeded expectations over the past two months. A similar result this time would signal continued strength in the labor market.
Given the Fed’s focus on inflation risks, special attention will likely be paid to the average hourly earnings growth. If wage growth remains above 3%, the market may begin to reprice some of its expectations for rate cuts—especially if the ISM reports also indicate improved economic activity in line with strong S&P Global readings. Such a scenario could pave the way for a renewed strengthening of the U.S. dollar.
Alongside the data releases, a series of speeches from key Federal Reserve officials—including Goolsbee (Chicago), Bostic (Atlanta), Logan (Dallas), and Harker (Philadelphia)—are expected. These remarks could further shape market expectations regarding the future path of monetary policy.

Nasdaq-100 H4 | Approaching an overlap supportThe Nasdaq-100 (NAS100) is falling towards an overlap support and could potentially bounce off this level to climb higher.
Buy entry is at 20,833.76 which is an overlap support that aligns with the 23.6% Fibonacci retracement.
Stop loss is at 20,100.00 which is a level that lies underneath a pullback support and the 38.2% Fibonacci retracement.
Take profit is at 21,763.98 which is a swing-high resistance.
High Risk Investment Warning
Trading Forex/CFDs on margin carries a high level of risk and may not be suitable for all investors. Leverage can work against you.
Stratos Markets Limited (tradu.com ):
CFDs are complex instruments and come with a high risk of losing money rapidly due to leverage. 63% of retail investor accounts lose money when trading CFDs with this provider. You should consider whether you understand how CFDs work and whether you can afford to take the high risk of losing your money.
Stratos Europe Ltd (tradu.com ):
CFDs are complex instruments and come with a high risk of losing money rapidly due to leverage. 63% of retail investor accounts lose money when trading CFDs with this provider. You should consider whether you understand how CFDs work and whether you can afford to take the high risk of losing your money.
Stratos Global LLC (tradu.com ):
Losses can exceed deposits.
Please be advised that the information presented on TradingView is provided to Tradu (‘Company’, ‘we’) by a third-party provider (‘TFA Global Pte Ltd’). Please be reminded that you are solely responsible for the trading decisions on your account. There is a very high degree of risk involved in trading. Any information and/or content is intended entirely for research, educational and informational purposes only and does not constitute investment or consultation advice or investment strategy. The information is not tailored to the investment needs of any specific person and therefore does not involve a consideration of any of the investment objectives, financial situation or needs of any viewer that may receive it. Kindly also note that past performance is not a reliable indicator of future results. Actual results may differ materially from those anticipated in forward-looking or past performance statements. We assume no liability as to the accuracy or completeness of any of the information and/or content provided herein and the Company cannot be held responsible for any omission, mistake nor for any loss or damage including without limitation to any loss of profit which may arise from reliance on any information supplied by TFA Global Pte Ltd.
The speaker(s) is neither an employee, agent nor representative of Tradu and is therefore acting independently. The opinions given are their own, constitute general market commentary, and do not constitute the opinion or advice of Tradu or any form of personal or investment advice. Tradu neither endorses nor guarantees offerings of third-party speakers, nor is Tradu responsible for the content, veracity or opinions of third-party speakers, presenters or participants.

starting shortIt seems that the week is set to start with a bearish move. Again, bulls can't hold or defend levels.
there isn't much to say, if bulls wont support America, it`s on them

NASDAQplanning this coming weeks trade on NAS... so here do have a common reaccurence that happens where price goes into accumulation then making a fake out just to go the opposite way, not its retracing to mitigate a candle i found in the 1hr entry but going to wait, quick RR 1:20

Nasdaq prepares for the reboundNasdaq index might be supported after AI-narrative getting back to the markets fueled by NVDA’s better than expected earnings for Q1 2025. The position of the price is close to the 20-day moving average, which makes a trade location potentially good for starting the upswing to the target area of $22,000.
Traders will watch the publication of ISM Manufacturing index on Monday, as it has some correlation with S&P 500 and Nasdaq, and might strengthen or weaken the current “AI rebound narrative”.
Don't forget - this is just the idea, never forget to manage your risk at all times!

US100 - Buy CMP - 02/06/2025Bullish Trend on H4 - No divergence on H4
Fundamentally Bullish. Buy on CMP - SL on previous HL.

NASDAQ100 Analysis – Key S/R Zones & Price Reaction Incoming! NASDAQ100 Analysis – Key S/R Zones & Price Reaction Incoming! 🚨
🔍 Chart Breakdown:
This is a technical chart analysis of NASDAQ100 (NAS100) with defined Support and Resistance zones. The price is currently at 21,314.50, sitting below a critical decision area.
🧱 Key Zones:
🔵 Resistance Zone:
‣ 21,640 – 21,800
‣ Strong supply area where price sharply reversed previously.
‣ If price breaks above the mid resistance zone, a bullish move towards this level is likely.
🟩 Support + Resistance Flip Zone:
‣ 21,280 – 21,420
‣ Former support, now acting as resistance.
‣ Price is struggling to reclaim this zone.
‣ Acts as a key decision level.
🟢 Support Zone:
‣ 20,630 – 20,750
‣ Strong demand zone from which previous rallies initiated.
‣ Target if bearish rejection continues.
🔄 Price Action Insight:
Price is currently rejecting the Support-turned-Resistance zone.
There’s a clear bearish rejection at the mid-zone (S/R flip), forming a lower high structure.
📉 A breakdown from current levels could lead to a retest of the support zone at 20,700 area.
🟢 However, a successful reclaim and bullish confirmation above 21,420 could see price target the upper resistance at 21,800.
📌 Outlook:
🔽 Bearish Bias if price fails to break above 21,420 – possible drop to 20,700.
🔼 Bullish Reversal above 21,420 could drive price to 21,800.
📅 Date: June 1, 2025
🕒 Timeframe: Likely 1H or 4H chart
💬 “Respect the levels, not the noise.”
Trade safe! ✅

Upcoming Monthly/Weekly Analysis!FA Analysis:
1- Recent macro-economic data were good. But they do not reflect the Tariffs impacts.
2- All expected data (i.e., inflation, consumer sentiment) were inline with the projected tariff impacts.
3- Uncertainty is in the driver seat as long as Trump flip flop with his tariffs.
4- The 90-day tariff pause ends by July 4th!!! Surprise...surprise... the liberation day! Definitely, Trump will announce the 2nd Liberation day!
5- From this week and moving forward, data will reflect tariffs impacts.
6- This week, we have many relevant data and probably many Trump tweets.
=) All the above has structural negative impacts on US economy; hence negative impacts on US Stocks and equities.
TA Analysis:
Monthly TF:
NQ monthly close was bullish. From this TF, we should expect a continuation up seeking a new ATH. But I strongly doubt it. The Monthly close was below 21457. If price will be unable to close at least above this level, price should revisit 17236.
In this thread, we do not trade Monthly TF, but it gives us a macro perspective.
Weekly TF:
The weekly close was bearish, even with a green candle. From this TF, we should expect a south move.
In my view, Wave 3 has started last week.
Daily TF:
The chart shows all levels of Wave 3 into 5 mini-waves. The target of this mini-wave 3.1 is the low of May (19594).
Price already broke TL and closed below it. Price from now on it should continue south/down.
Price must close inside the tariff on & off candle (yellow box).
(Note: The chart shows only three waves of 3.1 representing the Initial move, retrace move and impulsive move. But every single move/wave should have 5 waves. I do not represent them to avoid making the chart complex which it's already!).
Hourly TF:
Price might complete the retrace up to 21468-21590. Then resume the down movement as per the chart.
Data will give the ebb and flow to be inline with TA analysis.
That's all for this week/month.
Wish you GL and plenty of green trades.

Recession post #9778Trial and error describes my past calls considering there was resistance and pullbacks on the daily tf but this time I'm certain
abso-tut-ely
Posi-tively
Demise
Trumps attempts have played out like a witty protagonist of a finance suspense thriller but that has nothing to do with the historical alignments of boom and bust systems. I think he intended to crash markets so it could recover but I'm not convinced this tank is greater than this

US100 - Bullish Momentum Favors Upside ContinuationThe US Tech 100 is displaying strong bullish momentum after successfully breaking above the critical resistance level at 20,659.8, which had previously acted as a significant barrier. Currently trading at 21,316 the index has demonstrated impressive upward trajectory following what appears to be a healthy consolidation phase around the key resistance-turned-support zone. The technical setup strongly favors continuation to the upside as the higher probability scenario, with the breakout above 20,659.8 potentially opening the door for further gains toward higher resistance levels. However, prudent risk management suggests taking this rally piece by piece, monitoring how price action develops at each significant level while watching for any signs of exhaustion or pullback that might offer better entry opportunities. The bullish bias remains intact as long as the index maintains its position above the former resistance level, which should now serve as dynamic support for any potential retracements.
Disclosure: I am part of Trade Nation's Influencer program and receive a monthly fee for using their TradingView charts in my analysis.

USTECUSTEC price is near the resistance zone 21776-22139. If the price cannot break through the 22139 level, it is expected that the price will drop. Consider selling the red zone.
🔥Trading futures, forex, CFDs and stocks carries a risk of loss.
Please consider carefully whether such trading is suitable for you.
>>GooD Luck 😊
❤️ Like and subscribe to never miss a new idea!

NAS100 4H | Fibonacci Bounce or Break? Key Trendline Test Incomi📈 Description:
Price is currently testing a key ascending trendline on the 4H, sitting just below the 38.2% Fib retracement after rejecting near the 0% level. I’m watching this area closely for either:
✅ A bullish bounce from the 38.2%–50% zone with confluence from EMA 20 and trendline support — targeting 0% then -27% extensions (around 21,750 to 22,200),
or
❌ A clean break and close below the trendline + 61.8% level that could shift short bias toward deeper Fib zones like 78.6% or even 100%.
Indicators Used:
• EMA 20 / EMA 68 for dynamic S/R
• Fibonacci retracement (swing low to recent high)
• Trendline (4H structure support)
🧠 I’ll wait for clear structure before entering — no early entries here. Looking for a strong engulfing candle, MA crossover, or lower-timeframe breakout confirmation depending on the direction.
📍Will update if we get confluence on the 15min/1hr to support entry.

Nas100 w1.trading I deaHi traders as you can see this market is n uptrend market n since Trump come to the office he started tarrif n tarrif cause big rejection as you can see however he paused it n comes bek up,now they were trying to block him but he managed to put them back again because of his reasons,ok cool you have to understand that all this moves since Trump took the office he is the one in charge and he is moving market soo that's why today things can bebetter n tomorrow you can see spike again we we're nearly recession and he paused tarrif,market comes bek up,soo if you stick to the tre you are in the right side,soo note that we are still trading under tarrif territory meaning you can see spike today n tomorrow then drown down that's why you need to be updated 24/7 knowing what is moving and why I laugh when I see someone draw graph n see spike to their direction n immediately get exited within 1 hour market recovery that spike very fast lol,you need to know what is moving the market soo that you wo the surprised soo this year 99% is trump reports that is moving the market if he can imposes tarrif to Europe on 12 June you gonna see entire market going down for short period,tarrif affect the market globally not only were it raised,that's why if trump n China won't make successful deal we might see a recession and as am seeing China they are ready to fight any kind of war and they are loosing interest in trading deals and this will lead to recession globally,all they want is to end tarrif and trump want better deals in businesses aswell soo this is the main n strong trade war between all countries and it can cost people's money,soo according to my analysis am still bullish am not talking this as a retest noo that's why i explained what makes it to fall and positivity to the deals means rally thats why I stick to the trends till now,until further notice,.make sure you are updated.
