Nasdaq look out for weekly sellwe have look into all the tim frames all we see is sells happening next week
there was a trend going up since last week but this week we looking for sells stay turned
NAS100 trade ideas

NAS100 Breakout – Eyeing Bullish Extensions or False Break?The NAS100 (US100) is in full breakout mode on the daily, surging past previous highs near 22,140 with strong momentum. Price is now trading at ~22,550, decisively above prior resistance, which could now act as support if we retest.
🔎 Multi-Timeframe Breakdown:
✅ Daily Chart:
• Massive bullish structure intact.
• Clean breakout above horizontal resistance at 22,140.
• Price riding an aggressive ascending trendline — watching for sustained closes above breakout level.
✅ 4H Chart:
• Higher lows and bullish impulsive candles confirm buyers in control.
• Multiple support zones below (22,300, 22,100) for potential retests.
• Key short-term resistance formed near 22,650 — a rejection here could trigger correction.
✅ 1H & 23m Charts:
• Micro pullback seen after tagging fresh highs; price still holding above short-term trendlines.
• Consolidation zone between 22,500–22,600 could be decisive for next move.
⸻
📌 Key Zones to Watch:
• Support: 22,300 / 22,140
• Resistance: 22,650 / 22,800
• A breakout retest could confirm continuation; otherwise, failure to hold support might signal a fakeout.
⸻
📈 Bias: Bullish (Long)
While momentum remains strong, be prepared for potential sharp corrections given overextension.
⸻
What do you think? Drop your thoughts below! 🚀👇

WRONG!, THIS IS A BAD IDEA, SHORT INDEXESYa know... as the title says. It's wrong, nothing about this idea is sensical... but that's where it just might pay off. Non-sense. One special person to take the bull by the horns and say "I want in at better prices"...
This is not trading advice nor a valid idea, nothin says the chart will reverse... being early and being right eventually doesn't usually pay... but watch for signs... they may come.

NAS SETUPNas 100 setup using smart money concepts. A change in the state of price delivery has occured at level 22,518.48 then we wait for entry cnfirmation when price either touch the bearish order lock at level 22,519.23 or when it comes back to the fair value gap to rebalance price at level 22,560.67 ....hence we are shorting the market when our rules are met

US Tech 100 CFD broke the Resistance level 22,365.0 range👀Possible scenario:
U.S. stock futures climbed on June 27, with the S\&P 500 and Nasdaq nearing record highs as investors awaited May’s PCE inflation report — the Fed’s preferred gauge — due at 8:30 a.m. ET.
Rate cut expectations grew following reports that President Trump may replace Fed Chair Powell by fall. The odds of a July rate cut rose to 20.7%, up from 14.5% last week. Soft GDP growth, rising jobless claims, and a rare earth trade agreement with China added to the dovish outlook. Also due June 27 final June consumer sentiment data and remarks from several Fed officials.
✅Support and Resistance Levels
Support level is now located at 21,360.0
Now, the resistance level is located at 22,570.0

USNAS100 Hits New ATH | Watch 22,520 for Possible Correction USNAS100 TECHNICAL OVERVIEW
Nasdaq 100 Prints New ATH | Eyeing 22,640, But Correction Risk Builds
USNAS100 recorded a new all-time high, supported by broad bullish sentiment across U.S. indices after upbeat S&P and inflation data boosted risk appetite.
Technically, the index remains bullish, but signs of short-term exhaustion are appearing.
If the price closes below 22,520 on the 1H timeframe, a correction toward the 22,280 zone is likely.
However, a clean break above 22,640 would confirm continuation toward the next upside target at 22,790.
Key Levels
Pivot Line: 22,520
Resistance: 22,640 → 22,790
Support: 22,410 → 22,280 → 22,200
Take a look at the previous idea to see more reality...

Smart Friday Trades: NASDAQ Setup and Key Levels to Watch NAS100📊 NASDAQ US100 Analysis – Friday Setup
I'm currently watching the NASDAQ closely 👀. The NAS100 looks significantly overextended 📈, and with it being the end of the week, we often see price action push into the weekly high before pulling back into the weekly close 🔁.
This is a pattern I’ve seen play out many times during the New York session on Fridays 🗽📉.
💡 Here’s my suggestion:
Wait for today’s data release 📅 to finish. If price ranges and then breaks market structure to the downside, keep an eye out for a short entry on the retrace and retest of the range low.
🎯 Your targets and stop loss are outlined clearly in the video, so make sure to watch it through.
⚠️ Trade sensibly, manage your risk, and don't rush into anything.
I'd love to hear your thoughts in the comments 💬
Have an awesome day and I’ll see you in the next one! 🚀

Tomorrow marks start of downtrend?NASDAQ just swept all-time highs into a key diagonal trendline drawn from previous major swing highs. We’re now in the premium zone of a macro fib retracement, and Asian session is showing signs of accumulation around 22,460.
Expecting London session to run Asian highs, tapping 22,500, which lines up perfectly with:
✅ Major rising trendline resistance
✅ 0.0 fib (ATH)
✅ Asian liquidity sweep
✅ High probability "Manipulation" phase of AMD (Accumulation–Manipulation–Distribution)
Looking to short at 22,500 with a tight SL at 22,520–22,530, targeting a full swing retrace into 20,500.
Confluences:
Bearish AMD setup across sessions
Major trendline rejection zone
Premium fib zone (swing retracement logic)
Liquidity sitting below multiple structural lows
Risk-to-reward of 1:100 potential if held to target
Waiting for confirmation via lower timeframe BOS after the sweep. If 22,500 holds as resistance post-sweep, this could be the beginning of a broader correction.
Let’s see how it plays out. 🔥

Nasdaq leads the rally and can move for 3-5 days moreWhile crude oil is declining, tech stocks are gaining momentum: Nasdaq had reached another all-time-high recently and that might not be over: according to statistical studies, it rarely reverses quickly above the upper Bollinger Bands line and the average swing duration is between 17 and 20 days (which gives us several days of potential continuation).
The earnings season fuels growth for many technological stocks, and the “sell America” narrative steps back, so we may see Nasdaq growing as shown in the chart below.
Don't forget - this is just the idea, always do your own reserch and never forget to manage your risk!

The W FormationThe question now is, with the W pattern forming with bold bullish price, that has broken a high we had as a target yesterday, tapped on the FVG already and now showing some positive candle stick communication, will we buy to continue breaking the highs, or relax and wait for more confirmation within the fvg range or even lower before going in?

NasdaqNon-commercials (hedge funds, asset managers, etc.) are adding significant long exposure.
This usually reflects confidence in continued upside, often in line with strong tech earnings, soft landing narratives, or a dovish Fed.
Bias: Bullish
Large speculators significantly increased long exposure on Nasdaq futures, showing strong confidence in continued upside momentum. This aligns with recent tech-led rallies and soft-landing expectations.

NAS100 Reading Market Structure: When to Trade and When to WaitI'm currently keeping a close eye on the NASDAQ 📉. Price has remained largely range-bound over the past few sessions and continues to show signs of pressure 🔻. While we've seen a short-term rally 🚀, it lacks the conviction and momentum typically seen in stronger trending environments 📊.
When comparing the current conditions to previous trend phases, the difference is clear. Structure is unclear, and there's no confirmation of sustained direction yet. As shown on the chart 📈, we previously saw strong bullish momentum followed by a sharp shift, suggesting indecision in the market 🤔.
In these situations, patience is key ⏳. It's just as important to know when not to trade as it is to know when to act 🎯. For now, I’m choosing to stay on the sidelines until a clearer trend develops.
Not financial advice ⚠️

NAS100 - Follow Progress 1Dear Friends in Trading,
How I see it,
At this time, I need the following:
1) A bounce from 22424 to validate current trend resistance.
2) Or an invalidation of previous demand - A breach of 22424.
3) Or a new ATH - A breach of 22920.
Keynote:
We are still in an extreme bullish environment.
Determine your bias every day and each day.
I sincerely hope my point of view offers a valued insight.
Thank you for taking the time to study my analysis.

NAS100 - Stock market is waiting for tariffs!The index is above the EMA200 and EMA50 on the four-hour timeframe and is trading in its ascending channel. Maintaining the ascending channel will lead to the continuation of the Nasdaq's upward path to higher targets, but if it does not rise and corrects towards the demand limits, you can buy the Nasdaq index with appropriate reward and risk.
Three months ago, Donald Trump postponed the imposition of severe retaliatory tariffs, granting America’s major trading partners more time to reach new agreements that Washington views as “fairer.” Now, as the White House’s July 9 deadline approaches, only two official trade deals have been finalized—one with the United Kingdom and another with Vietnam. As for China, merely a fragile temporary truce has been reached, which has so far prevented any additional tariffs from being enforced.
Although reports suggest promising progress in negotiations with India, Japan, and South Korea, no final agreements have been secured with these countries yet. Interestingly, talks with the European Union—which had previously stalled—have suddenly taken a positive turn, and prospects for a deal with Canada in the coming days have also improved.
However, given the limited time left, it seems unlikely that trade agreements with all of America’s 18 key partners will be reached before the deadline. This situation has raised a critical question for the markets: Will Trump set a new deadline for the remaining countries, or will the suspended tariffs be reinstated?
The prevailing view is that the U.S. president will once again resort to threats before granting any extensions—this time not merely by reviving the “Liberation Day” tariffs, but also by promising even heavier tariffs to extract the last concessions from the remaining trade partners.
U.S. Treasury Secretary Scott Bassett stated that if no agreements are reached by August 1, tariffs will revert to the levels announced in April. He also emphasized that Washington’s core strategy in these trade talks is to apply maximum pressure. According to Bassett, letters will be sent to various countries, outlining the August 1 deadline for reaching deals. This news, which broke during the market’s closing hours, sparked a wave of risk appetite in the financial markets.
In a week when the U.S. economic calendar is notably devoid of major data releases, investors are focusing their attention on the minutes from the Federal Reserve’s June FOMC meeting—a document that could offer fresh insights into the trajectory of interest rates for the second half of the year.
June’s strong employment report, which exceeded market expectations, has effectively dashed hopes for an interest rate cut this month. Now, if the positive economic momentum persists, the likelihood of a rate cut in the September meeting may also gradually be priced out by the markets.
According to data from Challenger, Gray & Christmas, U.S. employers announced 47,999 job cuts in June, marking a sharp decline from 93,816 in the previous month. Compared to June of last year, layoffs have dropped by 2%. However, total job cuts in the second quarter of 2025 reached 247,256—a 39% increase from the same period last year (177,391) and the highest second-quarter layoff figure since 2020.
With no significant economic reports scheduled for the coming days, investors will be closely analyzing Wednesday night’s Fed minutes and the limited remarks from central bank officials—statements where every word has the potential to significantly move the markets.

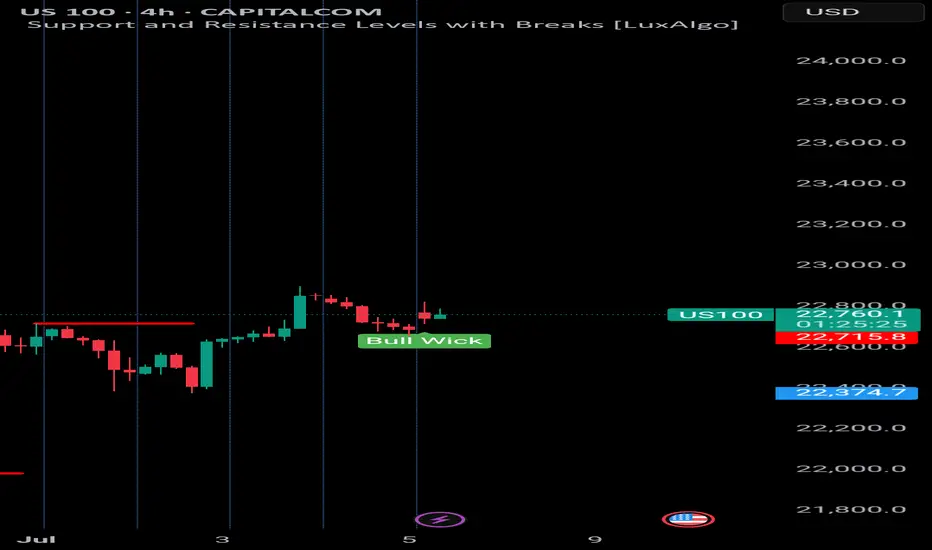
US100/Analysis *📊 US100 (NAS100) – 4H Analysis & Trade Signal*
---
*🔎 Chart Observation:*
- *Current Price:* 22,764
- *Structure:* Market rejected downside strongly with a *Bull Wick* (demand zone reaction).
- *RSI (14):* 60.38
- Momentum is rising again, just under overbought.
- *Bearish divergence* still visible, but price is defending structure.
---
*📌 Key Levels:*
- *Support:* 22,715
- *Resistance:* 22,865 → 23,000
- *Strong Bullish Zone:* 22,720–22,750
---
*📈 Trade Idea: BUY Setup*
- *Entry:* 22,760–22,770
- *SL:* 22,690 (below wick)
- *TP1:* 22,865
- *TP2:* 23,000
- *TP3 (optional):* 23,150 if breakout occurs
---
*🧠 Smart Money View:*
- Likely a *liquidity sweep* below wick zone.
- Demand zone got respected → smart money possibly reloading longs.
- If next candle closes bullish, more confirmation for continuation.
Upward momentum of Nasdaq continues.Upward momentum of Nasdaq continues. Geo-political Tensions cooling down.

Discount Zone Reversal Play Entered a long position after identifying an short formed W formation within discount territory, mapped from yesterday’s high–low range. Price action showed clear structural symmetry, with the second leg completing at a key demand zone.
📌 Buyside liquidity at 22,692.27 acted as the inducement level—price swept it and respected the zone, signaling smart money accumulation.
Key Confluences:
- Extended W structure with balanced legs and volume support
- Price operating below EQ before trigger, favoring bullish reversal
- TP placed just above EQ to anticipate reaction without overextending
- Structure confirmed by neckline retest and bullish candle ignition
This setup aligns with a classic liquidity sweep and reversal narrative, targeting measured premium zones while managing drawdown with tight risk control. The trade is guided by structure, liquidity, and session timing—a patient play with clean narrative flow.


#NDQ - Weekly Targets 23197.39 or 21886.08 ?Date: 03-07-2025
#NDQ - Current Price: 22641.89
Pivot Point: 22541.74 Support: 22335.83 Resistance: 22748.58
#NDQ Upside Targets:
Target 1: 22832.49
Target 2: 22916.40
Target 3: 23056.89
Target 4: 23197.39
#NDQ Downside Targets:
Target 1: 22251.45
Target 2: 22167.08
Target 3: 22026.58
Target 4: 21886.08

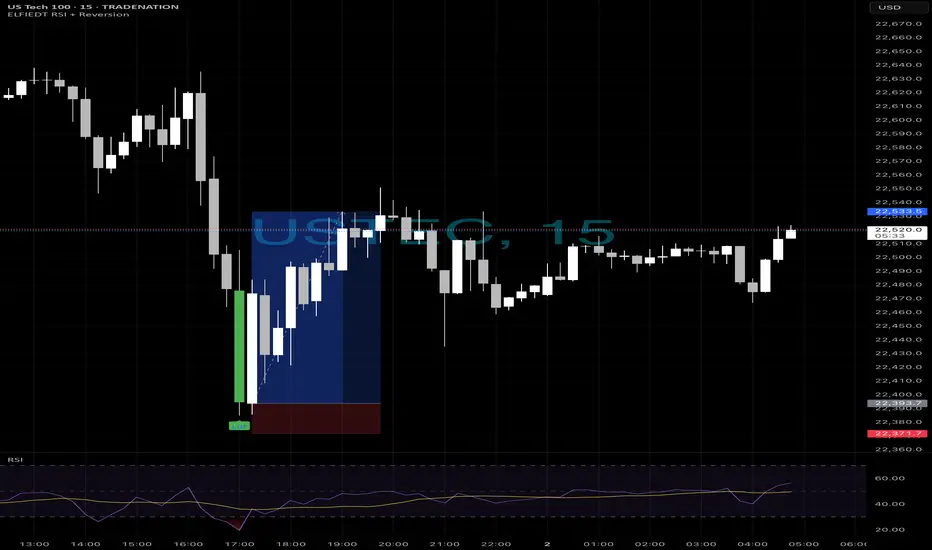
Ustec - longs📈 NAS100 Long Reversal — Powered by ELFIEDT RSI + Reversion Indicator
Timeframe: 15-min
Instrument: NAS100 (US Tech 100)
⸻
✅ Signal Setup (Long Entry)
This clean reversal was captured using my custom ELFIEDT RSI + Reversion indicator, which detects:
• RSI-based exhaustion conditions
• Precise reversal signals (green “UP” label on the chart)
• Trend-aligned confirmations
⸻
📌 Entry Criteria:
1. Oversold RSI conditions signaled potential exhaustion of the downtrend.
2. A clear bullish reversal candle closed with confirmation from the indicator.
3. The “UP” label marked the ideal entry candle just before the impulsive breakout.
4. RSI momentum shifted positively at the point of signal.
⸻
🎯 Execution Plan:
• Entry: At close of the signal candle with the “UP” label
• Stop-Loss: Placed just below the recent swing low (see red zone on chart)
• Target: Up to previous intraday structure and recovery zone
⸻
💡 Key Observations:
• Early signal allowed high RR entry before breakout
• RSI structure confirmed direction shift
• Strong sustained price action into close
⸻
📚 Learn More:
This trade is part of a larger system combining:
• RSI signal dynamics
• Momentum shift detection
• Session and structure alignment
If you’d like more information about the indicator or how to use it in your own strategy, feel free to follow or reach out.
#NAS100 Buy 22499.8#NAS100 Buy 22499.8
SL 21899.8
TP 22699.8
TP 23499.8
TP 24899.8
Trade at your own risk
Protect your capital
The Wizard 🧙♂️ SWFX

ICTTrading foreign currencies can be a challenging and potentially profitable opportunity for investors. However, before deciding to participate in the Forex market, you should carefully consider your investment objectives, level of experience, and risk appetite. Most importantly, do not invest money you cannot afford to lose.
There is considerable exposure to risk in any foreign exchange transaction. Any transaction involving currencies involves risks including, but not limited to, the potential for changing political and/or economic conditions that may substantially affect the price or liquidity of a currency. Investments in foreign exchange speculation may also be susceptible to sharp rises and falls as the relevant market values fluctuate. The leveraged nature of Forex trading means that any market movement will have an equally proportional effect on your deposited funds. This may work against you as well as for you. Not only may investors get back less than they invested, but in the case of higher risk strategies, investors may lose the entirety of their investment. It is for this reason that when speculating in such markets it is advisa

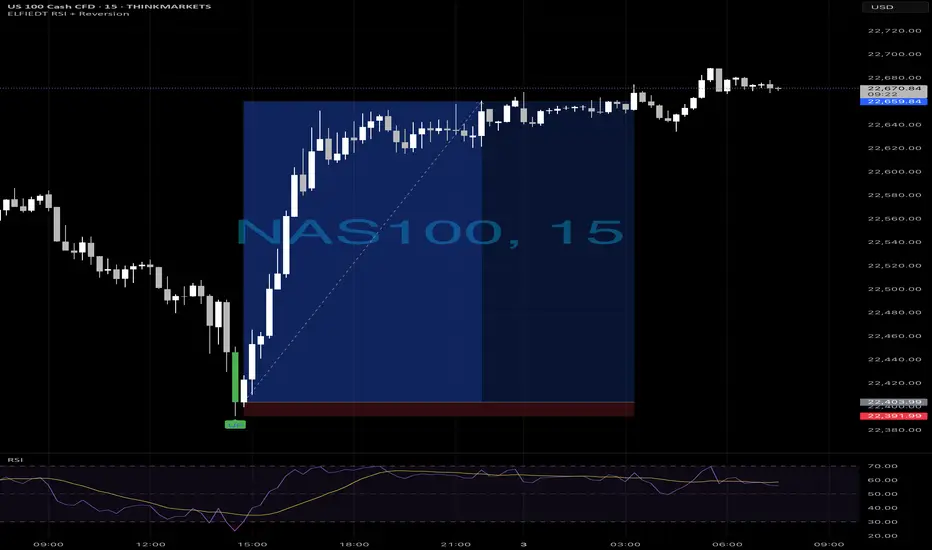
Usrec longs after drop📈 US Tech 100 | 15-Min Chart
✅ Live Trade Example using ELFIEDT RSI + Reversion
⸻
This setup was captured using the ELFIEDT RSI + Reversion indicator. A clean BUY signal was triggered after an extended move, followed by a sharp reversal — perfectly timed and visually confirmed by the indicator’s built-in logic.
💡 The result? A precise entry with a strong follow-through.
This tool is built to spot high-probability reversals with confluence — across timeframes, instruments, and volatility conditions.
⸻
👥 Want to trade with structure and clarity?
Join our community of traders who use this system daily to simplify their decisions and sharpen their edge.
📩 Comment “🔥” or send a DM to learn more.