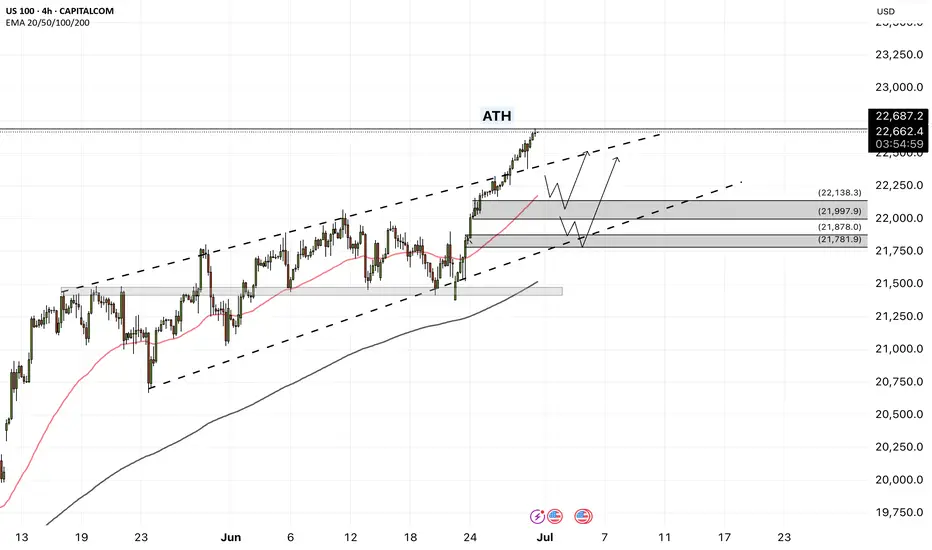
NAS100 - The stock market is breaking the ceiling!The index is above the EMA200 and EMA50 on the four-hour timeframe and is trading in its medium-term channels. If it does not increase and corrects towards different zone, it is possible to buy the index near the reward.
Following a strong rally in U.S.equities, the S&P 500 and Nasdaq indices both achieved new all-time highs on Friday. It marks the first time since February that the S&P 500 has surpassed its previous peak, while the Nasdaq entered fresh price territory for the first time since December.
Despite ongoing market focus on economic data and the Federal Reserve’s interest rate policy path, the simultaneous surge in both indices reflects a renewed appetite for risk in the stock market—an appetite that has been accelerating since mid-April, especially in tech stocks.
In contrast, the Russell 2000 index, which tracks small-cap U.S. companies, still remains significantly below its prior high. To return to its October levels, it would need to rise over 13.5%. However, Friday’s 1.7% gain suggests capital is beginning to flow more broadly into underrepresented sectors.
Analysts argue that a strong breakout in the Russell 2000 could signal a broader rotation toward increased risk-taking—possibly driven by optimism over future rate cuts, easing inflation, and improved business conditions in the second half of the year.
Now that the S&P 500 has reached new highs and the Nasdaq has joined in, attention turns to the Russell 2000. If it begins to accelerate upward, markets could enter a new phase of sustained bullish momentum.
Following a week focused on gauging U.S. consumer spending strength, the upcoming holiday-shortened week (due to Independence Day) will shift attention to key employment and economic activity data.
On Tuesday, markets await the ISM Manufacturing PMI and the JOLTS job openings report. Wednesday will spotlight the ADP private employment report, and Thursday—one day earlier than usual due to the holiday—will see the release of several crucial figures, including the Non-Farm Payrolls (NFP), weekly jobless claims, and the ISM Services Index.
Currently, investor reaction to Donald Trump’s tariff commentary has been minimal. Market participants largely believe that any new tariffs would have limited inflationary effects and that significant retaliation from trade partners is unlikely.
Friday’s PCE report painted a complex picture of the U.S. economy. On one hand, inflation remains above ideal levels; on the other, household spending is showing signs of fatigue—a combination that presents challenges for policymakers.
Inflation-adjusted personal consumption fell by 0.3%, marking the first decline since the start of the year and indicating a gradual erosion of domestic demand. While wages continue to rise, their impact has been offset by declining overall income and reduced government support. To maintain their lifestyle, households have dipped into their savings, driving the personal savings rate down to 4.5%—its lowest level this year.
On the inflation front, the core PCE price index—the Fed’s preferred inflation gauge—rose 2.7% year-over-year, slightly above expectations. Monthly inflation also increased by 0.2%. Although these figures appear somewhat restrained, they remain above the Fed’s 2% target, with persistent price pressures in services—particularly non-housing services—still evident.
Altogether, the data suggest the U.S. economy faces a troubling divergence: weakening household income and consumption could slow growth, while sticky inflation in the services sector—especially under a potential Trump tariff scenario—could limit the Federal Reserve’s ability to cut interest rates.
NAS100 trade ideas
NAS100!Nasdaq is clearly in either the start or the end of a consolidation
The trend is still up.
Trade with care use a stop loss

Comprehensive Market Analysis: NAS100 Comprehensive Market Analysis: NAS100
1. Monthly Timeframe (The Long-Term "Big Picture")
Observation: The chart displays an incredibly powerful and long-standing uptrend. The price is consistently making higher highs and higher lows.
Candlestick Analysis: The most recent candles are strong, long-bodied bullish (green) candles. There are no significant bearish reversal patterns present whatsoever. This is a picture of strength.
Ichimoku Analysis: The price is trading far above the Kumo (Cloud), which is wide and bullish (green). The Tenkan-sen is far above the Kijun-sen, and the Chikou Span is in open space high above the price action from 26 periods ago. This is a textbook example of a very strong, healthy bull market.
Conclusion (Monthly): The long-term outlook is unequivocally Bullish.
2. Weekly Timeframe (The Dominant Trend)
Observation: The strength seen on the monthly chart is confirmed here. The trend is clearly defined and moving from the lower-left to the upper-right.
Heikin Ashi Interpretation: If we were to view this with Heikin Ashi, this chart would show a long sequence of green candles, with most of them having no lower wicks, which, according to your lesson, signifies a very strong and healthy uptrend.
Ichimoku Analysis: All five Ichimoku components are in perfect bullish alignment. The price is above the Tenkan-sen, which is above the Kijun-sen, and all are far above the Kumo. This confirms the trend is not only bullish but also has strong momentum.
Conclusion (Weekly): The dominant trend is Strongly Bullish.
3. Daily Timeframe (The Trading Trend)
Observation: The chart shows a clear uptrend. The most recent price action shows a slight pullback or pause after making a new high.
Candlestick Analysis: The last few candles are smaller and show some indecision (like Spinning Tops), which is very common after a strong upward move. This is more likely a "breather" or consolidation rather than a reversal. There are no major bearish reversal patterns like a Bearish Engulfing or Evening Star.
Ichimoku Analysis: The price is pulling back towards the Tenkan-sen, which is the first line of dynamic support. As long as the price holds above the Kijun-sen, the bullish trend is considered fully intact.
Conclusion (Daily): The trend is Bullish, currently in a minor pullback. The overall structure remains strong.
4. 4-Hour and 1-Hour Timeframes (The Intraday Trend)
Observation: These charts give a clearer view of the minor pullback seen on the daily chart. Here, the price action is moving sideways to slightly down.
Candlestick Analysis: We can see a few Long Upper Shadow candles near the recent top, which confirms the lesson that sellers stepped in to cause this short-term pause. However, there is no strong follow-through yet from the bears.
Ichimoku Analysis: On the 4H chart, the price is testing the Kijun-sen as support. This is a critical level. If it holds, the uptrend is likely to resume. If it breaks below, the correction could deepen, with the Kumo cloud being the next major support zone.
Conclusion (4H & 1H): The short-term momentum is corrective/sideways within a larger bullish trend.
5. Lower Timeframes (30M, 15M, 5M)
Observation: These charts show the corrective price action most clearly, appearing as a short-term downtrend.
Context is Key: Based on the overwhelming strength of the Monthly, Weekly, and Daily charts, this downtrend on the lower timeframes must be interpreted as counter-trend noise. It is a pullback, not a reversal of the major trend.
Harmonic Potential: This pullback could be forming the BC leg of a bullish ABCD pattern, or the AB leg of a bullish Gartley or Bat pattern, where traders would look for a buying opportunity at a key Fibonacci retracement level below.
Overall Synthesis and Final Conclusion
By performing a correct, top-down analysis of the NAS100 charts, the conclusion is the complete opposite of my previous mistaken analysis.
Long-Term (Monthly/Weekly): The market is in a powerful, secular bull market.
Medium-Term (Daily): The primary trend is up, but the market is taking a healthy and expected pause or pullback.
Short-Term (Intraday): The market is currently in a corrective phase.
Final Outlook: The multi-timeframe analysis is in strong alignment. The overwhelming evidence suggests that the primary trend for NAS100 is strongly Bullish. The current downward price action on the lower timeframes is very likely a temporary correction. Traders who align with the dominant trend would view this dip as a potential buying opportunity as the price approaches key support levels (like the Kijun-sen on the 4H/Daily chart), anticipating a resumption of the main uptrend.
For those interested in further developing their trading skills based on these types of analyses, consider exploring the mentoring program offered by Shunya Trade.
I welcome your feedback on this analysis, as it will inform and enhance my future work.
Regards,
Shunya Trade
⚠️ Disclaimer: This post is educational content and does not constitute investment advice, financial advice, or trading recommendations. The views expressed here are based on technical analysis and are shared solely for informational purposes. The stock market is subject to risks, including capital loss, and readers should exercise due diligence before investing. We do not take responsibility for decisions made based on this content. Consult a certified financial advisor for personalized guidance.

Upward momentum of Nasdaq has broken major resistanceUpward momentum of Nasdaq has broken major resistance.

NAS100 – Short from Premium Post-ATH Liquidity Sweep (27-06-25)
Buyside liquidity swept at 22,554.05 after fresh ATHs. Short triggered on a strong bearish news candle from premium territory. TP set at 22,423.99 near a Bright Gold HeatMap cluster. SL at 22,585.01 above structural highs. Trade thesis driven by Box Theory, liquidity targeting, and expected short-term correction from overextended highs.

Trade alert triggered! Tiqgpt setupAnalyzing the US Tech 100 CFD across multiple timeframes, we observe a consistent bullish momentum from the daily down to the 1-minute chart. The daily and 4-hour charts show a series of strong bullish candles, indicating a robust institutional buying presence. The 1-hour chart confirms this trend with a continuation of bullish candles, although there's a slight pullback visible, suggesting a temporary liquidity grab before further upward movement. The 15-minute charts show a more detailed view of this pullback, which appears to be a healthy correction within a broader bullish trend. The 1-minute chart shows increased volatility and some consolidation, typical of lower timeframes where retail traders are more active.
INSTITUTIONAL THESIS: Institutions are likely in a phase of accumulation and distribution, using pullbacks to gather more positions before pushing the price higher. The consistent higher highs and higher lows across timeframes suggest a strong bullish bias. The recent pullbacks on lower timeframes are likely temporary, serving to trap bearish retail traders before continuation of the uptrend.
LEARNING POINT: The pullback seen on the 1-hour and 15-minute charts can be interpreted as a liquidity grab, where institutions are likely stopping out weak bearish positions before continuing the bullish trend. This is a classic example of "stop hunt" before trend continuation.
SIGNAL: BUY SYMBOL: US Tech 100 CFD ENTRY PRICE: $22,500.0 STOP LOSS: $22,480.0 (Below the recent minor pullback on the 15-minute chart) TARGET PRICE: $22,600.0 (Just below the recent highs to ensure liquidity for exit) CONDITION: Buy limit order at $22,500.0 following a confirmed bullish reaction off the $22,500.0 level on the 15-minute chart RATIONALE:
Market Structure: Consistent higher highs and lows across all timeframes.
Order Flow: Institutional buying evident from large bullish candles.
Liquidity Behavior: Recent pullbacks likely represent liquidity grabs.
Pressure Analysis: Strong bullish candles indicate institutional pressure.
Strategies Used: Liquidity grab and continuation, intraday accumulation. URGENCY: MEDIUM TIMEFRAME: Short-term CONFIDENCE SCORE: 85% (Based on the clear bullish structure and institutional buying signs) **RISK/REWARD RATIO: Risk=$20.00, Reward=$100.00, Ratio=1:5.0
Risk = $22,500.0 - $22,480.0 = $20.0
Reward = $22,600.0 - $22,500.0 = $100.0
Ratio = $100.0 / $20.0 = 5.0

Nasdaq Analysis before market .If you do a top down analysis you will see /nq potentially working in the bulls favor. Especially if you own tech stocks. Its been steadily rising. with a couple hick-ups but look at the arrows on the 1 hour timeframe. The VWAP was showing a peak and than dropping. The chart soon to follow. Reversing. Yesterdays top and bottom were in line with an continuation and big $$$ taking profit,s than continued up the mountain.
Have a good day.

Nasdaq100OANDA:NAS100USD
3. And Then price will begin to push down strong. This will happen only if there will be a very strong spike meaning an incredible amount of sells pushing the price down.

Nasdaq-100 Wave Analysis – 26 June 2025- Nasdaq-100 broke major resistance level 22100.00
- Likely to rise to resistance level 23000.00
Nasdaq-100 index recently broke above the major resistance level 22100.00 (which has been steadily reversing the index from the end of 2024 as can be seen from the weekly NDX chart below).
The breakout of the resistance level 22100.00 continues the active primary impulse wave 3 from the middle of 2025.
With the accelerating weekly momentum, Nasdaq-100 index can be expected to rise to the next resistance level 23000.00.

US100 (NASDAQ 100 Index) – Breakout with Clear Upside ProjectionUS100 has broken out cleanly above the key resistance at 22,097.1, indicating bullish continuation. The breakout is supported by strong upward momentum, targeting the next key level around 23,441.9, as illustrated by the projected range.
Support at: 22,097.1 🔽 | 20,750.0 🔽
Resistance at: 23,441.9 🔼
🔎 Bias:
🔼 Bullish: Sustained price action above 22,097.1 keeps the bullish breakout valid, aiming toward 23,441.9.
🔽 Bearish: A drop back below 22,097.1 would invalidate the breakout, possibly pulling price toward 20,750.0.
📛 Disclaimer: This is not financial advice. Trade at your own risk.

US100 BULLISH BREAKOUT|LONG|
✅US100 is going up
Now and the index made a bullish
Breakout of the key horizontal
Level of 22,222 and the breakout
Is confirmed so we are bullish
Biased and we will be expecting
A further bullish move up
LONG🚀
✅Like and subscribe to never miss a new idea!✅
Disclosure: I am part of Trade Nation's Influencer program and receive a monthly fee for using their TradingView charts in my analysis.

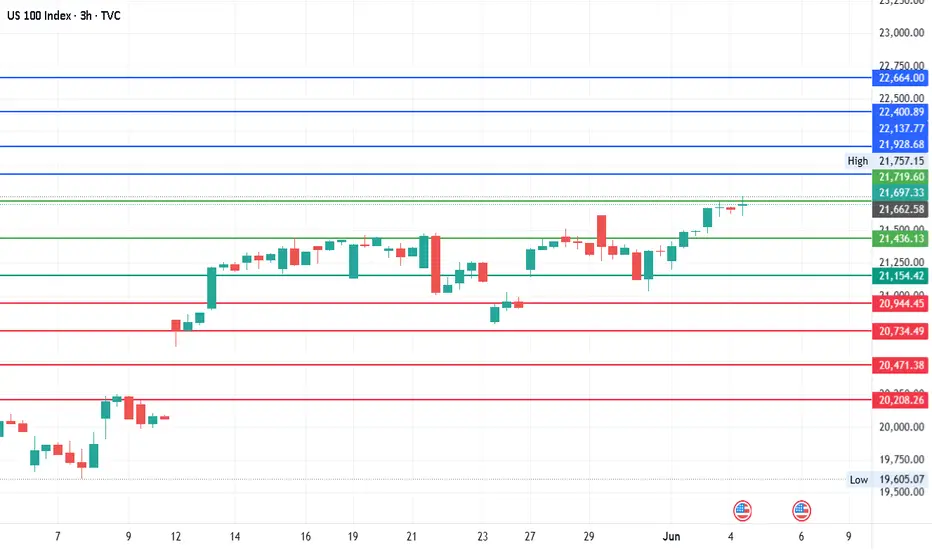
#NDQ - Pivot Point: 21,436.13Date: 30-05-2025
#NDQ Pivot Point: 21436.13 Support: 21154.42 Resistance: 21719.60
Upside Targets
Target 1: 21928.68
Target 2: 22137.77
Target 3: 22400.89
Target 4: 22664.00
Downside Targets:
Target 1: 20944.45
Target 2: 20734.49
Target 3: 20471.375
Target 4: 20208.26
US100 - Liquidity sweep above the ATHIntroduction
The US100 has been exhibiting a strong upward trend on the daily timeframe ever since the sharp correction in early April. This sustained bullish momentum culminated in a break above the previous all-time high (ATH) earlier today. However, this breakout may not be entirely convincing just yet, as there are signs of a potential short-term reversal. The move above the ATH could represent a liquidity sweep, where price action briefly pushes past a key level before retracing, possibly trapping late buyers.
Liquidity Sweep
On the daily chart, the US100 did succeed in breaching the previous ATH, but the breakout appears to have been short-lived. Price quickly reversed after the new high was printed, leaving behind only a wick above the ATH. This type of price action forms what is commonly referred to as a swing failure pattern, a scenario where the market tests liquidity above a key level before turning back down. Such a pattern often signals upcoming weakness, especially when the breakout lacks strong follow-through or volume support.
4H Fair Value Gap (FVG)
During the most recent leg up, the US100 left behind an unfilled fair value gap (FVG) on the 4-hour timeframe. This imbalance zone, created when price moves too quickly in one direction without enough time for buyers and sellers to match orders evenly, often acts as a magnet for price to return to. In the context of the current market structure, this 4H FVG could provide a meaningful support level if the index does experience a pullback. Should the index find support here and show signs of renewed buying interest, the broader uptrend is likely to continue. However, if this zone fails to hold, we may see a deeper retracement toward lower support levels.
Conclusion
While the US100 remains in a strong and well-defined uptrend on the higher timeframes, the recent price action above the ATH introduces the possibility of a short-term pullback. The appearance of a swing failure pattern and the presence of an untested 4H FVG suggest that some corrective movement could unfold in the near term. That said, the FVG presents a key area to watch for bullish continuation. If buyers step in at this imbalance zone, the index could resume its upward trajectory, reaffirming the strength of the current trend.
Disclosure: I am part of Trade Nation's Influencer program and receive a monthly fee for using their TradingView charts in my analysis.
Thanks for your support.
- Make sure to follow me so you don't miss out on the next analysis!
- Drop a like and leave a comment!


USNAS100 Eyes New ATH as Fed Rate Cut Bets &Ceasefire Fuel Rally USNAS100 OVERVIEW
Wall Street Gains as Rate Cut Hopes and Ceasefire Boost Sentiment
U.S. indices surged on Monday as growing expectations for a potential Federal Reserve rate cut in July helped offset market concerns over Middle East tensions.
The ceasefire agreement between Israel and Iran further eased geopolitical risk, supporting bullish momentum on Wall Street.
Forward Outlook:
A combination of dovish monetary policy expectations and geopolitical de-escalation continues to support upside potential in U.S. equities.
TECHNICAL OUTLOOK – (USNAS100)
The price has stabilized above 22,090, signaling strength and opening the path toward a new All-Time High (ATH) and beyond.
As long as the price holds above 22,090, the bullish trend remains in control.
A break and stabilization below 22,090 would suggest a bearish correction may be underway.
Resistance Levels: 22,210 → 22,280 → 22,460
Support Levels: 21,930 → 21,850

Nas100 ShortWe've seen Nasdaq consolidating to the upside for today we do have jobless claims and GDP coming up.
From a fundamental view there is some speculation that the GDP will come out significantly lower and therefore could possibly draw price down.
From a price action point of view we should see price drop to test our recent swing low.
Trade with caution and please do subscribe for more Setups

NQ Shorts Into Sellside Liquidity (26/06/2025)
Tracked this trade live as price swept buyside liquidity at 22,300.59, forming a potential short-formed M pattern. Watched for confirmation and waited patiently through a small bullish pullback, identifying potential trap behavior rather than true continuation.
Once a bearish market structure shift (MSS) occurred—confirmed by a body close below the prior wick low—I executed a short position, targeting the sellside liquidity shelf at 22,166.92, aligned with Asian session lows. Dimmed HeatMap clusters beneath suggested institutional interest, supporting a high-probability setup.
Trade thesis:
- Liquidity sweep at 22,300.59
- Rejection with fading momentum and wick absorption
- MSS confirmation with strong-bodied candle
- Dimmed clusters and multiple marked sellside levels below
Execution: Sniper short after MSS confirmation. Trade is live and managed with defined targets and narrative context. Let’s see how deep this bleed runs.

Nasdaq short on ltf Let us see if it manipulates the ny highs and reverses to the downside.
Trying out this short.

Nasdaq 100: A New All-Time HighNasdaq 100: A New All-Time High
As shown on the Nasdaq 100 chart (US Tech 100 mini on FXOpen), the value of the technology stock index has risen above its February peak, setting a new historical high.
Bullish sentiment may be supported by:
→ Easing concerns over potential US involvement in a Middle East war, as the ceasefire between Israel and Iran remains in effect.
→ Media reports suggesting that Donald Trump is considering replacing Federal Reserve Chair Jerome Powell by September or October, in an effort to influence a rate cut that could accelerate economic growth (though this also raises the risk of a new inflationary wave).
Technical Analysis of the Nasdaq 100 Chart
Price fluctuations in May and June have formed an ascending channel (highlighted in blue), with the following observations:
→ The decline (marked by red lines) appears to be an interim correction forming a bullish flag pattern;
→ The 22K level, which acted as resistance mid-month, was breached by a strong bullish impulse (indicated by the arrow) from the week's low.
This leaves the market vulnerable to a potential correction, which seems possible given:
→ Proximity to the upper boundary of the ascending channel;
→ Overbought conditions indicated by the RSI.
If the market corrects, a retest of the 22K level may happen.
This article represents the opinion of the Companies operating under the FXOpen brand only. It is not to be construed as an offer, solicitation, or recommendation with respect to products and services provided by the Companies operating under the FXOpen brand, nor is it to be considered financial advice.

NASDAQCurrent COT data supports a bullish bias on Nasdaq-100, indicating positive sentiment but with room for confirmation.
But also considering the S&P500 draging nasdaq to bearish like last week.

US100 - The NasDAQ_26_06_2025📈 US100 Trade Breakdown – Liquidity Grab + Bullish Continuation Potential 🚀
Caption for TradingView:
"Liquidity above equal highs has been taken ("EQL TAKEN") — classic stop hunt setup. Price then respected a bullish order block, forming a clean ascending structure off the green demand zone. If price holds above the black trendline, I’m expecting a bullish continuation. Next move? Either a retest of demand at 22,240–22,250 or continuation toward 22,400. Watch for reaction around the demand zone — that’s the key to the next leg."
🔍 Key Zones:
EQL Taken: Liquidity sweep above highs — signs of smart money movement.
Demand Zone (Green Block): Price launchpad; strong reaction confirms buyer interest.
HUGE LEVEL: Marked as structural support; price may revisit on pullback.
📌 Analysis:
Market structure is bullish (higher highs, higher lows).
Liquidity above recent highs has been collected — possible fuel for a deeper move.
If price fails to hold above the trendline, look for a break and retest setup toward the lower green zone.

Nasdaq - Will market discount from ResistanceNasdaq had a heavy plunge and pull. As per my projection, the stocks like apple, amazon, google, meta, nvidia heavily affects its price. The chart pattern shows strong resistance at 22.5K Price. Will market discount 20% this Fall 2025.
Lets watch ahead to know.

