UK100GBPThis index has been ranging for the past few weeks and it is testing the support zone at 8330.
Let us wait for it to break this zone, wait for a retest so that we can have a clear entry position.
UK100 trade ideas

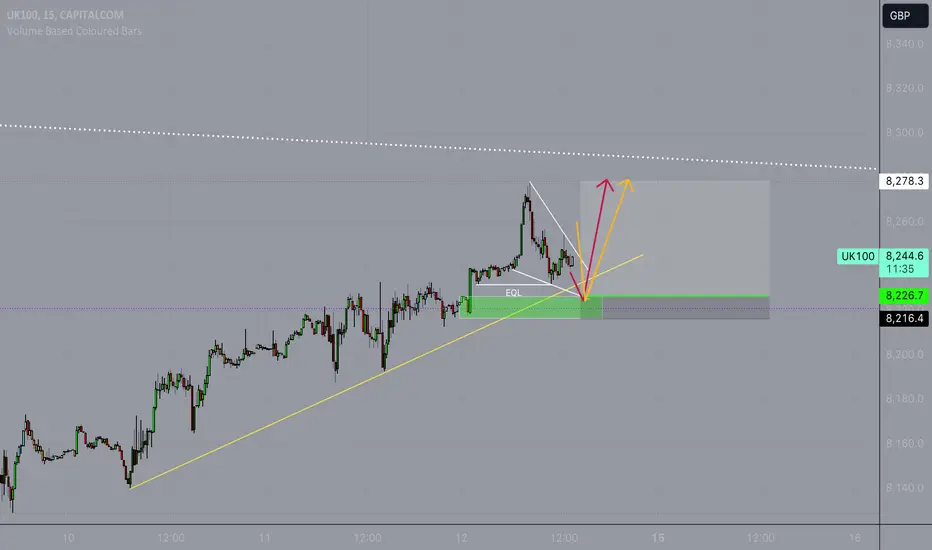
UK100UK100 right now in bullish trend, liquidity taken from support side and move upward, so we can take trade on fib levels.

FTSE - Technical Analysis - Bullish trendTechnical Analysis:
The price broke above the monthly open prompting me to anticipate for bullish setups.
From the W1 chart price is holding well above this zone thus raising the chances for quality bullish setups
During the coming days bullish with my targets at 8346.01, 8368.41 and 8390.82.
Please like or comment if you find this idea useful for your trading analysis
Thank you and good Luck

UK-----100------BullishTrend is respecting the trend line many times now after break of trend line and resistance with no divergence is expecting the trend moves bullish

FTSE 100 forms bullish signalThe FTSE is among a handful of major global indices signaling a rebound in the stock markets following this week's earlier selling pressure.
The UK benchmark index broke below a well-established support level around 8110 area on Thursday, before quickly recovering to rally into the close. The false breakdown marks a key reversal pattern and especially as the index ended up with a hammer candle on the daily chart, rising above the 21-day exponential moving average.
Today, the FTSE is rising above the trend line of its triangle continuation pattern to the upside. A close above it would be bullish. Yesterday's high at 8228 is now an important short-term support level that needs to hold.
By Fawad Razaqzada, market analyst at FOREX.com

UK100 POTENTIAL LONG OPPORTUNITYHello Everyone!
How are you all?
UK100 is an instrument to watch this week, because it is shaping up very nicely for a bullish move that we can capitalize on.
So, I will be looking for a bullish reversal because of the following reasons:
1. The overall trend is bullish.
2. The price has formed a bullish reversal structure.
3. The price is approaching the value area.
Game Plan:
If the price rejects at the VA and makes a bullish impulse followed by a 15mins flag with two highs and lows.
Entry : will look for a risk sell entry within the flag or a reduced risk entry on the breakout of the flag.

FTSE 100 Rectangular BreakThe FTSE 100 has made a break to the downside today of a long- standing Rectangular Consolidation (40 bars).
If the break holds, then we have a Bearish Continuation, and the gleaming target is the 200MAV below at 7935.

Weekly Analysis of UK100 Butterfly 🦋 the detail is shown in the above Idea.
I made this Idea based on Candlestick Analysis and Harmonic pattern using Fibonacci tools.
In the context of financial markets, the phrase " pull back to last golden level and flying UK100 butterfly to next golden level at 8320 " suggests a potential upward movement in the UK100 index, possibly after a period of consolidation or retracement.
Traders and investors may interpret this as a signal to anticipate a bullish momentum, aiming for a target level around 8320.
It highlights the importance of identifying key support and resistance levels, and the potential for significant price movements.
As with any market analysis, it's crucial to consider risk management strategies before making trading decisions at black circular region .

FTSE100 Looking BEARISHThe long term outlook for the FTSE100 is not looking good as it seems an ' ending diagonal ' or a ' leading diagonal ' has formed as shown in this weekly chart.
' A leading diagonal (or an ending diagonal) is typically followed by a deep retracement ' (Frost & Prechter ).
Also, ' the fifth wave of an ending diagonal often ends in a "throw-over" i.e., a brief break of the trendline connecting the end points of waves (1) and (3) '.
Therefore, it is highly likely that the FTSE100 will eventually retrace down to meet to the lower trendline shown in the chart at around the 6000 price level. A throw-over is also possible, whereby the upper trendline will momentarily be broken upwards prior to the move downwards. This is something to keep in mind if placing stops close to the high.
I hope you enjoyed this analysis and I welcome any comments / alternate views.

UK100 Extends Consolidation on Murky Monetary Policy OutlookUK100 has pulled back following its May record peak and has entered consolidation mode, as uncertainty around BoE’s policy path has taken hold. Although policymakers have pointed to a less restrictive stance ahead, there is no clarity around the timing of a pivot. The last inflation print did not help, as market pared back bets for a cut in August, since CPI persisted at 2% and the services component remained sticky.
This sustains risk for a breach of the pivotal 38.2% Fibonacci of this year’s rally, which would bring the 200Day EMA (blue line) in the spotlight, although deeper weakness does not look easy.
The central bank has hinted at lower rates ahead, price pressures have moderated and the economy exited its brief recession. Furthermore, the new government could usher in a much needed period of stability, while the change in listing rules cam reinvigorate the IPO market and boost sentiment.
UK100 has already defended the 38.2% Fibonacci multiple times, containing the correction to levels that reaffirm the upside potential. Bulls have the ability to reclaim 8,369 and eventually push for new all-time highs (8,488).
Stratos Markets Limited (www.fxcm.com):
CFDs are complex instruments and come with a high risk of losing money rapidly due to leverage. 68% of retail investor accounts lose money when trading CFDs with this provider. You should consider whether you understand how CFDs work and whether you can afford to take the high risk of losing your money.
Stratos Europe Ltd (trading as “FXCM” or “FXCM EU”), previously FXCM EU Ltd (www.fxcm.com):
CFDs are complex instruments and come with a high risk of losing money rapidly due to leverage. 73% of retail investor accounts lose money when trading CFDs with this provider. You should consider whether you understand how CFDs work and whether you can afford to take the high risk of losing your money.
Stratos Trading Pty. Limited (www.fxcm.com):
Trading FX/CFDs carries significant risks. FXCM AU (AFSL 309763). Please read the Financial Services Guide, Product Disclosure Statement, Target Market Determination and Terms of Business at www.fxcm.com
Stratos Global LLC (www.fxcm.com):
Losses can exceed deposits.
Any opinions, news, research, analyses, prices, other information, or links to third-party sites contained on this video are provided on an "as-is" basis, as general market commentary and do not constitute investment advice. The market commentary has not been prepared in accordance with legal requirements designed to promote the independence of investment research, and it is therefore not subject to any prohibition on dealing ahead of dissemination. Although this commentary is not produced by an independent source, FXCM takes all sufficient steps to eliminate or prevent any conflicts of interests arising out of the production and dissemination of this communication. The employees of FXCM commit to acting in the clients' best interests and represent their views without misleading, deceiving, or otherwise impairing the clients' ability to make informed investment decisions. For more information about the FXCM's internal organizational and administrative arrangements for the prevention of conflicts, please refer to the Firms' Managing Conflicts Policy. Please ensure that you read and understand our Full Disclaimer and Liability provision concerning the foregoing Information, which can be accessed via FXCM`s website:
Stratos Markets Limited clients please see: www.fxcm.com
Stratos Europe Ltd clients please see: www.fxcm.com
Stratos Trading Pty. Limited clients please see: www.fxcm.com
Stratos Global LLC clients please see: www.fxcm.com
Past Performance is not an indicator of future results.

Simple analysis on UK100Showing you just a simple analysis on buying a long position for UK100
Just find the breakout long candle for entry
Have a good week ahead

Layup trade in FTSE 100?The FT100 has formed a descending triangle over the past 53 days, with 14 showing the price settling into a small rectangle pattern. The rectangle pattern is my favourite setup, and both patterns are equally significant, making managing entries and stops easy.
A break below 8,110 suggests the stock could drop by 2.6% to 7,899, while a break above 8,284, the upper limit of the rectangle pattern, could lift the price to 8,462. We are looking for a breakout in either direction, ideally confirmed by movements in other stock indices.
This content is not directed to residents of the EU or UK. Any opinions, news, research, analyses, prices or other information contained on this website is provided as general market commentary and does not constitute investment advice. ThinkMarkets will not accept liability for any loss or damage including, without limitation, to any loss of profit which may arise directly or indirectly from use of or reliance on such information.

FTSE Short M15 and M30 Pattern
all timeframes are overbought
with the H4 and Daily trend
stop-loss of 50 pips


Took off for an ATH?After ranging for a few weeks, it seems it's accumulated enough liquidity to keep the momentum to create a new ATH.


UK100UK100 is trading in range bound with 150 pips range.
some time ranges are the best things to play just buy the support and sell the resistance.
as this one is 100 pips range which can deliver fine risk to reward.
currently the price is at support level and being rejected due to buying pressure.
will the pair head back to resistance area ?
what you guys think of this idea ?

Analysing the FTSE 100's Summer ConsolidationSince mid-May, the FTSE 100 index has been in a consolidation phase. In this analysis, we'll build a picture of this phase by sequentially adding technical indicators to the daily candle chart of the FTSE 100. While technical indicators can provide valuable insights, overloading a chart with too many can be overwhelming. We'll take a methodical approach to enhance clarity and understanding.
Horizontal Support and Resistance
Let’s start with the fundamentals of price action trading – horizontal support and resistance levels. For many traders, these levels are all that is needed to make informed decisions.
Even this minimalistic view of the FTSE provides valuable information about market price action. We can see that the market has started to establish an area of support in recent weeks. During the last month, the FTSE has formed four swing lows around a similar level.
Past performance is not a reliable indicator of future results
Price Pattern Observation
By mapping the recent series of swing highs and lows, we can see a wedge pattern starting to emerge. This wedge suggests that the market is being "funnelled" into an apex, a formation that often precedes significant trending moves.
Past performance is not a reliable indicator of future results
Anchored VWAP
Adding the volume-weighted average price (VWAP) anchored to the April swing lows, which preceded the last trend leg higher, we see that the FTSE is consolidating around the anchored VWAP. The VWAP is moving horizontally, indicating the market has reached a short-term equilibrium.
Past performance is not a reliable indicator of future results
Fibonacci Levels
Adding the 50% Fibonacci retracement of the recent trend from April to May, we find it aligns with the horizontal support levels formed over the last month. This adds depth to our market structure analysis.
Past performance is not a reliable indicator of future results
Volume
Finally, we add a volume histogram to our chart, which shows decreasing volumes in recent weeks – a common summer trend. A breakout above the wedge on rising volume may indicate the FTSE’s long-term uptrend is ready to resume.
Past performance is not a reliable indicator of future results
Disclaimer: This is for information and learning purposes only. The information provided does not constitute investment advice nor take into account the individual financial circumstances or objectives of any investor. Any information that may be provided relating to past performance is not a reliable indicator of future results or performance. Social media channels are not relevant for UK residents.
Spread bets and CFDs are complex instruments and come with a high risk of losing money rapidly due to leverage. 80.84% of retail investor accounts lose money when trading spread bets and CFDs with this provider. You should consider whether you understand how spread bets and CFDs work and whether you can afford to take the high risk of losing your money.

UK100 to find support at market price?UK100 - 24h expiry
Price action looks to be forming a bottom.
This is positive for short term sentiment and we look to set longs at good risk/reward levels for a further correction higher.
Dip buying offers good risk/reward.
We look for a temporary move lower.
Further upside is expected although we prefer to buy into dips close to the 8175 level.
We look to Buy at 8175 (stop at 8135)
Our profit targets will be 8275 and 8295
Resistance: 8480 / 8570 / 8720
Support: 8010 / 7870 / 7725
Risk Disclaimer
The trade ideas beyond this page are for informational purposes only and do not constitute investment advice or a solicitation to trade. This information is provided by Signal Centre, a third-party unaffiliated with OANDA, and is intended for general circulation only. OANDA does not guarantee the accuracy of this information and assumes no responsibilities for the information provided by the third party. The information does not take into account the specific investment objectives, financial situation, or particular needs of any particular person. You should take into account your specific investment objectives, financial situation, and particular needs before making a commitment to trade, including seeking advice from an independent financial adviser regarding the suitability of the investment, under a separate engagement, as you deem fit.
You accept that you assume all risks in independently viewing the contents and selecting a chosen strategy.
Where the research is distributed in Singapore to a person who is not an Accredited Investor, Expert Investor or an Institutional Investor, Oanda Asia Pacific Pte Ltd (“OAP“) accepts legal responsibility for the contents of the report to such persons only to the extent required by law. Singapore customers should contact OAP at 6579 8289 for matters arising from, or in connection with, the information/research distributed.

Heading into 50% Fibonacci resistance?UK100 is rising towards the pivot which acts as an overlap resistance and could reverse to the 1st support.
Pivot: 8,234.64
1st Support: 8,165.20
1st Resistance: 8,272.91
Risk Warning:
Trading Forex and CFDs carries a high level of risk to your capital and you should only trade with money you can afford to lose. Trading Forex and CFDs may not be suitable for all investors, so please ensure that you fully understand the risks involved and seek independent advice if necessary.
Disclaimer:
The above opinions given constitute general market commentary, and do not constitute the opinion or advice of IC Markets or any form of personal or investment advice.
Any opinions, news, research, analyses, prices, other information, or links to third-party sites contained on this website are provided on an "as-is" basis, are intended only to be informative, is not an advice nor a recommendation, nor research, or a record of our trading prices, or an offer of, or solicitation for a transaction in any financial instrument and thus should not be treated as such. The information provided does not involve any specific investment objectives, financial situation and needs of any specific person who may receive it. Please be aware, that past performance is not a reliable indicator of future performance and/or results. Past Performance or Forward-looking scenarios based upon the reasonable beliefs of the third-party provider are not a guarantee of future performance. Actual results may differ materially from those anticipated in forward-looking or past performance statements. IC Markets makes no representation or warranty and assumes no liability as to the accuracy or completeness of the information provided, nor any loss arising from any investment based on a recommendation, forecast or any information supplied by any third-party.
