Is the FTSE100 setting itself for a rally?Triple Bottom seems to be forming on FTSE100...
Could it be showing signs that it wants to rally for the rest of the year?
If so, we need to wait for the price to close above the neckline before acting.
Other indicaators also show it's too early, but things can change. So we'll keep our eyes peeled.
Price <200 (Bearish)
21>7 (Bearish)
RSI<50
Target 8,280
UK100 trade ideas

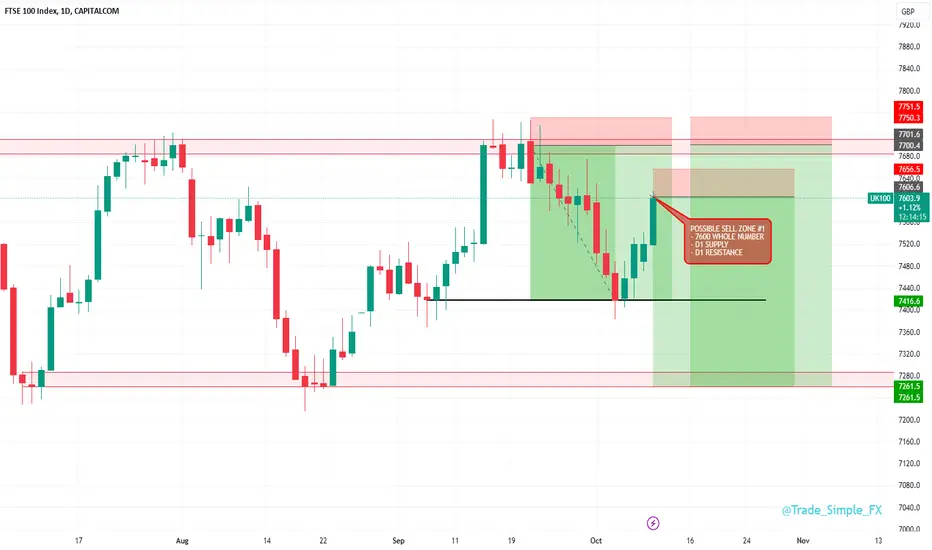
UK100 D1 - Short SetupUK100 D1
Little reluctant with stock indices for the moment, but certainly going to push a few forecasts out. 7600 sell zone looks attractive on the basis of this 7600 psychological price, daily resistance and daily supply price.
We could start to see rejections here, failing this, a break upside could lead us to 7700. Another attractive sell zone, which measures 9R from 7700 to 7260.
Has UK100 turned positive?UK100 - 24h expiry
There is no indication that the rally is coming to an end.
Further upside is expected.
Risk/Reward would be poor to call a buy from current levels.
A move through 7550 will confirm the bullish momentum.
The measured move target is 7650.
We look to Buy at 7500 (stop at 7450)
Our profit targets will be 7620 and 7650
Resistance: 7550 / 7600 / 7650
Support: 7525 / 7500 / 7450
Risk Disclaimer
The trade ideas beyond this page are for informational purposes only and do not constitute investment advice or a solicitation to trade. This information is provided by Signal Centre, a third-party unaffiliated with OANDA, and is intended for general circulation only. OANDA does not guarantee the accuracy of this information and assumes no responsibilities for the information provided by the third party. The information does not take into account the specific investment objectives, financial situation, or particular needs of any particular person. You should take into account your specific investment objectives, financial situation, and particular needs before making a commitment to trade, including seeking advice from an independent financial adviser regarding the suitability of the investment, under a separate engagement, as you deem fit.
You accept that you assume all risks in independently viewing the contents and selecting a chosen strategy.
Where the research is distributed in Singapore to a person who is not an Accredited Investor, Expert Investor or an Institutional Investor, Oanda Asia Pacific Pte Ltd (“OAP“) accepts legal responsibility for the contents of the report to such persons only to the extent required by law. Singapore customers should contact OAP at 6579 8289 for matters arising from, or in connection with, the information/research distributed.

FTSE Elliott Wave Analysis for Tuesday 10/10/2023The higher timeframe gives us two equally valid scenarios. On the lower timeframe, it looks like wave X is finished. However, as long as we see too much overlap in the upward move, we cannot exclude the secondary scenario. The secondary scenario calls for two more swings as a wave (b) and (c).

Will we see the FTSE fall today? The trend on FTSE has been down and there is a chance to sell this further.
There is a harmonic pattern and the H4 and D1 are pointing downwards.
The only worry is the H4 reversal at the bottom.

uk 100 ftse 100 index buy tradeThe RSI is above 50, indicating that the momentum is shifting to the bullish side. The stochastic oscillator is above 70, indicating that the index is overbought and may be due for a pullback. The MACD has crossed above its signal line, generating a bullish crossover signal. The CCI is above 100, indicating that the index is in a strong uptrend.
Moreover, the index has broken above its upper channel line and its 20-day moving average, which could act as support levels in case of a retracement.

FTSE Elliott Wave Analysis for Monday 09/10/2023 (+ Higher TF)The higher timeframe gives us two equally valid scenarios. On the lower timeframe, it looks like wave X is finished. However, as long as we see too much overlap in the upward move, we cannot exclude the secondary scenario. The secondary scenario calls for two more swings as a wave (b) and (c).

UK100 testing a key level UK100 is now testing, and has already rejected the resistance level it is currently at…. With the Friday news it soled but the general trend is down… Will this continue? I think so

FTSE100 Q4 23 and Q1 24 Support and resistance levelsA support and resistance diagram for the FTSE 100 provides a visual representation of key price levels where the index tends to find buying or selling pressure. This tool is widely used by traders and analysts to make informed decisions about their trading strategies. Here's an overview of what such a diagram may look like:
1. **Horizontal Lines**: A support and resistance diagram for the FTSE 100 typically includes horizontal lines at various price levels. These lines represent historical points where the index's price has either stalled (resistance) or rebounded (support).
2. **Support Levels**: Support levels are price points where the FTSE 100 tends to find buying interest. When the index approaches a support level, it often experiences a bounce or a slowdown in its downtrend. Traders often view these levels as potential buying opportunities.
3. **Resistance Levels**: Resistance levels are price points where the FTSE 100 tends to encounter selling pressure. When the index approaches a resistance level, it often struggles to move beyond that point. Traders consider these levels as potential selling opportunities.
4. **Trendlines**: In addition to horizontal lines, trendlines may also be included in the diagram. Trendlines connect the peaks (resistance) and troughs (support) in the FTSE 100's price movement, helping to visualize the prevailing trend.
5. **Historical Data**: The diagram may be plotted based on historical price data, which can be adjusted to reflect different timeframes (e.g., daily, weekly, monthly). The longer the timeframe, the more significant the support and resistance levels tend to be.
6. **Annotations**: Traders often add annotations to the diagram to provide context or highlight specific events or news that may have influenced the FTSE 100's price movements at certain levels.
7. **Volume Indicators**: Some traders incorporate volume indicators into their support and resistance diagrams. Volume can provide additional insights into the strength or weakness of support and resistance levels.
8. **Dynamic Levels**: In dynamic support and resistance diagrams, the lines may shift over time as new price data becomes available. This reflects the evolving nature of financial markets and allows traders to adapt their strategies accordingly.
9. **Psychological Levels**: Certain price levels, such as round numbers or key milestones (e.g., 10,000 points), can have psychological significance and may be included in the diagram as potential support or resistance levels.
10. **Trading Strategies**: Traders use these support and resistance levels to develop trading strategies. For example, a common strategy is to buy near support levels with a stop-loss just below the support, and sell near resistance levels with a stop-loss just above the resistance.
Overall, a support and resistance diagram for the FTSE 100 serves as a valuable tool for technical analysis and helps traders make informed decisions based on historical price behavior. However, it's important to note that these levels are not foolproof, and market conditions can change rapidly, so traders should use them in conjunction with other analysis methods and risk management strategies.

FTSE Elliott Wave Analysis for Friday 06/10/2023It looks like wave X is finished. However, as long as we see too much overlap in the move up, we cannot exclude the secondary scenario. The secondary scenario calls for two more swings as a wave (b) and (c).

UK100 - 05/10/23UK100
This has just bounced from the $7400 DEMAND zone created in SEPT, looks like it might come up to test the 50 EMA and I will be waiting for the reaction from there to trade it either way!

FTSE Elliott Wave Analysis for Thursday 05/10/2023It looks like wave X is finishing. We might be working on the final swing of the corrective move down.

UK100 to find buyers at market?UK100 - 24h expiry
Price action has continued to trend strongly lower and has stalled at the previous support near 7425.
We expect a reversal in this move.
Risk/Reward would be poor to call a buy from current levels.
A move through 7500 will confirm the bullish momentum.
The measured move target is 7600.
We look to Buy at 7420 (stop at 7360)
Our profit targets will be 7570 and 7600
Resistance: 7500 / 7550 / 7600
Support: 7450 / 7425 / 7400
Risk Disclaimer
The trade ideas beyond this page are for informational purposes only and do not constitute investment advice or a solicitation to trade. This information is provided by Signal Centre, a third-party unaffiliated with OANDA, and is intended for general circulation only. OANDA does not guarantee the accuracy of this information and assumes no responsibilities for the information provided by the third party. The information does not take into account the specific investment objectives, financial situation, or particular needs of any particular person. You should take into account your specific investment objectives, financial situation, and particular needs before making a commitment to trade, including seeking advice from an independent financial adviser regarding the suitability of the investment, under a separate engagement, as you deem fit.
You accept that you assume all risks in independently viewing the contents and selecting a chosen strategy.
Where the research is distributed in Singapore to a person who is not an Accredited Investor, Expert Investor or an Institutional Investor, Oanda Asia Pacific Pte Ltd (“OAP“) accepts legal responsibility for the contents of the report to such persons only to the extent required by law. Singapore customers should contact OAP at 6579 8289 for matters arising from, or in connection with, the information/research distributed.


FTSE Elliott Wave Analysis for Wednesday 04/10/2023It looks like wave W is finished and we can now see further downside as a wave X. It looks like wave X is missing two more swings to finish as a wxy structure.

FTSE 100 Index | SHORTING IDEA3 confiences:
1. 1H Trendline
2. Weekly Trendline
3. Daily Trendline
If we are on the shorting area then I post a new idea for looking a possible short.

FTSE Elliott Wave Analysis for Monday 02/10/2023 (+ Higher TF)For traders (lower timeframe):
It looks like wave W is finished and we can now see further downside as a wave X.
For investors (higher timeframe):
In the higher timeframe, investors should wait till the higher degree WXY correction is finished.

UK stock market index in monthly time frameConsecutive ceilings in the chart and lower ceilings in the indicator, which represent the negative divergence and further correction of the index of the stock market and the UK economy.

FTSE Elliott Wave Analysis for Friday 29/09/2023As forecasted we saw more upside in the FTSE. We now reached areas from where we can start to reverse. We are looking for exhaustion signs to end wave A.

UK100 H4 | Rising into 38.2% Fibo resistanceUK100 is rising towards an overlap resistance and could potentially reverse off this level to drop lower.
Sell entry is at 7647.16 which is an overlap resistance that aligns with the 38.2% Fibonacci retracement level.
Stop loss is at 7700.00 which is a level that sits above a Fibonacci confluence i.e. the 61.8% retracement and the 100.0% projection levels.
Take profit is between 7564.00 and 7551.55 which is a pullback support that aligns close to the 50.0% Fibonacci retracement level.
High Risk Investment Warning
Trading Forex/CFDs on margin carries a high level of risk and may not be suitable for all investors. Leverage can work against you.
Forex Capital Markets Limited (www.fxcm.com):
CFDs are complex instruments and come with a high risk of losing money rapidly due to leverage. 70% of retail investor accounts lose money when trading CFDs with this provider. You should consider whether you understand how CFDs work and whether you can afford to take the high risk of losing your money.
Stratos Europe Ltd, previously FXCM EU Ltd (www.fxcm.com):
CFDs are complex instruments and come with a high risk of losing money rapidly due to leverage. 74% of retail investor accounts lose money when trading CFDs with this provider. You should consider whether you understand how CFDs work and whether you can afford to take the high risk of losing your money.
FXCM Australia Pty. Limited (www.fxcm.com):
Trading FX/CFDs carries significant risks. FXCM AU (AFSL 309763), please read the Financial Services Guide, Product Disclosure Statement, Target Market Determination and Terms of Business at www.fxcm.com
Stratos Global LLC (www.fxcm.com):
Losses can exceed deposits.
Please be advised that the information presented on TradingView is provided to FXCM (‘Company’, ‘we’) by a third-party provider (‘TFA Global Pte Ltd’). Please be reminded that you are solely responsible for the trading decisions on your account. There is a very high degree of risk involved in trading. Any information and/or content is intended entirely for research, educational and informational purposes only and does not constitute investment or consultation advice or investment strategy. The information is not tailored to the investment needs of any specific person and therefore does not involve a consideration of any of the investment objectives, financial situation or needs of any viewer that may receive it. Kindly also note that past performance is not a reliable indicator of future results. Actual results may differ materially from those anticipated in forward-looking or past performance statements. We assume no liability as to the accuracy or completeness of any of the information and/or content provided herein and the Company cannot be held responsible for any omission, mistake nor for any loss or damage including without limitation to any loss of profit which may arise from reliance on any information supplied by TFA Global Pte Ltd.
The speaker(s) is neither an employee, agent nor representative of FXCM and is therefore acting independently. The opinions given are their own, constitute general market commentary, and do not constitute the opinion or advice of FXCM or any form of personal or investment advice. FXCM neither endorses nor guarantees offerings of third party speakers, nor is FXCM responsible for the content, veracity or opinions of third-party speakers, presenters or participants.

FTSE Elliott Wave Analysis for Thursday 28/09/2023As forecasted we saw more upside in the FTSE. We now reached areas from where we can start to reverse. We are looking for exhaustion signs to end wave A.

28 September 2023 - FTSE100 SellI was stalking a sell on the FTSE100 as it came up as a pair of high interest in my preparation for the day (covered in my market prep stream earlier today).
I have seen signs of the M15 buyers getting trapped, which has triggered the sell entry.

UK100-IN BEARISH TRENDUK100 is in a bearish trend and making a series of LLs and LHs, as the price gets rejected from resistance also with doubles with bearish divergence which adds confluences to our plan. what do you guys think about this? let me know.
