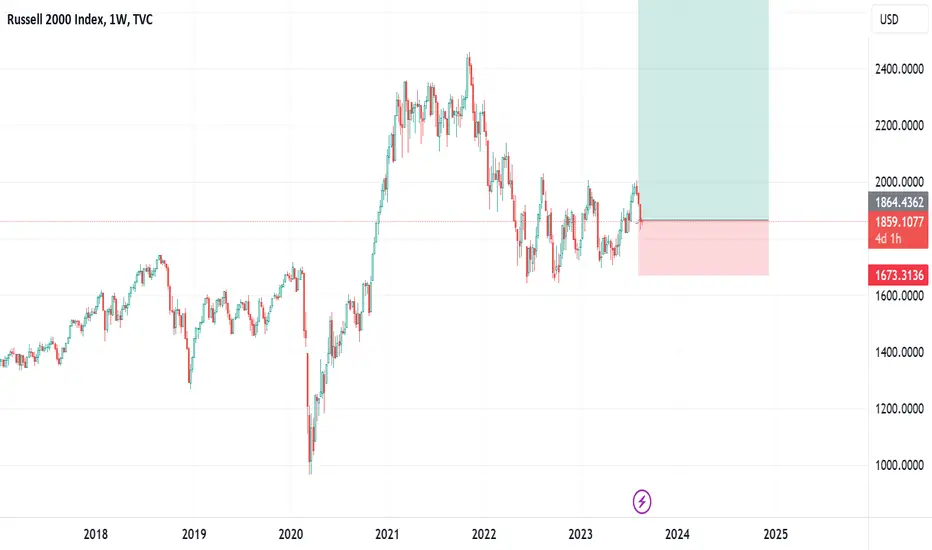
Small Caps Are Leading to the DownsideIndexes of big companies like the S&P 500 and Nasdaq-100 neared record highs in July, but not the small cap Russell 2000. Today we’ll use a weekly chart to consider how it’s leading to the downside.
The first pattern is the series of lower highs starting in August 2022. RUT unsuccessfully tested that area in January and again in July, which could suggest it’s become resistance.
The price action is noteworthy because SPX and NDX both cleared those respective levels from the summer of 2022. With relative strength already negative, will the weak get weaker?
Second, the 1650 area was resistance in late 2020. RUT bounced there in June 2022 and again last October. Traders may now view that level as a downside target.
Third, consider the macro environment. Some strategists have recently noted that small caps are more vulnerable to rising interest rates (unlike bigger companies that locked in long-term financing at lower rates). They’re also more associated with risk appetite because of their focus on industrials and financials. That could increase their difficulties if volatility increases further.
TradeStation has, for decades, advanced the trading industry, providing access to stocks, options, futures and cryptocurrencies. See our Overview for more.
Important Information
TradeStation Securities, Inc., TradeStation Crypto, Inc., and TradeStation Technologies, Inc. are each wholly owned subsidiaries of TradeStation Group, Inc., all operating, and providing products and services, under the TradeStation brand and trademark. TradeStation Crypto, Inc. offers to self-directed investors and traders cryptocurrency brokerage services. It is neither licensed with the SEC or the CFTC nor is it a Member of NFA. When applying for, or purchasing, accounts, subscriptions, products, and services, it is important that you know which company you will be dealing with. Please click here for further important information explaining what this means.
This content is for informational and educational purposes only. This is not a recommendation regarding any investment or investment strategy. Any opinions expressed herein are those of the author and do not represent the views or opinions of TradeStation or any of its affiliates.
Investing involves risks. Past performance, whether actual or indicated by historical tests of strategies, is no guarantee of future performance or success. There is a possibility that you may sustain a loss equal to or greater than your entire investment regardless of which asset class you trade (equities, options, futures, or digital assets); therefore, you should not invest or risk money that you cannot afford to lose. Before trading any asset class, first read the relevant risk disclosure statements on the Important Documents page, found here: www.tradestation.com .
US2000 trade ideas


Russell 2000 (RTY) Bearish Sequence Favors DownsideRusell (RTY) shows a 3 swing from July 31, 2023 high favoring further downside to reach equal legs target. It breaks below August 25 low confirming the idea. The drop from July 31 high is unfolding as a zig zag correction Elliott Wave structure. Down from July 31 high, wave A ended at 1832.80 and wave B corrective rally ended at 1934. Wave C lower is currently in progress as a 5 waves impulse structure. The Index has broken below wave A at 1832.8 confirming the next leg lower has started.
Down from wave B, wave ((i)) completed at 1849.40. A flat wave ((ii)) ended at 1892.70. The 1 hour chart below shows the wave ((ii)) starting point. Index then resumed lower in wave ((iii)) ending at 1780.40. Currently, the market is developing wave ((iv)); therefore, we expect a corrective rally in 3, 7 or 11 swing before it resumes to the downside in wave ((v)) of C. Near term, as far as pivot at 1892.84 high stays intact, expect rally to fail in 3, 7, or 11 swing for further downside. Potential target lower is 100% – 161.8% Fibonacci extension of wave A. This area comes at 1705 – 1749.

RTY RUT Russell2000I can see a cascading move lower in the small cap index over the coming months down to the 1500 area possibly by year end or early 2024.

US2000: Thoughts and AnalysisToday's focus: US2000
Pattern – Descending Triangle Pattern
Support – 1840
Resistance – 1870
Thanks for checking out today’s update. Today, we have run over US2000, breaking down the overall price picture, levels, and patterns and incorporating moving average and RSI into the analysis.
The Russel isn’t a market I normally watch or trade, but the descending triangle pattern did catch my eye today. Overall price sits in a range, but it has broken a trend on the inside and set up a LH. These patterns are normally seen as bearish after a trend break, but support looks rather firm at this stage.
With the FOMC coming up later this week, watch out for a false breakout lower that closes higher. This could set up a higher breakout. If sellers continue to push at support, look for a solid close-through support with a new failed rally that sets a new weekly low.
It’s going to be interesting to see which side gets the win here.
Have a great day and good trading.

Does history rythmes?2020-21 felt a lot like 99-00
1. Inflated valuations
2. Record high IPOs
3. Retail participation
Do we see the same cycle again?

WILL RUSSELL HOLD?We are witnessing the Russell 2000 index forming a classic Head and Shoulders.
If broken, the new short opportunities will emerge. Keep your eye on this index.
Stay tuned.
-Signalwyse Team

RUSSELL 2000, Trading Above Keylevel With Continuation Possible!Hello Traders Investors And Community, welcome to this analysis about one of the major stock market indices RUSSELL 2000, its 4-hour timeframe perspective, the recent price-action, the current formation and what to expect from the index the next times. Similarly to other preliminary indices the RUSSELL 2000 has recovered from its heavy corona breakdown seen this year but this does not mean the bear-market is overall over, in this case, all the main stock market indices begin to struggle with their uptrend growth and either consolidating or already building up downside potential, therefore, it is important to look at the facts and realistically measure what is possible in the next times and what is unlikely to do not get overwhelmed when things move into the reverse perspective, therefore I detected some important signals which will determine the further outcomes of this index.
When looking at my chart now you can watch there that the index formed a symmetrical triangle below the meaningful falling resistance marked in blue which formed by the all-time-high and the tops formed in last price-actions. This triangle has successfully confirmed to the upside and the index managed to closer above the important falling resistance line where it consolidates currently as you can watch it marked in my chart, this consolidation and breakout occurred are two decent bullish signals playing to the possibility that the index can continue with bullish rising to the upside when there do not come any bearish signs which invalidate this scenario again. Furthermore, the trading above the 60-EMA marked in cyan in my chart is supporting this scenario which will be confirmed properly when the index manages to break out of the consolidation and move on as it is shown in my chart.
Taking all these factors into consideration the index currently provides a more bullish than bearish outlook on the short-term, this is really important to note that the index has some potential in the short-term but it will run inevitably into resistance levels higher in the structure, this means a bearish reversal is not totally out of the sight as the uptrend begins to struggle and slowly don't this should not be kept by side. Also, the real economic situation is still providing a big divergence to the stock-market where real economy is damaged by corona and the stock market making almost exceptional growth to the upside where retail moves into the market while smart-money stays out of it this isn't a healthy environment where both factors real economy and stock-market growing together and therefore should not be ignored considering the next months and outcomes where the speculative rallies can reverse and lead to a shaky downside environment.
In this manner, thank you for watching, support for more market insight, have a great day, and all the best to you!
Information provided is only educational and should not be used to take action in the markets.

RUT Holding Critical Line All of the growth stocks have reached their lows. Unless the trendline is broken, buy growth companies such as NYSE:PLTR , BSE:UNITY , NASDAQ:PYPL , and NYSE:SNAP !!!!

RUSSELL is extremely disappointingThis index could not demonstrate any strength while the major ones almost fully recovered. I'll admit I got stuck in quite a few small cap positions and they don't seem to face a great coming half a year. After that I am expecting a huge rally.

Resistance testedwe had the resistance test in 1926. Pingo! the uptrend can be confirmed if the EMAs 50 cross over the 200 and the price stays above the 1900, where we can have a support test.

correction (short) made. continuation of the uptrend?After this surgical correction, lol, we will probably have a continuation of the uptrend until 1926 if the price sustains above EMA 200 (H4) and above 1900.

Russel 2000 is respecting the trendlineTVC:RUT touched the trend line and got a nice push. The price may sideline here a bit. If the push continues for SKILLING:NASDAQ , the money will start rotating to small caps back again.
Disclaimer – WhaleGambit. Please be reminded – you alone are responsible for your trading – both gains and losses. There is a very high degree of risk involved in trading. The technical analysis , like all indicators, strategies, columns, articles and other features accessible on/though this site is for informational purposes only and should not be construed as investment advice by you. Your use of the technical analysis , as would also your use of all mentioned indicators, strategies, columns, articles and all other features, is entirely at your own risk and it is your sole responsibility to evaluate the accuracy, completeness and usefulness (including suitability) of the information. You should assess the risk of any trade with your financial adviser and make your own independent decision(s) regarding any tradable products which may be the subject matter of the technical analysis or any of the said indicators, strategies, columns, articles and all other features.

Small correction (short)If the stock market continues to see the data announced this week as positive, a Russell correction to 1886 is possible to continue the long trend. the break of the EMA 200 can confirm and favor long positions, otherwise it will serve as resistance for the entry of the Bulls

Small caps Got a Little Bigger; Smaller Soon?!Russell 2k dumped 170 pips in August over a few weeks. Now we got retracement to the 0.382 Fibo.
Might squeeze up to the 0.50 Fibo. Start scaling in shorts in this zone imo.
Final leg down ought to be a measured move to ~1740 price zone. GLTA

US Stock: a classic Wyckoff formationWyckoff terminology makes it possible to understand this fascinating trading area. Although phase D has not yet arrived and the range is still building, the outlook is gloomy. It's a narrow probability with major results rather than a significant fundamental edge.
I tried to update the view monthly and briefly mentioned the cause and effect in the chart.

US stocks: a classic Wyckoff formationWyckoff terminology makes it possible to understand this fascinating trading area. Although phase D has not yet arrived and the range is still building, the outlook is gloomy. It's a narrow probability with major results rather than a significant fundamental edge.
I tried to update the view monthly and briefly mentioned the cause and effect in the chart.

RUSSEL 2000Hi everybody these 2000 small cap stocks ,,,,in my view still we are in downside motion and after it test the red trend line maybe we can just nibble that for tiny bounce......take all the risks into your account please.....
Good luck

Long RUT for a new possible new high.At this point I am not entirely convinced my overall bear thesis is correct. I am starting to think I may have been able to use a set of good signals to work out high probability resistance levels in 2021 which have produced good shorts but were ultimately pullback levels rather than top levels.
The big bear thesis has not failed yet. I do still think there's a risk of it. But at this point I'd put the odds 75/25 bull/bear over the next highly significant swing.
If this is happening, the lagging RUT (Which looks exactly like SPX did at 3900) is an excellent catch up trade.
Let's be clear ... I still think a major bear is coming. I just am considering the risk of it not coming for a while is too high to ignore.
Sooner or later a crash is coming and it may be spectacular (Babson) - but "Later" would be a big problem if over committed now.
RTY | RUSSEL 2000 | US2000 - BEARISHLooking at the Russel having a bearish correction after hitting the strong resistance zone.
Trade wisely and cautiously.
Trade at your own risk
This is a one month swing
***Always use proper risk management***

RUT Roadmap April 2023This one looks very appealing and high probability scenario into 4Q. Even B waves have similar extensions to the upside

LONG opportunity in Russel (RTY)Context:
Weekly - uptrend (UT)
Daily - downtrend (DT)
Last day:
Value moved down but left very poor and weak high
Special notes:
Daily RSI is in oversold. Price at DMA200 support
Conclusion:
A lot of selling in the last 10 days. Market is getting too short and needs to cover those shorts before moving further down. Last day indicates lack of strong sellers, which creates opportunity for short-term bull bounce. DMA200 provides logical support
Disclaimer
I don't give trading or investing advices, just sharing my thoughts

Bearish fib compression on the Russell 2000A nice bearish fibonacci compression is forming on the Russell 2000. We're currently at the optimal entry point.
The indicator can be found in my scripts.
Happy trading!
