US30 Breakout Alert: Is 43,100 the Next Stop?📈 US30 30M Chart Outlook – Breakout Potential Ahead
Technical Outlook — June 6, 2025
Current Market Condition:
US30 (Dow Jones Industrial Average) is currently consolidating on the 30-minute chart following a sharp rally, trading around 42,754.50 with a marginal dip of -0.01%. Price is hovering between a key intraday support zone at 42,737.31 and resistance at 42,900.00, creating a high-probability setup for a breakout in either direction.
Key Technical Highlights:
Price is trading above both the 50 EMA (blue line) and 200 MA (red line), with both lines converging — a typical precursor to an impulsive move.
A tight consolidation range has developed, with bulls and bears battling between 42,737.31 and 42,900.00.
The Stochastic Oscillator is hovering near the 40 level, suggesting neutral to slightly oversold conditions — an early sign that bulls might regain control.
A breakout above 42,900.00 could pave the way for a rally toward 43,100.00.
On the flip side, a breakdown below 42,737.31 may trigger a correction back to the 42,600.00 support zone.
Possible Scenarios:
🔼 Bullish Case:
A clean break and hold above 42,900.00, supported by rising momentum, could fuel a short-term rally toward the 43,100.00 resistance area. If bullish continuation persists, further upside expansion is possible.
🔽 Bearish Case:
Failure to break 42,900.00 followed by a bearish close below 42,737.31 may indicate rejection, opening the door for a retracement toward 42,600.00. Increased selling volume at that point could invite deeper pullbacks.
Important Note:
Be cautious of increased volatility from upcoming economic data or geopolitical catalysts. Watch closely how price behaves around 42,900.00 and 42,737.31 to catch the next directional move early.
If you found this analysis valuable, kindly consider boosting and following for more updates.
Disclaimer: This content is intended for educational purposes only and does not constitute financial advice.
US30 trade ideas

US30 Set to Break Records? Bulls Eyeing 46K–52K US30 Weekly Chart Outlook – Eyes on New Highs
Technical Outlook — June 6, 2025
Current Market Condition:
US30 (Dow Jones Industrial Average) is showing strong bullish momentum on the weekly chart after rebounding from the key 38,000–39,000 support zone. Price is now trading above the 50 EMA and maintaining distance from the 200 MA, indicating sustained strength in trend structure.
Key Technical Highlights:
Price bounced from the strong demand zone around 38,500.
Sustained recovery above EMA 50 (blue) and holding above short-term swing highs.
Weekly stochastic has crossed bullishly from oversold territory, supporting continued upward movement.
Price currently aims for retesting previous highs around 46,000.
If bullish momentum sustains, the next resistance levels are at 48,000 and 52,000.
Possible Scenarios:
🔸 Bullish Case:
If the current weekly structure holds and no major reversal signs appear, US30 could rally toward 46,000 in the coming weeks. A breakout above that could open the way to 48,000 and eventually 52,000.
🔸 Bearish Case:
Any strong rejection around 46,000 paired with a break back below 41,000 could expose the 38,000 support zone again.
Important Note:
NFP and major U.S. inflation data are due in the upcoming week. Watch out for volatility, especially near key resistance zones.
If you found this analysis valuable, kindly consider boosting and following for more updates.
Disclaimer: This content is intended for educational purposes only and does not constitute financial advice.

#US30 Buy 42493.6#US30 Buy 42493.6
SL 42433.6
TP 4251 3.6
TP 4259 3.6
TP 4273 3.6
Trade at your own risk
Protect your capital
The Wizard 🧙♂️ SWFX

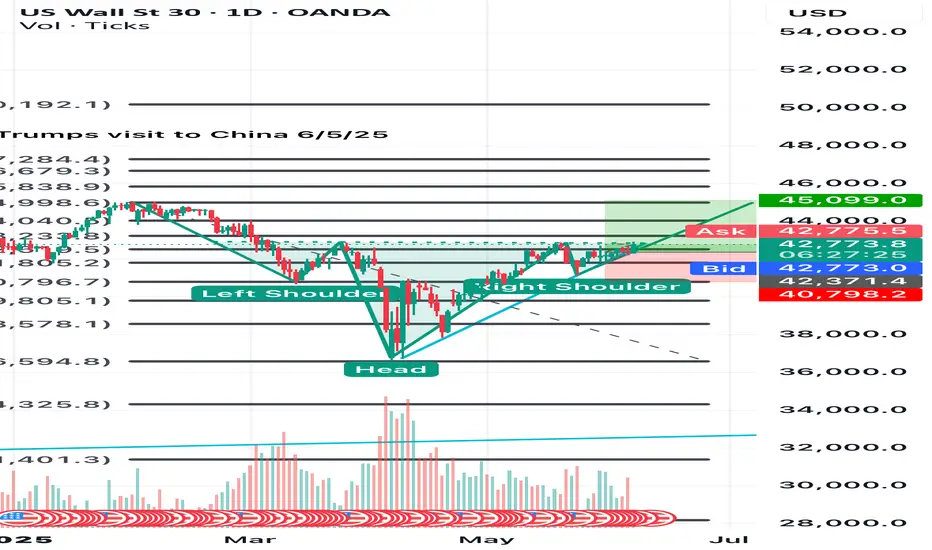
Potential H/S Forming US30 (Daily)Trump/Musk beef(fake???). Trump/Xi meeting went well yesterday. NFP/Hourly Earnings @1230.
Nice reject at resistance on US30. Tsla running up pre-market. Got a feeling today is going to be a day to remember. We’ll see if this inverted head and shoulders will withstand the hurdles and test of time.
#invertedheadandshoulders
#daytrading
#chartpatterntrading
#US30
#us30signals
Dow Jones eyes new highs after NFP surpriseNFP came in at 139k vs 130k expected. Unemployment steady. Bad data earlier this week had markets spooked:
* ISM Services: 49.9 vs 52.4 expected
* ISM and Fairclaim: 48.5 vs 49.5
* Jobless claims hit 2025 highs
But today’s jobs report calms the panic.
Dow Jones could still climb, with potential setups offering 2.2 to 5.3 risk-reward. Watch the video to learn more.
This content is not directed to residents of the EU or UK. Any opinions, news, research, analyses, prices or other information contained on this website is provided as general market commentary and does not constitute investment advice. ThinkMarkets will not accept liability for any loss or damage including, without limitation, to any loss of profit which may arise directly or indirectly from use of or reliance on such information.

US30: Target Is Up! Long!
My dear friends,
Today we will analyse US30 together☺️
The price is near a wide key level
and the pair is approaching a significant decision level of 42.596.9 Therefore, a strong bullish reaction here could determine the next move up.We will watch for a confirmation candle, and then target the next key level of 42.690.5. Recommend Stop-loss is beyond the current level.
❤️Sending you lots of Love and Hugs❤️

US30 Will Move Lower! Short!
Here is our detailed technical review for US30.
Time Frame: 12h
Current Trend: Bearish
Sentiment: Overbought (based on 7-period RSI)
Forecast: Bearish
The market is approaching a significant resistance area 42,464.8.
Due to the fact that we see a positive bearish reaction from the underlined area, I strongly believe that sellers will manage to push the price all the way down to 41,145.2 level.
P.S
The term oversold refers to a condition where an asset has traded lower in price and has the potential for a price bounce.
Overbought refers to market scenarios where the instrument is traded considerably higher than its fair value. Overvaluation is caused by market sentiments when there is positive news.
Disclosure: I am part of Trade Nation's Influencer program and receive a monthly fee for using their TradingView charts in my analysis.
Like and subscribe and comment my ideas if you enjoy them!

uptrendThe trend change is expected to form within the current support area and we will witness the start of an upward trend. A break of the resistance trend line will be a confirmation of the upward trend.
If the price breaks through the red support line, the downtrend is likely to continue.

US30 Trade Update – 06/06/2025 🚨 US30 Trade Update – 06/06/2025 🚨
📊 Market Structure & Key Levels
US30 is respecting higher support at 42,248, forming a tighter range just below 42,605 resistance. Price is hovering around 42,475, coiling up for a potential breakout. Watch closely! 🔍
✅ Key Observations:
Holding above 42,248 support
Resistance zones: 42,562 → 42,605
EMA structure bullish but stalling at highs
🎯 Trade Plan:
🔹 Long Setup:
Buy breakout above 42,605
→ Targets: 42,900 – 43,050+
🔻 Short Setup:
Breakdown below 42,248 → Confirm with 15m close
→ Targets: 41,947 – 41,894
⚠️ Price coiling under resistance – breakout incoming. Be patient, don’t chase!

US30 - Potential BuyHi traders,
We are looking to BUY CMCMARKETS:US30
Stay tuned :)
Price Action:
Short-term sell bias toward 41,700 zone based on lower high and projected weakness.
Watch reaction at 41,700—if buyers return strong with a new higher low, it resumes uptrend.
Invalidation: If price breaks above 42,800 with strength and closes above, sellers are overwhelmed—trend continues.
Good Luck :)
Study, Study, Study! Lorenzo Tarati

Us30Daily rejection to the downside h4 rejection and h1 rejection this might be a potential huge bearish reversal

SELLING US30 ON RETEST OF PREVIOUS SUPPORTBasic trading. It is what it is. Trade what you see. Selling to previous low

US30 at NYSE created support.US30 at NYSE created support.
NYSE OPEN. Price creating support and waiting for confirmation (candle close) so I can buy for 400pips.


SHORT ON US30US30 Has given us a change of character to the downside with a nice retest creating a lower high.
I will be selling us30 to the next demand zone looking to catch 500-1000 points.

Major US30 sell setup 5 June 2025We chOch on H4 had a major pullback then shifted structure on the extreme supply
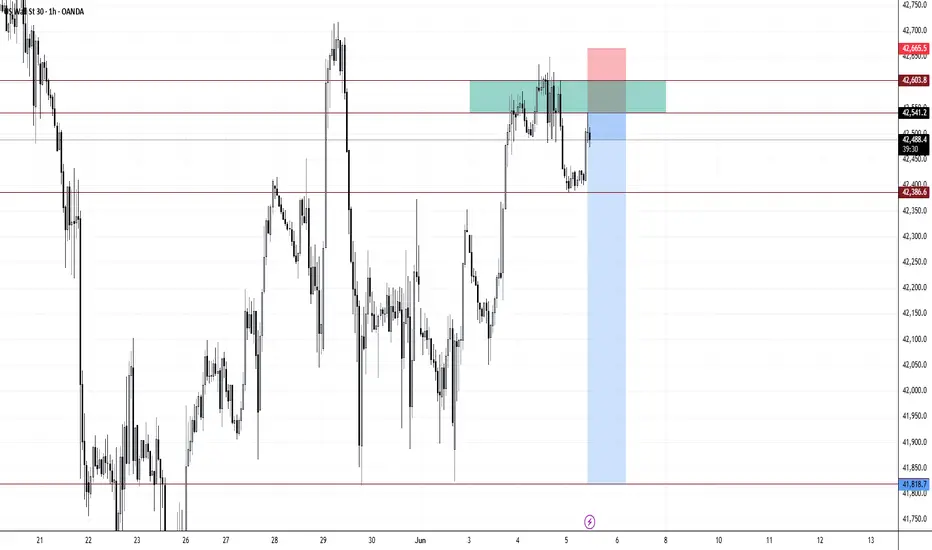
US30 Trade Update – 06/05/2025🚨 US30 Trade Update – 06/05/2025 🚨
📊 Market Structure & Key Levels
US30 continues to respect bullish structure, trading above the 42,400 zone and reclaiming strength after consolidating around key support levels. Buyers are holding control with price now at 42,480+.
🔍 Key Observations:
✅ Still holding above 41,947 structure zone
✅ Higher lows intact – bullish continuation likely
🔼 Resistance in focus: 42,700 → 42,900
🎯 Trade Plan:
🔹 Long Setup:
Buy on pullbacks to 42,300–42,400
→ Target: 42,700 – 42,900
🔻 Short Setup:
Only valid on break & close below 41,947
→ Target: 41,261 – 40,983
⚠️ Trend remains bullish – follow momentum but watch for exhaustion near resistance!


US30 I Bearish Reversal Based on the M30 chart, the price is rising toward our sell entry level at 42,481.32, a pullback resistance that aligns with the 38.2% Fib retracement.
Our take profit is set at 42,326.96, a pullback support that aligns closely with the 50% Fib retracement.
The stop loss is set at 42,646.90, a swing high resistance.
High Risk Investment Warning
Trading Forex/CFDs on margin carries a high level of risk and may not be suitable for all investors. Leverage can work against you.
Stratos Markets Limited (tradu.com ):
CFDs are complex instruments and come with a high risk of losing money rapidly due to leverage. 63% of retail investor accounts lose money when trading CFDs with this provider. You should consider whether you understand how CFDs work and whether you can afford to take the high risk of losing your money.
Stratos Europe Ltd (tradu.com ):
CFDs are complex instruments and come with a high risk of losing money rapidly due to leverage. 63% of retail investor accounts lose money when trading CFDs with this provider. You should consider whether you understand how CFDs work and whether you can afford to take the high risk of losing your money.
Stratos Global LLC (tradu.com ):
Losses can exceed deposits.
Please be advised that the information presented on TradingView is provided to Tradu (‘Company’, ‘we’) by a third-party provider (‘TFA Global Pte Ltd’). Please be reminded that you are solely responsible for the trading decisions on your account. There is a very high degree of risk involved in trading. Any information and/or content is intended entirely for research, educational and informational purposes only and does not constitute investment or consultation advice or investment strategy. The information is not tailored to the investment needs of any specific person and therefore does not involve a consideration of any of the investment objectives, financial situation or needs of any viewer that may receive it. Kindly also note that past performance is not a reliable indicator of future results. Actual results may differ materially from those anticipated in forward-looking or past performance statements. We assume no liability as to the accuracy or completeness of any of the information and/or content provided herein and the Company cannot be held responsible for any omission, mistake nor for any loss or damage including without limitation to any loss of profit which may arise from reliance on any information supplied by TFA Global Pte Ltd.
The speaker(s) is neither an employee, agent nor representative of Tradu and is therefore acting independently. The opinions given are their own, constitute general market commentary, and do not constitute the opinion or advice of Tradu or any form of personal or investment advice. Tradu neither endorses nor guarantees offerings of third-party speakers, nor is Tradu responsible for the content, veracity or opinions of third-party speakers, presenters or participants.

US30 WILL FALL|SHORT|
✅DOW JONES is going up now
But a strong resistance level is ahead at 42,800
Thus I am expecting a pullback
And a move down towards the target of 42,241
SHORT🔥
✅Like and subscribe to never miss a new idea!✅
Disclosure: I am part of Trade Nation's Influencer program and receive a monthly fee for using their TradingView charts in my analysis.

M2 FractalFriends... MSTR, BTC and DJI are all tracking M2 beautifully. Should this fractal continue to prove as reliable, we should see big moves in the coming weeks. Limit you exposure to leverage, it's just not worth it! Stay in MSTR stock and BTC spot.

NFP Setups: Dow Breakout or USDJPY Breakdown?Big moves ahead? Friday’s Non-Farm Payrolls could be the trigger. ADP came in weak, jobless claims spiked, and ISM data disappointed. Now all eyes are on the Dow Jones and USDJPY. A strong NFP could send the Dow to new highs, while a weak one may sink USDJPY toward the 2025 low.
Watch the full breakdown and share your take in the comments.
This content is not directed to residents of the EU or UK. Any opinions, news, research, analyses, prices or other information contained on this website is provided as general market commentary and does not constitute investment advice. ThinkMarkets will not accept liability for any loss or damage including, without limitation, to any loss of profit which may arise directly or indirectly from use of or reliance on such information.
