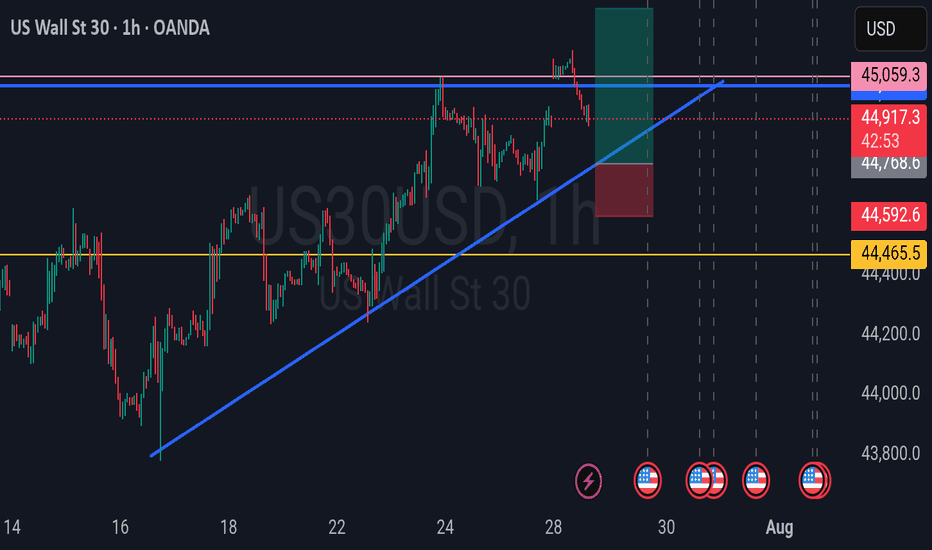
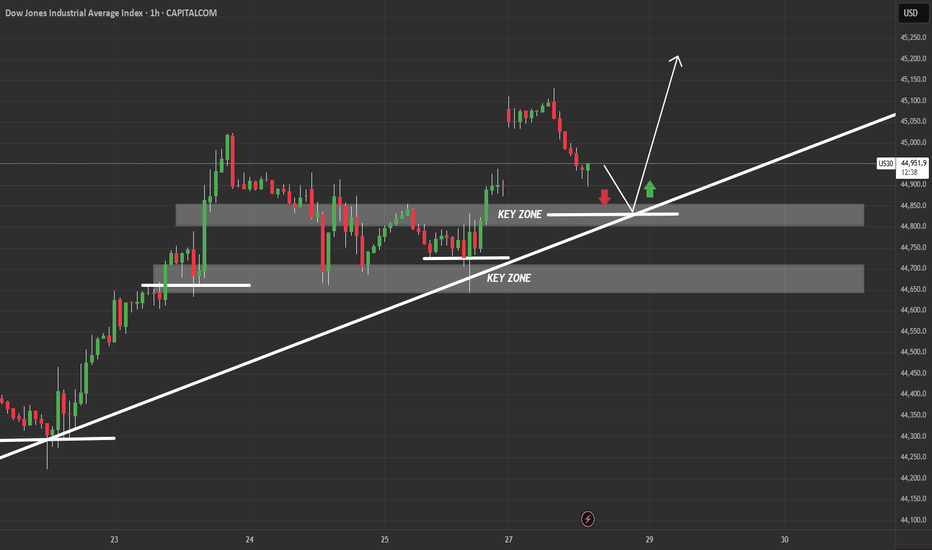
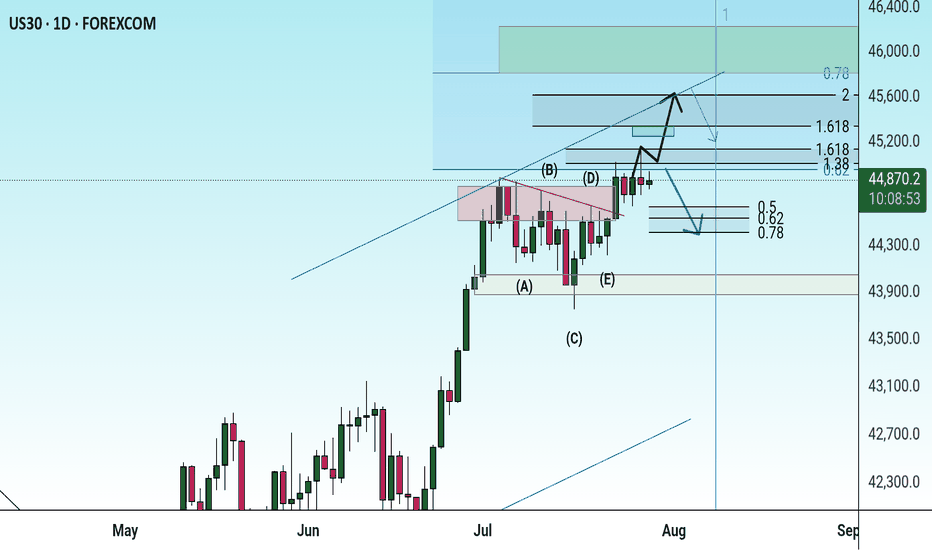
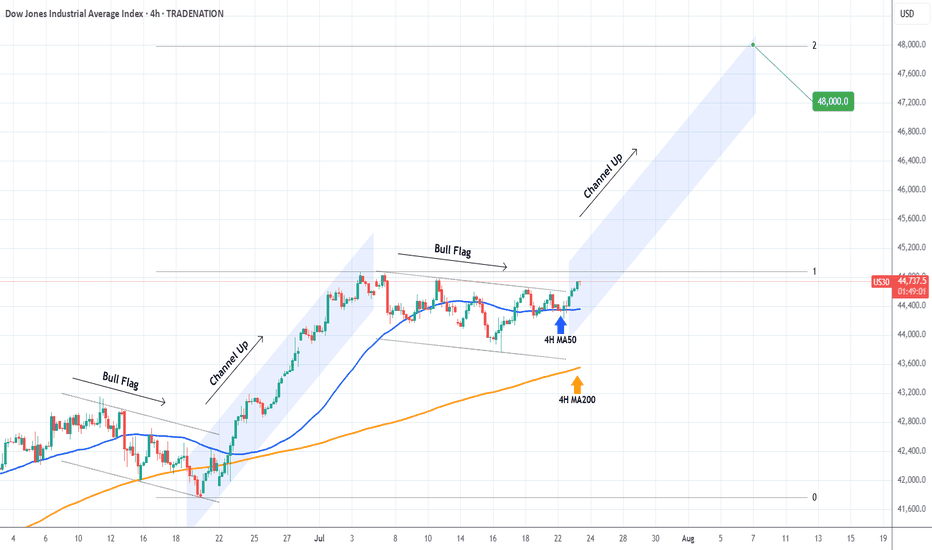
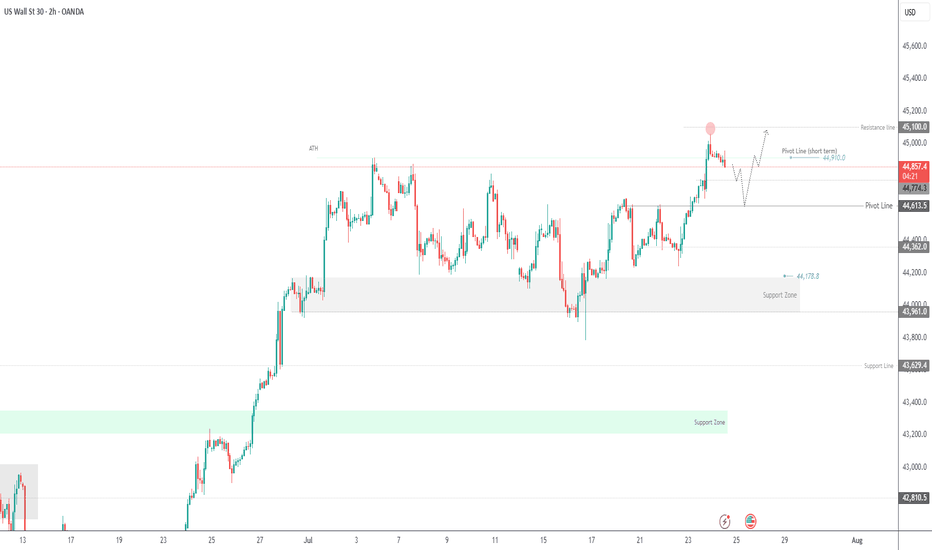
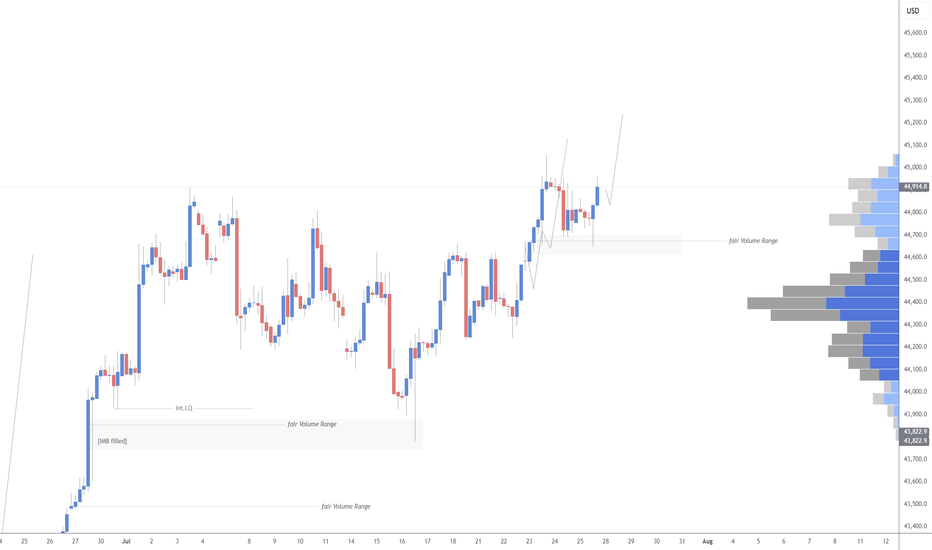
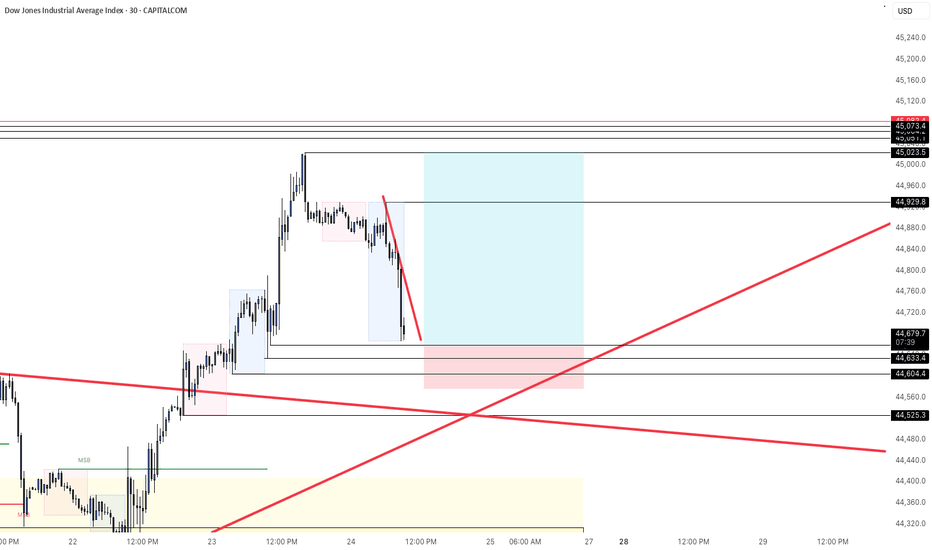
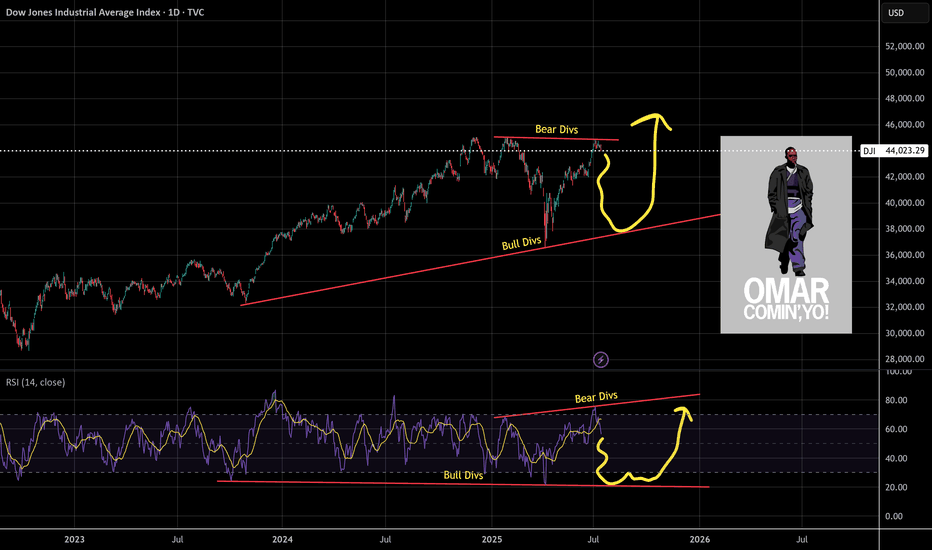
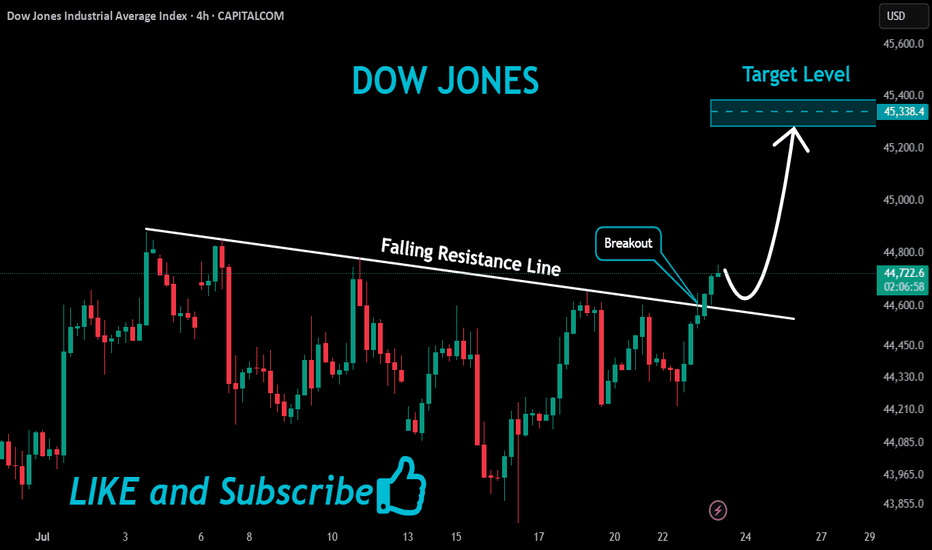
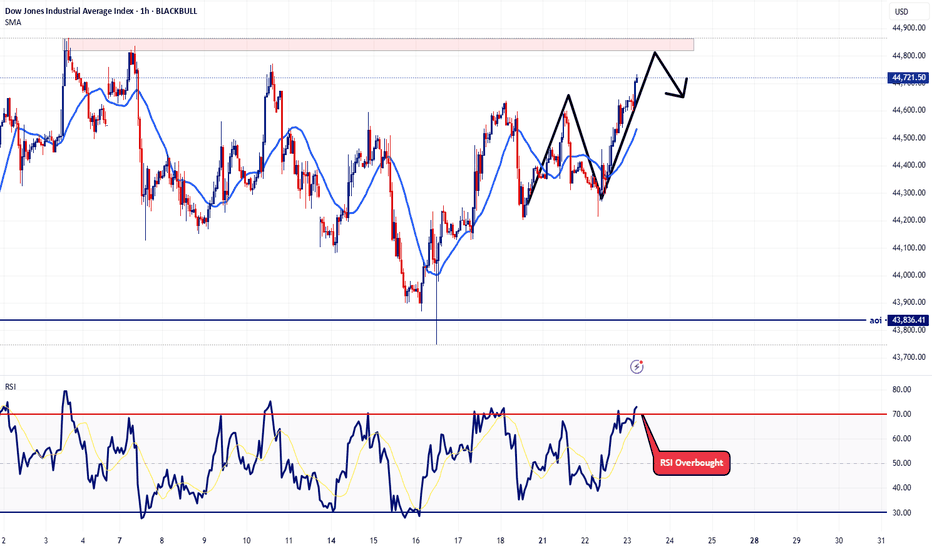
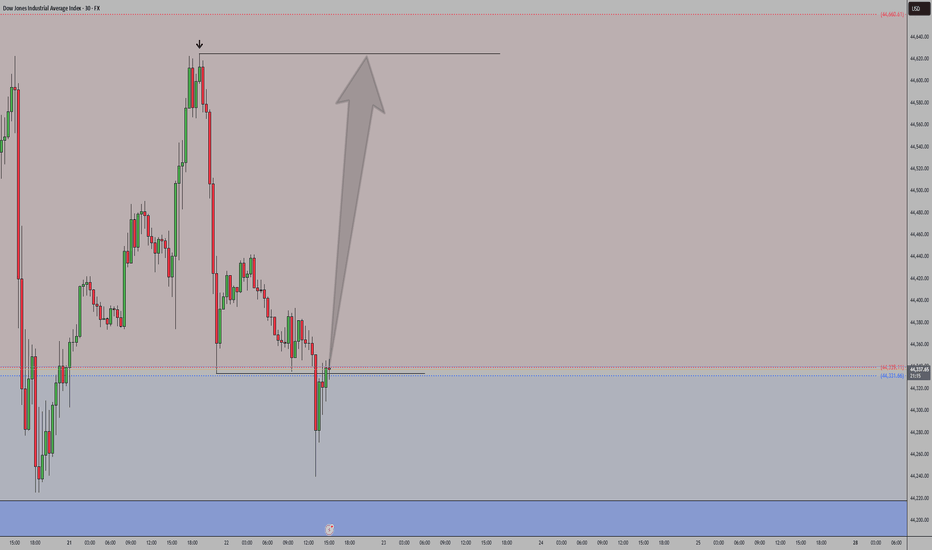
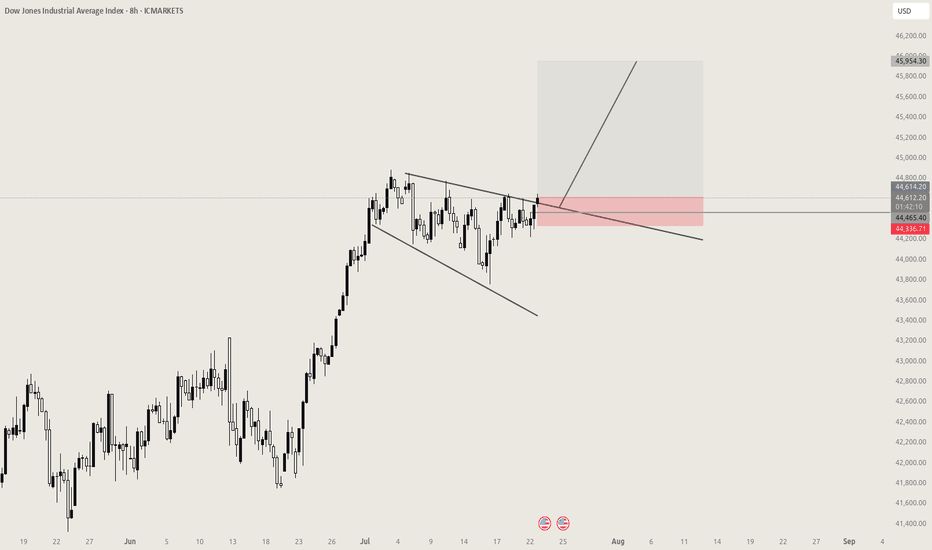
Dow Jones ChannelEverything seems ready for the climb. On the one-hour timeframe, the 200 MA and the channel floor are ready to support the price, and a great rally is likely in store for the Dow Jones. Longby habinator3
US30 Sells Idea for the New York SessionUnless we see some news come out on tariffs, we could see some downside on US30 today. It is falling inside a wedge pattern right now, and I expect the price action to fall within that wedge with a potential to go down during the New York session. I will be waiting for a break of the upper green zone (around 42150), then a pullback and rejection, to take sells down towards the 42000 (and possibly lower) areas. I am not looking for any buys on US30 today, unless I see some really big green candles towards the upside during the 9:30 am EST.Shortby CandleStickGuruUpdated 4
Moustafa! My analysis and view for US 30! on 16.03.2025!- I expected a huge bearish wave would hit the index by end of December and also in January and I sat an idea for it and it was right and that is the new idea - On the weekly frame, you would notice that the index is in a rising channel - Formed a double top pattern and even broke the neckline of it and is supposed to go to minimum the Take profit 2 then after the retrace towards the take profit 3 - The index retraced to the upside due to the uptrend line in green and there is a possibility that it could continue the bullish run but I do not expect here that a weekly candle would close above the neckline before reaching to the below TPs - The lower weekly candles wicks from 15.04.2024 and 05.08.2024 must be filled anyway, which is giving another confirmation to the validation of this idea concept and the continuation of the bearish wave on the weekly chart! we could see on the way some retracements on the daily frame and the lower frames, but that will not have any influence on the bigger bearish image! - The index had broken already the uptrend line (in red) which was not broken from October 2023! and the last week candle closed under the moving average 50! - By reaching to the TP3, means that the index would go to the lower line of the rising channel -- Conclusion is that we are in a bearish market on the weekly chart and the real target is exactly when the index will reach to the line (in yellow) I sat also another idea for Nasdaq which I see also there the continuation of the big bearish wave on the weekly chart! so feel free to have a look on too! so all is going in harmony together! Shortby moustafa_mareiUpdated 1112
DJIA H4 | Potential bullish bounceDJIA (US30) is falling towards a multi-swing-low support and could potentially bounce off this level to climb higher. Buy entry is at 41,282.01 which is a multi-swing-low support that aligns close to the 78.6% Fibonacci retracement. Stop loss is at 41,080.00 which is a level that lies underneath a multi-swing-low support and the 78.6% Fibonacci retracement. Take profit is at 42,240.15 which is an overlap resistance that aligns with the 61.8% Fibonacci retracement. High Risk Investment Warning Trading Forex/CFDs on margin carries a high level of risk and may not be suitable for all investors. Leverage can work against you. Stratos Markets Limited (www.fxcm.com): CFDs are complex instruments and come with a high risk of losing money rapidly due to leverage. 63% of retail investor accounts lose money when trading CFDs with this provider. You should consider whether you understand how CFDs work and whether you can afford to take the high risk of losing your money. Stratos Europe Ltd (www.fxcm.com): CFDs are complex instruments and come with a high risk of losing money rapidly due to leverage. 63% of retail investor accounts lose money when trading CFDs with this provider. You should consider whether you understand how CFDs work and whether you can afford to take the high risk of losing your money. Stratos Trading Pty. Limited (www.fxcm.com): Trading FX/CFDs carries significant risks. FXCM AU (AFSL 309763), please read the Financial Services Guide, Product Disclosure Statement, Target Market Determination and Terms of Business at www.fxcm.com Stratos Global LLC (www.fxcm.com): Losses can exceed deposits. Please be advised that the information presented on TradingView is provided to FXCM (‘Company’, ‘we’) by a third-party provider (‘TFA Global Pte Ltd’). Please be reminded that you are solely responsible for the trading decisions on your account. There is a very high degree of risk involved in trading. Any information and/or content is intended entirely for research, educational and informational purposes only and does not constitute investment or consultation advice or investment strategy. The information is not tailored to the investment needs of any specific person and therefore does not involve a consideration of any of the investment objectives, financial situation or needs of any viewer that may receive it. Kindly also note that past performance is not a reliable indicator of future results. Actual results may differ materially from those anticipated in forward-looking or past performance statements. We assume no liability as to the accuracy or completeness of any of the information and/or content provided herein and the Company cannot be held responsible for any omission, mistake nor for any loss or damage including without limitation to any loss of profit which may arise from reliance on any information supplied by TFA Global Pte Ltd. The speaker(s) is neither an employee, agent nor representative of FXCM and is therefore acting independently. The opinions given are their own, constitute general market commentary, and do not constitute the opinion or advice of FXCM or any form of personal or investment advice. FXCM neither endorses nor guarantees offerings of third-party speakers, nor is FXCM responsible for the content, veracity or opinions of third-party speakers, presenters or participants.Long03:05by FXCM3
US30 Trade Outlook – 31/03/2025🚨 US30 Trade Outlook – 31/03/2025 🚨 📊 Market Structure & Key Levels US30 is currently consolidating after a steep selloff from the 42,800s. Price is sitting near short-term support at 41,434, but momentum remains bearish unless bulls step in fast. 🔍 Key Observations: 🔻 Strong Bearish Momentum – Sharp drop from resistance zones 🔹 Support Holding (for now): 41,400 🔻 Breakdown Risk: Below 41,400 opens the door toward 40,678 🎯 Trade Plan: 🔻 Short if 41,400 fails → Target 40,678 🔹 Long only if price reclaims 41,800+ and EMAs flip bullish ⚠️ Wait for clean confirmations – no chasing moves. by h4rVey1
i will go short on DOW for short term...im in buy long term!!!we can sell dow now in short term...trade wid sl and tp guys...do not forget to use money management...trade safe and wellShortby omidtrader1367Updated 4
US30 Scalping Ideas for NYSE open todaySince the NYSE brings a lot of volume, we can look for both buy and sell ideas depending on how the candles behave. I will wait for the first 5-minute candle after the NYSE open to plan my trade. Higher timeframes (weekly, 4H, and the hourly) all look bearish except for the bullish close yesterday, so my bias is still bearish. Unless we see some tariff related good news or any other fundamental news release, the continuation most likely can be towards the downside. Happy trading!Shortby CandleStickGuruUpdated 3
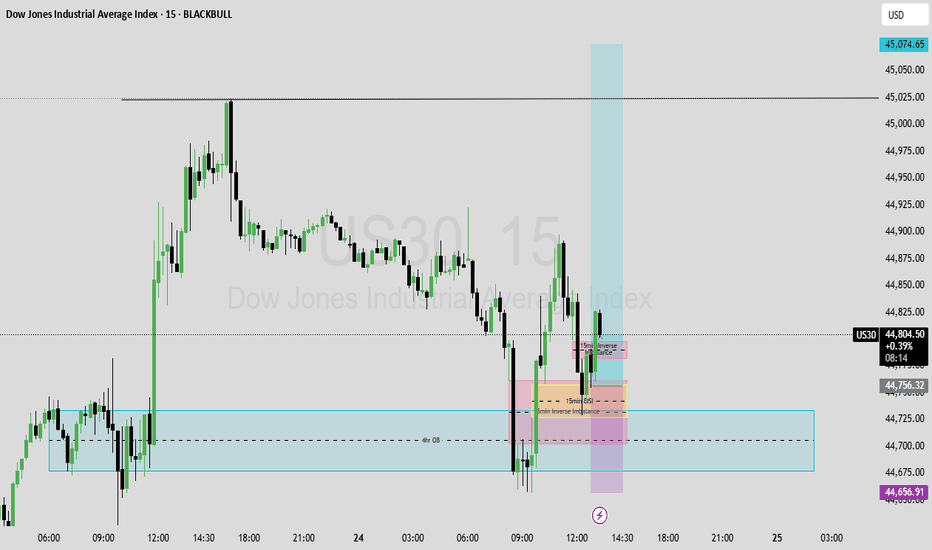
Sell idea 15m timeframeWaiting for it to fill in the fair value gap then take sells for the rest of the day Shortby neonx52332
Hanzo | US30 15 min Breaks – Confirm the Next Move(🆚) US30 – The Way of the Silent Blade 🔥 Bullish Break Out Path – 42680 🩸Liquidity Sweep – Institutions grab liquidity before pushing higher. 🩸CHoCH – Trend shift confirmation. 🩸Key Level Retest – Strong breakout zone. 🩸Weekly/Monthly Zone – Institutional accumulation. 👌 Entry: Break 42680 + volume → Retest → Long position → Secure profits. 🔥 Bearish Break Out Path – 42480 🩸Liquidity Sweep – Stop-clearing before reversal. 🩸CHoCH – Bearish trend confirmation. 🩸Key Level Retest – Historical reaction zone. 🩸Weekly/Monthly Zone – High-probability sell area. 👌 Entry: Break 42480 + momentum → Retest → Short position → Target lower liquidity. ☄️ Trading Insights: 💯 Liquidity moves the market. ✈️ Volume confirms breakouts. 👍 Precision wins—no hesitation.by Path_Of_HanzoUpdated 6
Trade Idea: US30 Long ( BUY LIMIT )1. Technical Analysis Breakdown: Daily Chart: • Trend: Bullish overall, but showing signs of pullback. • MACD: Bearish, indicating weakening momentum. • RSI: At 45.23 — neutral but leaning toward oversold territory. • Support level: Around 41,500. • Resistance level: Recent high near 42,890. 15-Min Chart: • Trend: Strong intraday upward momentum. • MACD: Bullish crossover with momentum building. • RSI: 69.09 — nearing overbought but still has room. • Support: Around 41,760. • Resistance: 42,208 (current price), next major level at 42,500. 3-Min Chart: • Trend: Short-term bullish with a slight consolidation. • MACD: Flat, showing a pause but no reversal yet. • RSI: 53.19 — mid-range, suggesting more upside potential. ⸻ 2. Fundamental Analysis: • US economy shows resilience (strong job data, improved GDP). • Fed’s stance on rates remains balanced, leaning dovish, supporting equities. • Geopolitical tensions slightly cooling, risk appetite growing. ⸻ 3. Trade Plan — Long Position (Buy) • Entry: 42,210 (after a clean break above consolidation). • Stop Loss (SL): 41,900 (below recent intraday support). • Take Profit (TP): 42,830 (previous daily high). FUSIONMARKETS:US30 Longby KeN-WeNzElUpdated 5
Bearish reversal off pullback resistance?Dow Jones (US30) is rising towards the pivot which is a pullback resistance and could drop to the 1st support. Pivot: 42,476.16 1st Support: 41,442.18 1st Resistance: 43,185.84 Risk Warning: Trading Forex and CFDs carries a high level of risk to your capital and you should only trade with money you can afford to lose. Trading Forex and CFDs may not be suitable for all investors, so please ensure that you fully understand the risks involved and seek independent advice if necessary. Disclaimer: The above opinions given constitute general market commentary, and do not constitute the opinion or advice of IC Markets or any form of personal or investment advice. Any opinions, news, research, analyses, prices, other information, or links to third-party sites contained on this website are provided on an "as-is" basis, are intended only to be informative, is not an advice nor a recommendation, nor research, or a record of our trading prices, or an offer of, or solicitation for a transaction in any financial instrument and thus should not be treated as such. The information provided does not involve any specific investment objectives, financial situation and needs of any specific person who may receive it. Please be aware, that past performance is not a reliable indicator of future performance and/or results. Past Performance or Forward-looking scenarios based upon the reasonable beliefs of the third-party provider are not a guarantee of future performance. Actual results may differ materially from those anticipated in forward-looking or past performance statements. IC Markets makes no representation or warranty and assumes no liability as to the accuracy or completeness of the information provided, nor any loss arising from any investment based on a recommendation, forecast or any information supplied by any third-party.Shortby ICmarkets11
US30 - Catch The Next Wave!US30 is currently in an uptrend, with price action respecting a well-defined ascending channel. We anticipate another bounce from channel support. In Wave 2, price was rejected at the 38.2% Fibonacci retracement level, and we expect a similar reaction for Wave 4. Our strategy is to wait for price to enter the buy zone, between the 38.2% and 50% Fibonacci retracement levels, and look for bullish reversal signals before entering a position. Potential Bullish Reversal Signals: Trendline break Break of structure (BOS) Other confirmation patterns Trade Plan: - Monitor price movement into the buy zone, aligning with channel support. - Enter long positions upon confirmation of bullish price action, placing stop-loss below the established low formed after bullish confirmation. Target levels: 45,000 and 48,500, with the remainder held for a potential extended swing trade. Goodluck and as always, trade safe!by WicktatorFX1132
Us30 sell market technicals Us30 sell market technicals. Looking like a nice drop from trend lines. Signal was sent to GTE vip. Shortby US30EMPIRE3
US30 Update - Potential TargetsI calibrated the analysis a little: It seems like stocks have some bullish strength. We'll have to wait and see if the imbalance will be filled in the short term. Feel free to ask if anything is unclear. Thank you for taking the time to study my analysisby ANROC2
US 30 daily time frame US30 (Dow Jones) Daily Chart Analysis – Bearish Breakdown Ahead? Market Structure & Trend Analysis: The chart shows a Head and Shoulders (H&S) pattern, which is a bearish reversal formation. Neckline break confirmed, suggesting further downside movement. The large blue arrow points to the next key support area near 38,731, representing a potential drop of about -9.51%. Key Levels to Watch: Resistance: 42,500 - 43,000 (previous support turned resistance). Support: 38,731 (historical demand zone & target from the H&S breakdown). RSI & Volume Analysis: RSI at 36.82, nearing oversold territory but still has room for further downside. Volume increased on the breakdown, confirming selling pressure. Trade Considerations: 📉 Bearish Scenario: If price stays below the broken trendline, we could see a continuation towards 38,731. 📈 Bullish Scenario: If price reclaims 43,000, the bearish pattern could be invalidated. ⚠️ Wait for Retest: A potential retest of the neckline (around 42,500) before further decline.Shortby Forexbeats4
Falling towards pullback support?Dow Jones (US30) is falling towards the pivot which has been identified as a pullback support and could bounce to the overlap resistance. Pivot: 42,056.64 1st Support: 41,442.18 1st Resistance: 42,990. Risk Warning: Trading Forex and CFDs carries a high level of risk to your capital and you should only trade with money you can afford to lose. Trading Forex and CFDs may not be suitable for all investors, so please ensure that you fully understand the risks involved and seek independent advice if necessary. Disclaimer: The above opinions given constitute general market commentary, and do not constitute the opinion or advice of IC Markets or any form of personal or investment advice. Any opinions, news, research, analyses, prices, other information, or links to third-party sites contained on this website are provided on an "as-is" basis, are intended only to be informative, is not an advice nor a recommendation, nor research, or a record of our trading prices, or an offer of, or solicitation for a transaction in any financial instrument and thus should not be treated as such. The information provided does not involve any specific investment objectives, financial situation and needs of any specific person who may receive it. Please be aware, that past performance is not a reliable indicator of future performance and/or results. Past Performance or Forward-looking scenarios based upon the reasonable beliefs of the third-party provider are not a guarantee of future performance. Actual results may differ materially from those anticipated in forward-looking or past performance statements. IC Markets makes no representation or warranty and assumes no liability as to the accuracy or completeness of the information provided, nor any loss arising from any investment based on a recommendation, forecast or any information supplied by any third-party. Longby ICmarkets4
Dow Jones on the weekly chartAs you can see, due to recent economic news and Trump's economic approaches, we have unfortunately witnessed a decline in major indices, including the Dow Jones. We are currently at the last available support level, which is the bottom of the Dow Jones long-term channel, and we need to see how it reacts to this level in tomorrow's news and the CPI release.Longby AbedEkhlaspoorUpdated 5
US30 Dow Jones Possible RetraceThe US30 Dow Jones is showing bullish momentum and is currently overextended. In this video, we explore a trade idea that involves a retracement to the 50% equilibrium level of the previous price swing. This is not financial advice.05:03by fxtraderanthony7
Dow Jones: Double-Top Signals Heightened VulnerabilityThe Dow Jones Industrial Average (DJI) closed at 41985 on Friday, up 0.08%, maintaining its position above critical support at 41330. The index has dropped more than 6% since the start of the pullback from highs of 45073 in January 2025. The long-term bullish price structure that has lasted over two years remains intact; however, a double-top formation at recent highs and the observed weakness in the current quarter suggest a vulnerability in the long-term price structure, particularly around 42732 and 42248. Should it fail to maintain support at 41330, the index could collapse below the bullish structure. If it holds above this critical support, a temporary rebound targeting 42248, 42732, and 43388 is possible before the price declines again. Reflecting on past market corrections, the index fell 38% in February 2020 and 22% in January 2022. This time, the situation may differ due to the current political and economic climate shaped by the US administration. If we experience a four-stage pullback, the index could decline to 39062, 36794, and 34526, resulting in a correction of over 23%. Should it fall below 34526, there is potential for a deeper dive into bear territory, reaching 32257 with a correction exceeding 28%.Shortby Rotuma2
Dow Jones Analysis for the Coming DaysEntering a buy position on the Dow Jones requires confirmation on the 15-minute timeframe after breaking out of the classic triangle, with a risk-free position around the 42,500 level. If the price breaks out of the triangle and then pulls back with strong momentum—most likely intended to shake out retail traders and trigger stop hunts—it is possible to enter with a larger-than-usual position and a very tight stop-loss. If the support level is broken, the analysis will be considered invalid. The "strong momentum pullback" to the support level refers to the red rectangle. If the price returns to the support zone with very strong momentum, an entry can be taken with a very tight stop-loss.by Trdbhm2000Updated 2
Trendline break The price has broken out of a bearish trendline and made a pullback, now the price looks to make a higher high and go long WE ONLY TRADE PULLBACKSLongby KenyanAlphaUpdated 225
US30 Possible Longs from SupportIf the price breaks the 15 minute high, we can take a quick scalp on US30.Longby CandleStickGuruUpdated 3
US30 SELL NOW!!!!!!!US30 made a strong price rejections off the supply zone am looking forward to see price take out the sell side liquidity from this point and create new lows 41,189 is my goal targetShortby CAPTAINFX22