US30 trade ideas

US30: The Market Is Looking Down! Short!
My dear friends,
Today we will analyse US30 together☺️
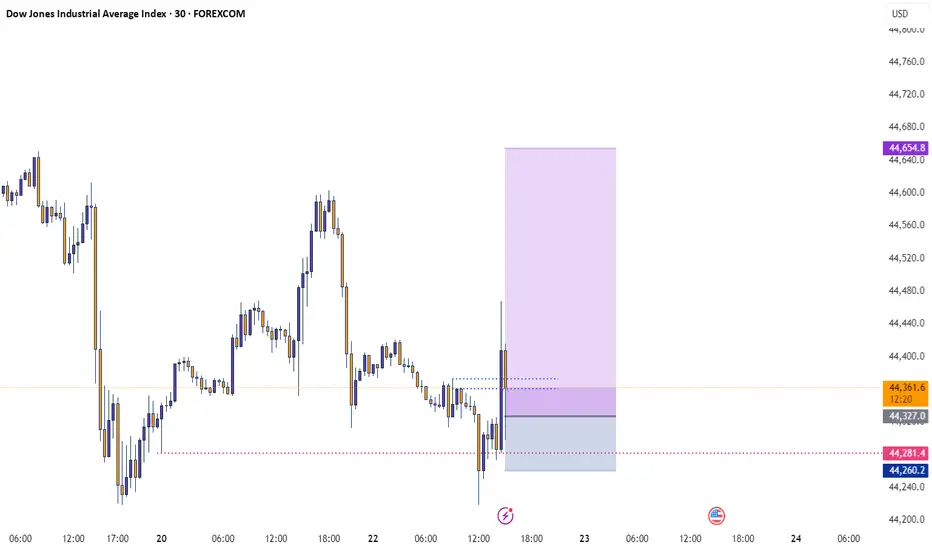
The recent price action suggests a shift in mid-term momentum. A break below the current local range around 44,306.1 will confirm the new direction downwards with the target being the next key level of 44,263.8..and a reconvened placement of a stop-loss beyond the range.
❤️Sending you lots of Love and Hugs❤️

Dow Jones move upThe Dow Jones is resuming its rally toward 45,082 from the price zones of 44,154.97 and 44,000.
CMCMARKETS:US30
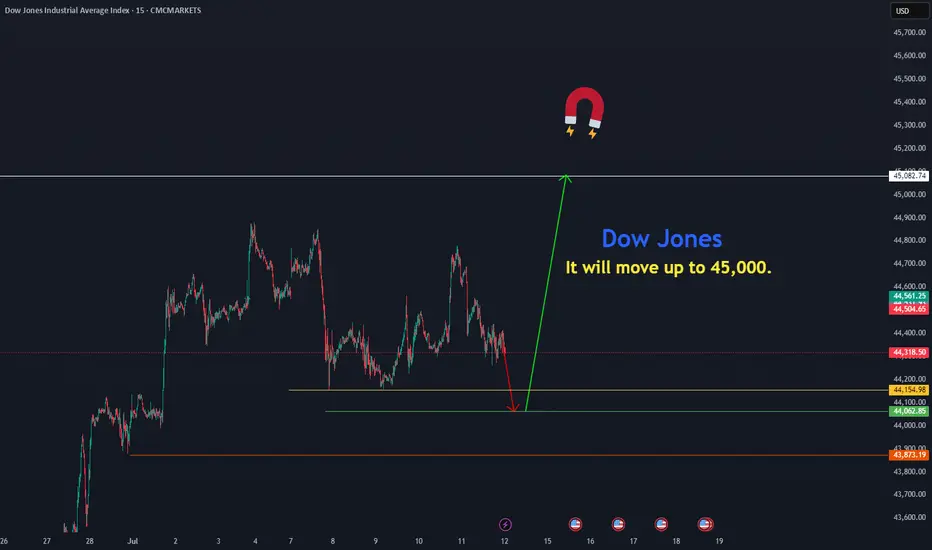
US30 continues to exhibit bullish momentumThe US30 index continues to exhibit bullish momentum, driven by strong earnings reports and robust U.S. economic data. The key support zone around 44,300 has held firm, reinforcing confidence among buyers.
As long as the price remains above 44,300, the uptrend is expected to persist Upside target: 45,000 remains in focus. a focus on the 1H Candle close above 44,000 we could expect price could push more upside.
You may find more details in the chart Trade wisely best of luck buddies
Ps: Support with like and comments for better analysis Thanks for Supporting.

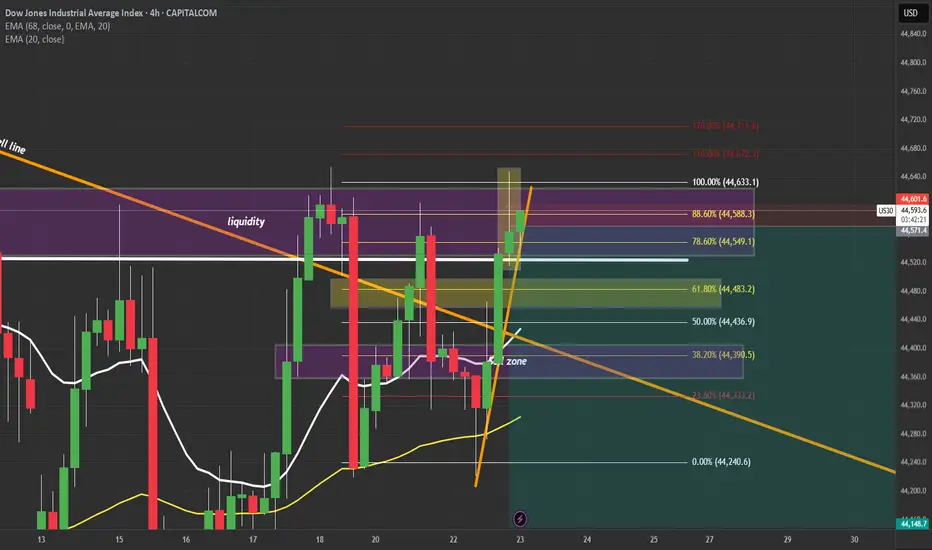
US30 | Inverted Hammer at Key Supply Zone – Reversal or BreakoutUS30 just printed an inverted hammer on the 4H at a major supply zone (44,550–44,600). This is a critical decision point:
✅ Bearish Case:
If price rejects and closes back below 44,530, sellers could take control with targets at 44,380 → 44,180 → 44,020.
✅ Bullish Fakeout:
If price breaks and holds above 44,620, expect a push toward 44,700 and 44,900.
📌 What I’m Watching:
Rejection candle + bearish close → short entries.
Strong breakout candle with retest → long continuation.
Key Levels:
🔴 Resistance: 44,550–44,600
🟢 Support: 44,380 → 44,020
⚠️ Manage risk carefully. Volatility is high and liquidity hunts are common in this zone.
💬 Do you think we reject here or break out higher? Drop your thoughts below!
#US30 #DowJones #PriceAction #SmartMoney #TradingView #TechnicalAnalysis #IndicesTrading
Buy
Rejection Level
Daily Volume
Market Structure Shift
London Session
Trend Line Break
Untapped Order Point
Dow Jones is Nearing an Important Support!!Hey Traders, in today's trading session we are monitoring US30 for a buying opportunity around 43,950 zone, Dow Jones is trading in an uptrend and currently is in a correction phase in which it is approaching the trend at 43,950 support and resistance area.
Trade safe, Joe.

US30Recent COT data shows rising net short positions on U.S. equity indices, reflecting bearish sentiment from institutional traders toward the Dow (US30). This indicates growing caution or expectations of downside pressure.

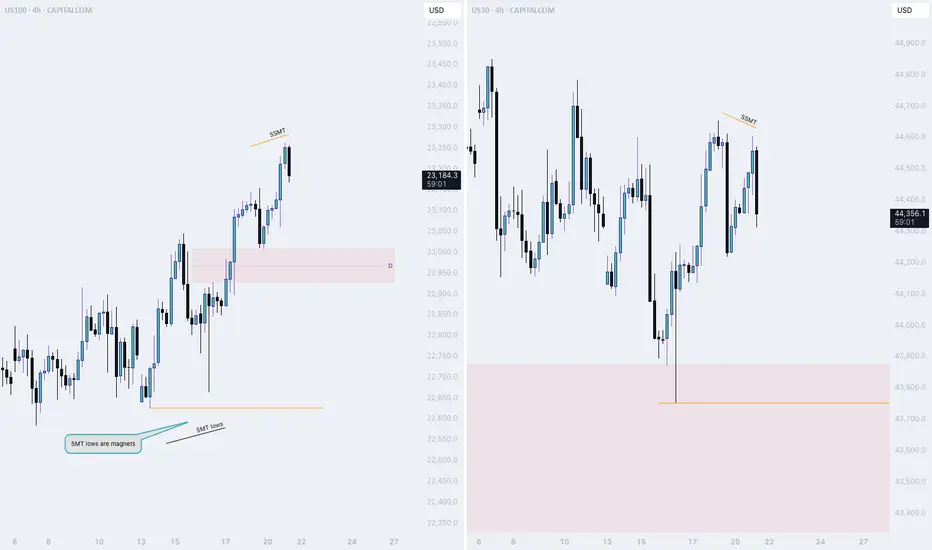
NQ thread: Short ideaMonday started off bullish, but only to drop at the end of the session.
Here is a thread on what is happening and on which narratives I view the market
Starting off with the 4H Time frame, we witnessed NQ and ES taking last weeks high.
YM did not.
This is the first stage of the movement. To find the second stage, we need to dive deeper into the lower timeframes..
Litty Like US30!!I'm purely going off the Week chart. 4hr MSS+ 4hr BPR gives me reasons to buy price. I'm targeting the Equal Highs on the Weekly chart.


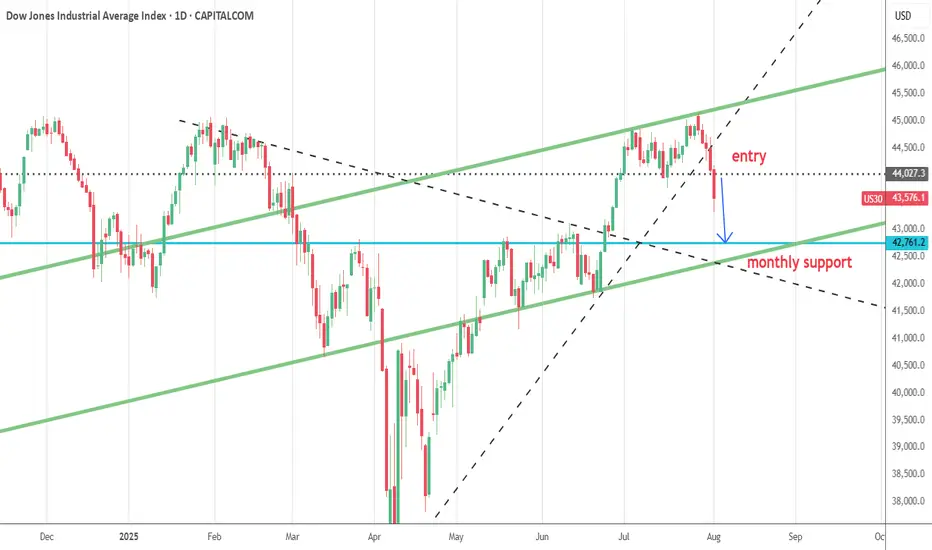
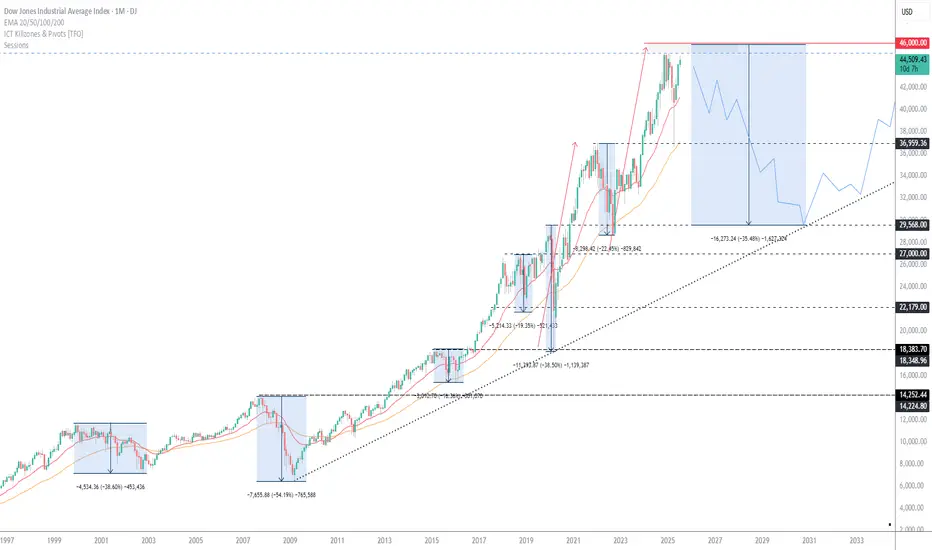
Anticipating DJIOn the daily timeframe, the current position of the Dow Jones Industrial Average (DJI) is projected to follow one of three possible scenarios:
Scenario 1 (Black Label):
DJI is currently in the process of forming Wave iv of Wave , implying that any short-term rebound is likely to be limited. The index may test the resistance area between 43,953–44,142, but remains vulnerable to further downside correction thereafter.
Scenario 2 (Red Label):
In this scenario, Wave 4 is considered complete, allowing DJI to resume its upward momentum. A breakout would signal the start of Wave 5, targeting the 45,324–46,465 range for a potential new higher high.
Scenario 3 (Blue Label):
Here, DJI is assumed to be in the midst of Wave 4 of Wave (5). A corrective move is expected first, potentially revisiting the support zone around 42,262–43,028, before continuing its bullish trend to form a new higher high.

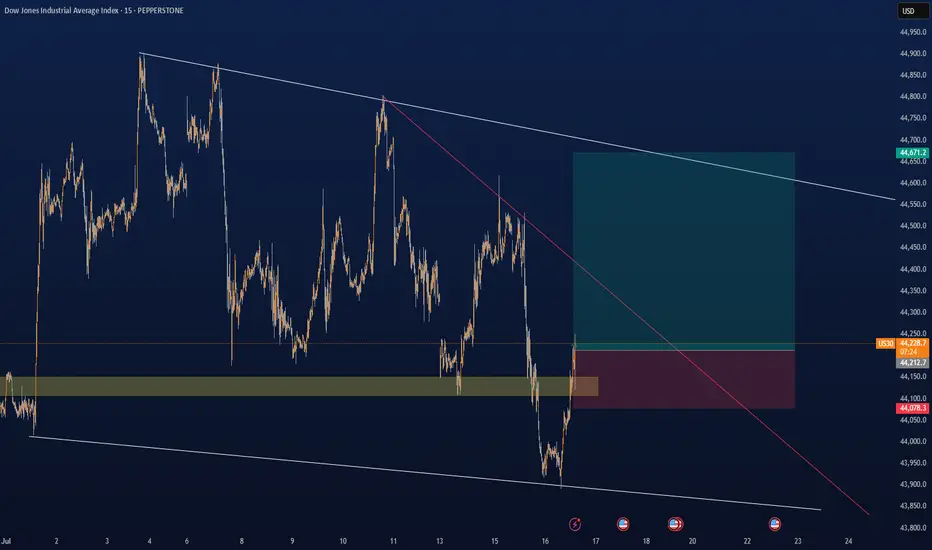
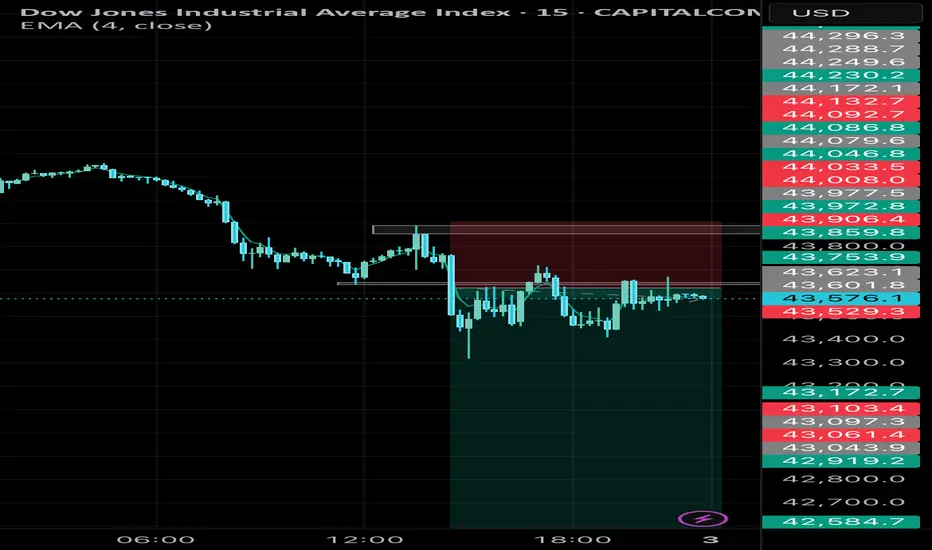
US30 (15M) – Bearish Reversal Setup, Short Opportunity📊 Analysis:
The US30 index on the 15-minute chart is showing signs of a bearish reversal after a recent upward push. Key technical observations:
1. Price Action & Structure
* US30 has been trading in a minor uptrend, but momentum is weakening.
* The latest 15M candles show lower highs forming near resistance, suggesting exhaustion in buying pressure.
2. Resistance Zone
* The price is rejecting a strong intraday resistance zone near 43641.90.
* Multiple failed attempts to break above this level reinforce it as a key barrier.
3. Target Levels
* First support target: 43206.96 – a minor support from previous structure.
* Secondary target: 41911.76.
4. Risk Management
* Suggested stop-loss: Above the recent swing high.
* Risk/reward ratio: Aim for at least 1:2 to ensure proper trade efficiency.
✅ Summary:
US30 on the 15-minute chart is showing a bearish setup.
⚠️ This analysis is for educational purposes only and not financial advice. Always use proper risk management.

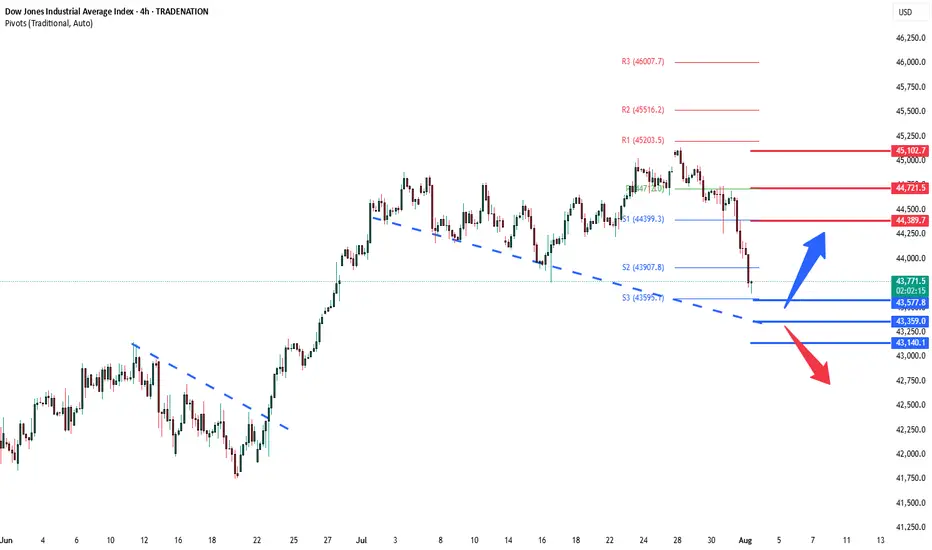
DowJones ahead of US Employment dataKey Support and Resistance Levels
Resistance Level 1: 44390
Resistance Level 2: 44720
Resistance Level 3: 45100
Support Level 1: 43580
Support Level 2: 43360
Support Level 3: 43140
This communication is for informational purposes only and should not be viewed as any form of recommendation as to a particular course of action or as investment advice. It is not intended as an offer or solicitation for the purchase or sale of any financial instrument or as an official confirmation of any transaction. Opinions, estimates and assumptions expressed herein are made as of the date of this communication and are subject to change without notice. This communication has been prepared based upon information, including market prices, data and other information, believed to be reliable; however, Trade Nation does not warrant its completeness or accuracy. All market prices and market data contained in or attached to this communication are indicative and subject to change without notice.
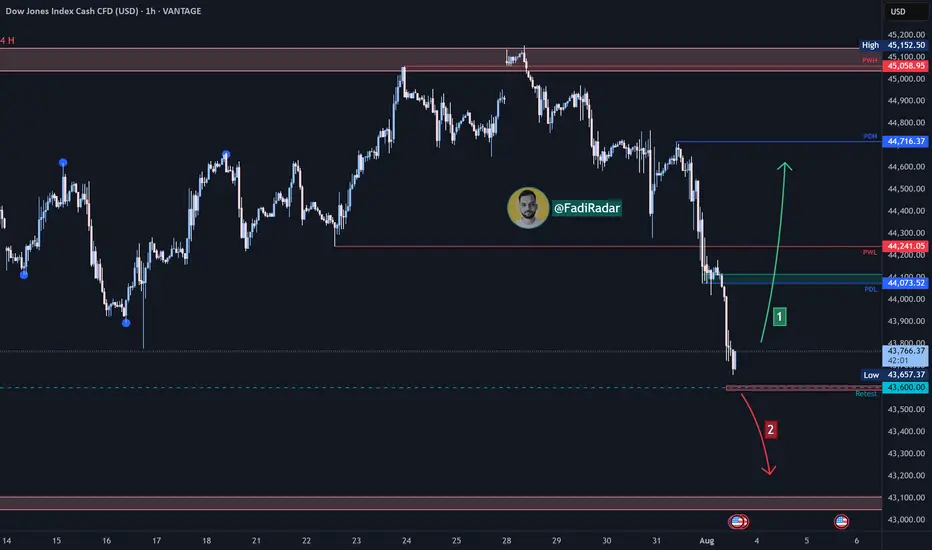
Dow Jones Index Analysis (US30 / Dow Jones):🔹 The Dow Jones index has seen a sharp decline over the past two days, approaching the 43,590 USD support zone.
1️⃣ If the price rebounds from this level and bullish momentum leads to a break and close above 44,100 USD, the index may retest the 44,700 USD area.
2️⃣ However, if the price breaks below 43,600 USD and holds, further downside is likely, with a potential move toward 43,100 USD.
⚠️ Disclaimer:
This analysis is not financial advice. It is recommended to monitor the markets and carefully analyze the data before making any investment decisions.
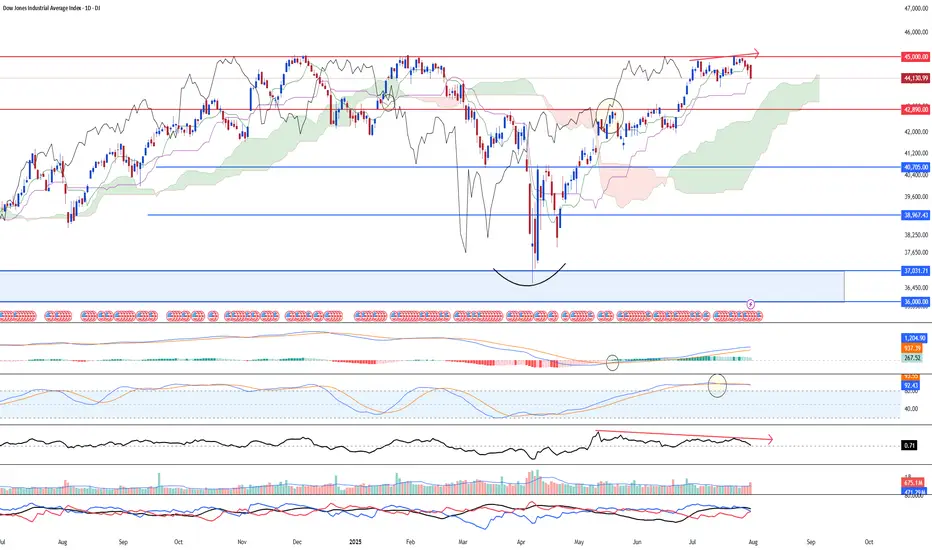
Correction ahead for DJIA, attributed to weak momentumDJ:DJI saw strong potential of a larger degree correction targeting 42,890 or lower support at 41,935. Reason being that there's a bearish divergence between the price chart and 23-period ROC. Furthermore, mid-term stochastic has shown bearish overbought signal. Another worthy price action signal showing weakness is that the index has fail to break above the high at 45,000 psychological level.
Despite the weak outlook, we are looking at a long-term upside targeting 46,200 (6 months and beyond)
DOW?
Hi
Decision timee
If you're buyers
WAIT
If you're sellers
WAIT
This week would give a clearer direction
I will have patience.
I am incline to be bullish
All the best
Not a guru

Dow Jones Industrial Average (DJI) – 1H Chart Analysis 1. Structure: Broad Range Consolidation
Price remains within a wide horizontal range between 45,137 resistance and 43,792 support. This shows indecision and distribution at highs.
2. Key Rejection Zone
The yellow zone around 45,001–45,137 acted as a strong supply area. Multiple rejections indicate heavy selling interest here.
3. Mid-Zone Compression
Current price is hovering just below 44,765 resistance — acting as a decision point. Break above it may retest the supply zone; rejection could send price lower.
4. Demand Holding at 44,280
The strong bounce from 44,280.25 shows buyers defending this demand zone. It's the key support to watch for bulls.
5. Next Play
Bullish: Break and hold above 44,765 targets 45,001–45,137.
Bearish: Failure leads to 44,280, then 43,973 → 43,792.
Neutral bias unless a clean breakout confirms direction.

US30 DOWN FOR WHILEWe have seen dramatic gain in most of the indices and US30 being one of them, and i have been tracking it for so long and i have come with this idea from my approach. As you can see on my screen i have labeled those levels and reset to mark up the the half cycle with the aid of the TDI divergence, the last push there is the level 3 moving exactly with the divergence which indicates that the bulls are getting weak and bears are about take over and push price to the downside, so am looking to join the bears 🐻to price down for a while.
