Dollar Index Bearish to $96 (UPDATE)I posted this DXY sell thesis yesterday for you all while price was still at $97.70. Since then sellers have taken out the previous Wave 3 low, creating a new daily low today at $96.90📉
We still have more downside yet to come towards our $96.60 target. So, use this 'DXY Sell Thesis' to help you with your trading, so once you can use this as a confluence to buy inverse correlated markets
USDX trade ideas

US Dollar is breaking out to the upsideIt looks like the US dollar is breaking out to the upside from a trendline resistance that started back on Feb 2025.
The breakout coincides with the passing of the Genius Act.
DXY I AM MOVING TO 100 % LONG DXY WAVE 4 lowThe chart posted is my view of the DXY I am as bullish now as I was at 71 .Best of TRADES WAVETIMER 96.70 to 97.6

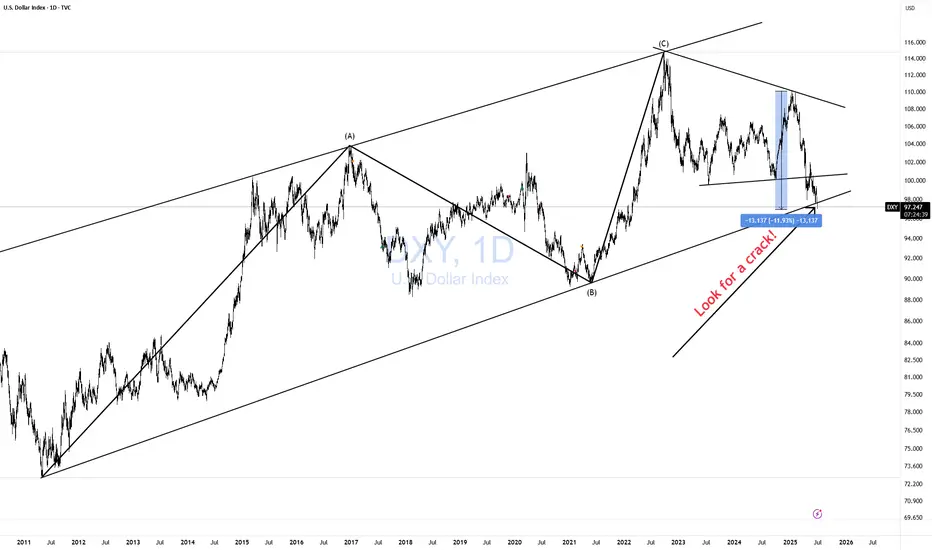
DXY CRACK! BAD JUJU!After Trump unilaterally imposed Tariffs (Taxes) on its citizens to buy imported goods from the rest of the world, promising 90 deals in 90 days, "in two weeks", the demand for the dollar payment system has collapsed by -12% reducing purchasing power for all $ holders'.
Imports of goods mean exporting $s to the rest of the world. As a world reserve currency (WRC), the US gets the benefit of seeing those $s invested back into the US. That creates demand for the $ payment system, and raises $ holders' purchasing power, reducing inflation.
What else happens? A bit complicated but I will try to explain. High demand for $ means the US indirectly exports inflation. Meaning, more $ for the same amount of goods and services. However, as a WRC, the US is not really exporting inflation. That is a bit inaccurate bc the US payment system as a WRC is actually includes a lot more goods and services from the entire planet. This makes sense if you think about it. However only going one way, meaning as long as the demand from the world for our payment system, more $ required by the world reflect more goods and services. As such not inflationary.
Now let's reverse it so you can see why it is not entirely accurate. Should the Global Economy (which is worth today about $100 trillion,) demand ever drop off. The $ value will collapse as people sell their $ holdings in exchange for other currencies. What you are seeing right now in this chart with a CRACK in it.
The US GDP is currently about $30 trillion. There is no way! A $ payment system designed for a $100T economy can suddenly absorb all those $ in a $30T economy. Inflation would skyrocket as more and more $ chase the same amount of goods and services ($30T). This is not rocket science. This is basic 3rd-grade arithmetic!
This CRACK! could be very bad JUJU!
CAUTION is in order. Don't let normality bias fool you. No matter how you feel about Trump. It is irrelevant to basic arithmetic.
DXY ready to push upThe first trade got stopped out. Entered too early.
There is nothing stopping us now.
This means that we sell EURUSD, GBPUSD etc
Enjoy

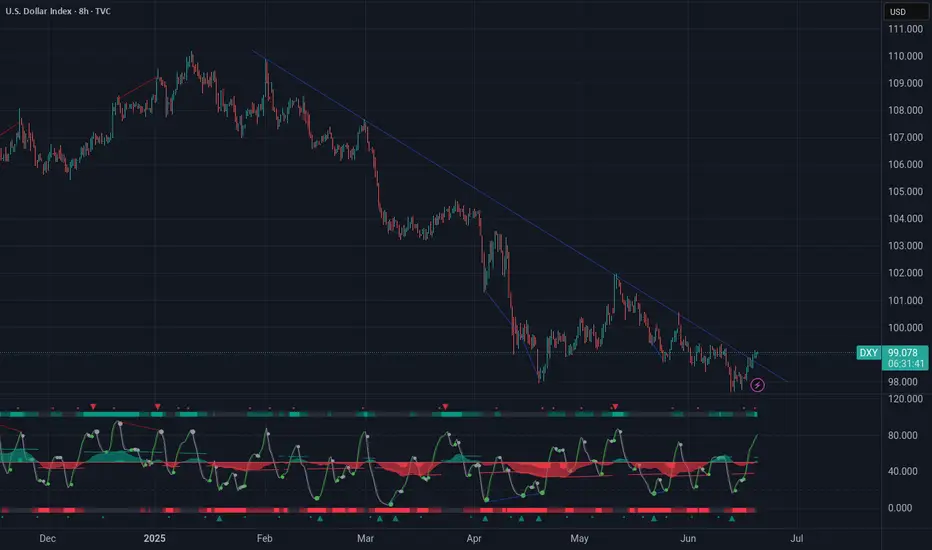
DXY Short-term rebound quite likely.The U.S. Dollar index (DXY) has been trading within almost a 3-year Channel Down, which has assisted us in choosing the right levels to sell high and buy low.
Despite being now on its 2nd major Bearish Leg, we see a short-term bounce possibly up to August quite likely based on the previous major Bearish Leg. As you see, the current setup resembles the April 13 023 Low after which the price rebounded short-term just above the 0.786 Fibonacci level, only to get rejected later and complete the bottom on the 1.1 Fib extension.
Even the 1W RSI sequences between the two fractals are identical. Therefore, before diving below 96.000, we believe a 100.000 test is quite likely.
-------------------------------------------------------------------------------
** Please LIKE 👍, FOLLOW ✅, SHARE 🙌 and COMMENT ✍ if you enjoy this idea! Also share your ideas and charts in the comments section below! This is best way to keep it relevant, support us, keep the content here free and allow the idea to reach as many people as possible. **
-------------------------------------------------------------------------------
💸💸💸💸💸💸
👇 👇 👇 👇 👇 👇

DXY This week on DXY we can see shift from last week longs to short this week based on big institutions smart money. So more bearish expected throughout the week.

DXY: Strong Bullish Sentiment! Long!
My dear friends,
Today we will analyse DXY together☺️
The price is near a wide key level
and the pair is approaching a significant decision level of 96.899 Therefore, a strong bullish reaction here could determine the next move up.We will watch for a confirmation candle, and then target the next key level of 97.077.Recommend Stop-loss is beyond the current level.
❤️Sending you lots of Love and Hugs❤️

Free fall on DXY?With gap open at 97.66 level before the monthly close price has broken the monthly support and started to drop. We may see the price to drop to long term monthly support at 96.622 or further below to 95.66 as with the increased bearish pressure we may see the price to continue to drop to this longer term support level.
As with upcoming USD news we may see the price to move to this level with high probability bearish trend.

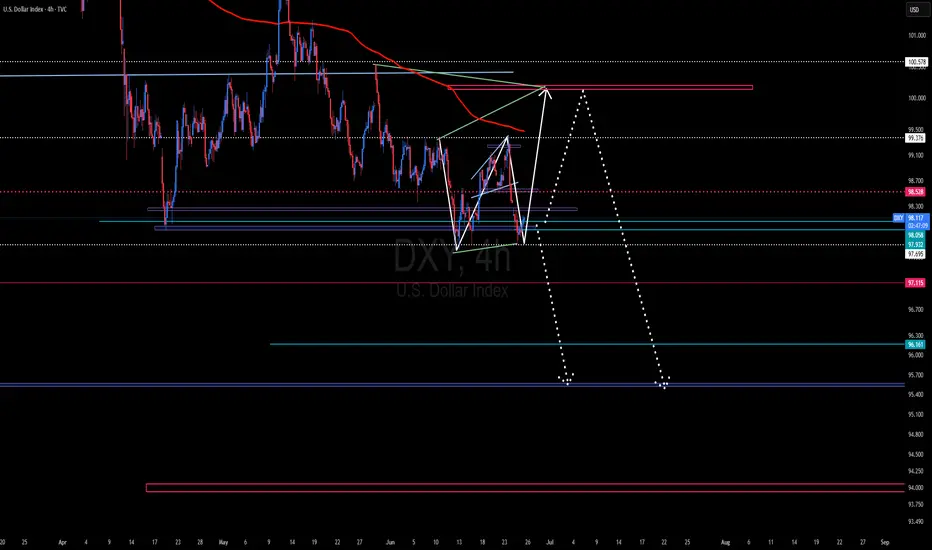
DXY 4Hr And Daily Bearish ( A minor & aslight bull trend)The DXY (US Dollar Index) could potentially rise to the 100.257 level to complete a bullish structure or flag pattern. However, it's also possible that it may face rejection around its current zone and resume its bearish trend, targeting support levels between 99.00 and 98.25.
As always, our entries should be guided by what the market and its structure are showing us. For now, the broader trend for the DXY remains bearish until it potentially reaches the lower support zone around 96.00 – 94.00, or even below that range.
This extended downside expectation is driven by several fundamental factors: anticipations of interest rate cuts in the coming months, potential tax policy changes under Trump, and persistent inflation concerns within the U.S. economy.
In light of these uncertainties, the market demands extra caution at this stage.
Good luck and trade safe!
I dare say, DXY has bottomed, only higher from now on!This is the low on DXY. It can range from here or glide up slowly.
DXY is predictable this year because Trump is unpredictable. Causing the market to just repeat history. Check DXY on 2017
Conservative traders can wait for 4hrs close before entering.
The SL and TP are outlined on the chart.
Enjoy

Make US(and USD) weak again, and short DXY 99,358Hey traders, this is a fundamentally and technically based idea. I´m expecting a weakening of USD due to actual US goverment policy. Important weekly lenel 100,600 was broken and holding. If you decide to trade this idea, you can enter now at current price 99,358 and hold till profit lines. TP your trade partially. You can consider averaging at 100,600 instead of cutloss after the reaction. Wish you good luck.

Potential bulllish reveresal?The US Dollar Index (DXY) is falling towards the pivot, which aligns with the Fibonacci confluence and could reverse to the 1st resistance.
Pivot: 97.08
1st Support: 96.44
1st Resistance: 98.10
Risk Warning:
Trading Forex and CFDs carries a high level of risk to your capital and you should only trade with money you can afford to lose. Trading Forex and CFDs may not be suitable for all investors, so please ensure that you fully understand the risks involved and seek independent advice if necessary.
Disclaimer:
The above opinions given constitute general market commentary, and do not constitute the opinion or advice of IC Markets or any form of personal or investment advice.
Any opinions, news, research, analyses, prices, other information, or links to third-party sites contained on this website are provided on an "as-is" basis, are intended only to be informative, is not an advice nor a recommendation, nor research, or a record of our trading prices, or an offer of, or solicitation for a transaction in any financial instrument and thus should not be treated as such. The information provided does not involve any specific investment objectives, financial situation and needs of any specific person who may receive it. Please be aware, that past performance is not a reliable indicator of future performance and/or results. Past Performance or Forward-looking scenarios based upon the reasonable beliefs of the third-party provider are not a guarantee of future performance. Actual results may differ materially from those anticipated in forward-looking or past performance statements. IC Markets makes no representation or warranty and assumes no liability as to the accuracy or completeness of the information provided, nor any loss arising from any investment based on a recommendation, forecast or any information supplied by any third-party.

DXY Elliott Wave AnalysisThe dollar is finishing a corrective pattern. A good trade opportunity will present itself shortly. Stay tuned for updates.

$DXY Repeating 2016 Post-Election I have highlighted the 2016 to 2020 Presidential Elections time period and then pasted that timeframe onto the 2024 election and found that the pattern is going along very similarly to Trump 1.0.
If we assume that the future unfolds the same as last time, which is low probability, of course, then the future will unfold as shown in the yellow bars going into the future, as shown.
Initially in 2016 post election there was a 7% rally in the U.S. Dollar Index and then a 15% retreat for the following year. So far in 2025 we have seen the same rally and a similar decline, but only faster this time.
It would appear as thought the bulk majority of the declines in the TVC:DXY are over at this time with perhaps 4% further downside over the balance of the year.
The Dollar Index has been useful for predicting changes in the earnings estimates for the S&P500 in the USA due to the high percentage of earnings coming back to the US for quarterly reporting. I have posted a few charts in the past which have been helpful at determining the risk in the stock market.
The behavior of the global central banks has certainly had its impact on monetary aggregates and inflation. The policy response since the Covid Pandemic has been for maximum liquidity and maximum Government spending to keep the global economy afloat. The post-Covid response is now coming to a head along with new policy directives to cut wasteful Government spending and to reduce inflation (caused the Gov't spending).
Global investors have flocked to the US for access to high technology stocks and have driven up the value of US assets to extreme levels compared to other markets. This adjustment phase where investors remove money from overvalued, or highly valued, US assets back to other markets has created a wave of selling in the US Dollar and US listed equities.
What does the future hold? We never know but we sure can learn from what happened in the past by looking at charts just like this one to see what may happen. Looks like a bounce in the TVC:DXY from here, followed by a new low and then a rebound into the next few years.
All the best,
Tim
April 22, 2025 1:16PM EST TVC:DXY 98.78 last

DOLLAR INDEX the US Dollar Index (DXY) is trading around 97.704 -98.572,0.34% . The index has been under pressure due to easing geopolitical tensions ,Particularly optimism about a ceasefire between Israel and Iran and expectations of Federal Reserve rate cuts later in the year. The DXY remains below its 100-day,200 day exponential moving average (EMA), 100day, 200 day simple moving average with bearish momentum supported by interest rate hold and expected rate cut before the end of the year.
the 10 year united states bond yield is trading around 4.279%-4.324%,we have seen gold sell off at 3336-3334 on dollar rally.
Market Outlook:
The DXY is attempting to stabilize but remains in a bearish phase until it decisively breaks above 100 resistance.
the future of the dollar index is depending on Fed policy and global economic conditions.
Summary:
The DXY is currently weak around 97.88 -98.00 due to easing geopolitical risks and Fed rate cut expectations.
Bearish momentum dominates below the 100-day EMA, 200-day EMA, 100-day SMA AND 200 day SMA
A break above 100 would be needed to signal a bullish reversal, if the retest to broken supply at 100 could become demand floor .
#dxy

DXY | daily outlookYALL LIKE THE NEW FACE LIFT??
Price tapped into a refined demand zone after breaking short-term structure, confirming bullish intent. Entry was executed on the mitigation of a prior imbalance, with confluence from BOS (Break of Structure) and trendline liquidity sweep.
Now aiming for the next H1 supply zone where price is likely to react. Bullish continuation expected as long as price holds above 98.080.
TP set just before the high to secure profits before potential distribution.
PLS BOOST & LIKE FOR MORE...

KOG - DXYQuick look at the Dollar index.
We've applied the red boxes to it and and we'll wait for the defence to break. If we can break this upside, our target level to the dollar is way up.
As always, trade safe.
KOG

DXY Liquidity Sweep Into POI Before Bullish Expansion 🔍 Key Levels & Zones
Extreme POI: Price is approaching a major demand zone (marked as EXTREME - POI), expecting reaction from this area.
Fair Value Gap (FVG): Price recently filled a small FVG at ~97.75 before pulling back.
Target: Implied move towards 98.95 area after internal liquidity is swept.
Scenario
Price tapped into the FVG and showed reaction — but no shift yet.
Anticipating liquidity sweep of recent lows into the Extreme POI (~97.11).
If bullish reaction confirms from POI, expecting strong move to:
Reclaim FVG
Break above IMB
Reach target zone at 98.95
🧠 Confluences
50 EMA resistance aligning with FVG — short-term sell pressure.
Classic Wyckoff accumulation schematic potential in POI zone.
Liquidity below marked lows for smart money grab.
⚠️ Invalidation
If price breaks and holds below 97.00 with bearish structure, bullish scenario is invalid.
Bias: Short-term bearish, then bullish continuation.

Dollar Index Analysis: Wedge + Powell Outlook – June 25, 2025📉 Technical Outlook: Bearish Rising Wedge + Liquidity Sweep Setup
TVC:DXY The Dollar Index (DXY) is currently trading within a rising wedge pattern, typically a bearish structure. We're anticipating a fake breakdown, potential sweep of the key demand zone, followed by a reversal move targeting key highs.
🔍 Key Technical Zones
📥 Demand Zone (Buy Area):
🔵 97.50 – 97.20 = Institutional accumulation + unfilled orders
🚫 Invalidation Level (Stop-Loss) :
❌ 96.70 = Clean break below confirms full bearish continuation
🎯 Target Projections (Upside Levels) :
TP1: 99.00
TP2: 100.00
TP3: 101.04 (HTF swing high liquidity cleanout)
🧠 Summary Setup :
Downtrend
Rising wedge formation
Sweep of 97.20 possible
Watch for fakeout & reversal play toward 101.04
🏛️ Fundamental Analysis – Powell’s Testimony Insights
Fed Chair Powell highlighted the following during his recent testimony:
🔄 “We’re not there yet on inflation” — Core services remain sticky
🛑 No immediate rate cuts — Growth is slowing but not crashing
🕰 Rate cuts likely postponed to Q4 2025
🔐 “Real rates are restrictive enough” = No more hikes expected
💡 Implication for DXY :
✅ Short-term bullish bias as higher U.S. yields remain attractive if rate cuts are delayed.
🌍 Macro Context Snapshot (as of June 25, 2025)
🇺🇸 US Disinflation: CPI & PCE easing, but not collapsing
🇪🇺 ECB Cut in June: Euro may weaken further
🇯🇵 BOJ Policy Unclear: USD/JPY likely volatile
🌐 Global Risk Appetite High: Volatility may return with geopolitical events
🔥 Watch This: Trade Tariff Narrative Heating Up
🚨 New U.S. Tariff Signals on Chinese tech and EU autos are resurfacing. This could:
Push inflation risk higher
Delay Fed’s easing timeline
Add support to USD short term as markets price in geopolitical tension and uncertainty
📌 Trading Strategy Recap :
Monitor wedge support near 97.20
Look for fakeout/sweep and bullish reversal
Target 99–101 zone on rebound
Stay alert to Powell/Fed rhetoric + tariff news
If you find this analysis helpful, Like, Comment, and Follow for more DXY, gold, and macro trades!

DXY Bearish - 4HR Sell Side LiquidityDXY Bearish - 4HR Sell Side Liquidity - very likely DXY will push down this week and take out the SSL

TIME FOR THE DOLLAR TO STRENGTHEN OR FURTHER WEAKNESS.So what are we lookin at? We have been looking at the weakest price in dollar yet.Yesterday we tested the yearly lows at 97.700 which we are using as current baseline. I will mark up that price range to use as our support. Geopolitical tensions are cooling off as Trump called for ceasefire between the two war torn nations but we still have lots of economic data flowing in. Most attention fall towards Fed chair Powell speech as this will shape up the direction of the dollar going forward as we head to a new month. Correction higher means USDJPY will rise as we are having a steady Yen currency. We saw the dollar fail to hold above 99.300 which is our nearest resistance level marked by a horizontal ray.So focus is on those two price levels so as to enable us find opportunities to trade.

Overlap resistance ahead?The US Dollar Index (DXY) is rising towards the pivot, which is an overlap resistance and could reverse to the 1st support that lines up with the 127.2% Fibonacci extension.
Pivot: 98.50
1st Support: 97.21
1st Resistance: 99.30
Risk Warning:
Trading Forex and CFDs carries a high level of risk to your capital and you should only trade with money you can afford to lose. Trading Forex and CFDs may not be suitable for all investors, so please ensure that you fully understand the risks involved and seek independent advice if necessary.
Disclaimer:
The above opinions given constitute general market commentary, and do not constitute the opinion or advice of IC Markets or any form of personal or investment advice.
Any opinions, news, research, analyses, prices, other information, or links to third-party sites contained on this website are provided on an "as-is" basis, are intended only to be informative, is not an advice nor a recommendation, nor research, or a record of our trading prices, or an offer of, or solicitation for a transaction in any financial instrument and thus should not be treated as such. The information provided does not involve any specific investment objectives, financial situation and needs of any specific person who may receive it. Please be aware, that past performance is not a reliable indicator of future performance and/or results. Past Performance or Forward-looking scenarios based upon the reasonable beliefs of the third-party provider are not a guarantee of future performance. Actual results may differ materially from those anticipated in forward-looking or past performance statements. IC Markets makes no representation or warranty and assumes no liability as to the accuracy or completeness of the information provided, nor any loss arising from any investment based on a recommendation, forecast or any information supplied by any third-party.
