Tariff uncertainty keeps weighing on the dollar.
Geopolitical risks in the Middle East have eased slightly amid signs of potential negotiations, prompting markets to shift their focus back to the upcoming FOMC and tariffs. Following talks with Canadian Prime Minister Carney, President Trump stated that a trade deal with Canada could be reached within weeks, and also confirmed that a trade agreement with the UK has been signed.
Meanwhile, markets are almost certain that the Fed will keep rates unchanged at the upcoming FOMC, with the probability priced at 99.8%. Wells Fargo expects the inflation outlook to rise due to the delayed impact of higher tariffs, projecting that the year-end median federal funds rate will climb by 25bps to 4.125%.
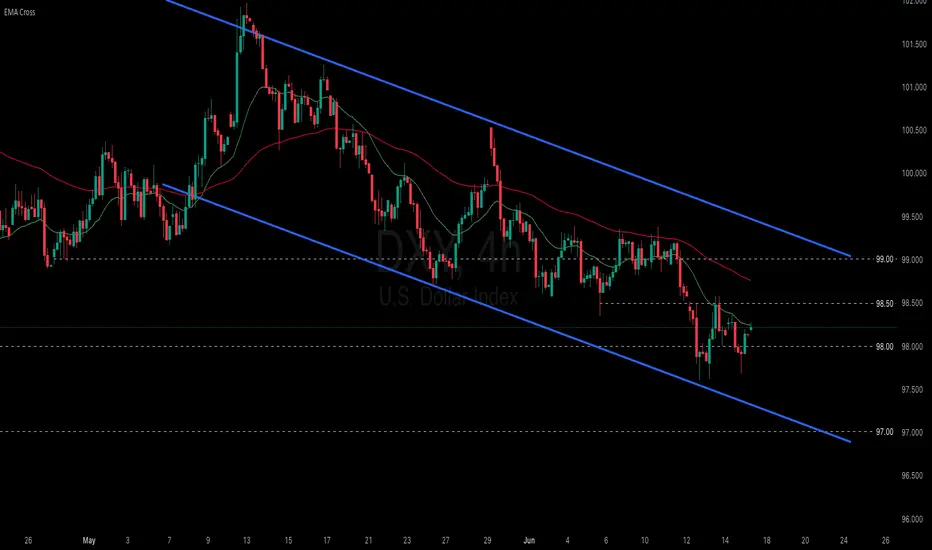
DXY is consolidating within the 97.50–98.50 range, remaining below both EMAs, which suggests a potential continuation of bearish momentum. If DXY breaks below the support at 98.00, the index may retreat to 97.50. Conversely, if DXY breaches above the resistance at 98.50 and the descending trendline, the index could gain upward momentum toward 99.00.
USDX trade ideas
Bullish bounce?USD Dollar Index (DXY) has bounced off the pivot and could rise to the 1st resistance.
Pivot: 97.81
1st Support: 97.19
1st Resistance: 98.69
Risk Warning:
Trading Forex and CFDs carries a high level of risk to your capital and you should only trade with money you can afford to lose. Trading Forex and CFDs may not be suitable for all investors, so please ensure that you fully understand the risks involved and seek independent advice if necessary.
Disclaimer:
The above opinions given constitute general market commentary, and do not constitute the opinion or advice of IC Markets or any form of personal or investment advice.
Any opinions, news, research, analyses, prices, other information, or links to third-party sites contained on this website are provided on an "as-is" basis, are intended only to be informative, is not an advice nor a recommendation, nor research, or a record of our trading prices, or an offer of, or solicitation for a transaction in any financial instrument and thus should not be treated as such. The information provided does not involve any specific investment objectives, financial situation and needs of any specific person who may receive it. Please be aware, that past performance is not a reliable indicator of future performance and/or results. Past Performance or Forward-looking scenarios based upon the reasonable beliefs of the third-party provider are not a guarantee of future performance. Actual results may differ materially from those anticipated in forward-looking or past performance statements. IC Markets makes no representation or warranty and assumes no liability as to the accuracy or completeness of the information provided, nor any loss arising from any investment based on a recommendation, forecast or any information supplied by any third-party.

Short Idea on DXYBased on :
- Investors surprised by the cpi new and seeking safety in bonds (ZB1!) making dollar go down
- break out of an important support level
- 2 supply zones

DXY ||| • Sell Completed Below Orange Line📉 Pair: GBP/USD
⏱ Timeframe: 4H
🔶 Orange Line = Major S/R Zone
📌 Confirmed Break + Retest
🎯 Profit Locked | Risk Managed
Strategy: Elliott Wave + Parallel Channel + SMC (Break of Structure)
🔶 Status:
Completed Wave 5 inside falling wedge
Sell executed after orange support break
Anticipating accumulation phase > BOS > bullish reversal
📍Key Zones:
Demand zone near 97.455
Resistance near 98.426
🎯 Next Steps: Looking for bullish structure post BOS + Wave 2 pullback.
🔁 Watch for:
Accumulation near lower trendline
Structure shift > Breakout of wedge
Long confirmations in late July – early August
🟢 Plan the trade, trade the plan.

dxy for short 30m*The content on this analysis is subject to change at any time without notice, and is provided for the sole purpose of assisting traders to make independent investment decisions.

DOLLAR INDEXThe DXY (U.S. Dollar Index) is a measure of the U.S. dollar’s value relative to a basket of six major foreign currencies: the euro (57.6%), Japanese yen (13.6%), British pound (11.9%), Canadian dollar (9.1%), Swedish krona (4.2%), and Swiss franc (3.6%). It serves as a benchmark for the dollar’s global strength and is influenced by macroeconomic factors like interest rates, trade flows, and inflation expectations.
10 years bond yield Correlations with DXY
1. 10-Year Bond Yield
Positive Correlation: The DXY and U.S. 10-year Treasury yields generally move in the same direction. Higher yields attract foreign capital into U.S. bonds, increasing demand for dollars and strengthening the DXY.
Current 10-Year Yield (June 12, 2025): 4.36%, down slightly from 4.41% the previous day but up 1.16% year-over-year.
2. Bond Price
Inverse Relationship with Yields: Bond prices fall when yields rise (and vice versa). Since DXY and yields are positively correlated, the dollar tends to strengthen when bond prices decline.
3. Interest Rates
Direct Link: Higher U.S. interest rates increase the dollar’s appeal as investors seek higher returns, boosting DXY. Conversely, rate cuts weaken the dollar.
Example: The Federal Reserve’s rate hikes in 2023–2024 contributed to DXY strength, while recent rate-cut expectations have moderated its gains.
Current 10-Year Treasury Yield
As of June 12, 2025, the 10-year Treasury yield is 4.36%, below its long-term average of 5.83%.
Key Drivers of DXY in 2025
Federal Reserve Policy: Markets are pricing in potential rate cuts later in 2025, which could limit DXY upside.
Global Risk Sentiment: Safe-haven dollar demand rises during geopolitical or economic uncertainty.
Inflation Trends: Persistent U.S. inflation could delay Fed easing, supporting DXY
technical level to watch is the support level at 97,949

DXY OUTLOOKhello.
this is my view or the dwy in the next 2 days :)
hope you find this helpfull
i wil update in the mid week

16.06.25 Morning ForecastPairs on Watch -
FX:NZDUSD
FX:CADJPY
OANDA:XAUUSD
FX:EURCAD
A short overview of the instruments I am looking at for today, multi-timeframe analysis down to what I will be looking at for an entry. Enjoy!

Could the DXY reverse from here?The price is reacting off the pivot and could rise to the 1st resistance which is an overlap resistance.
Pivot: 97.71
1st Support: 94.66
1st Resistance: 101.87
Risk Warning:
Trading Forex and CFDs carries a high level of risk to your capital and you should only trade with money you can afford to lose. Trading Forex and CFDs may not be suitable for all investors, so please ensure that you fully understand the risks involved and seek independent advice if necessary.
Disclaimer:
The above opinions given constitute general market commentary, and do not constitute the opinion or advice of IC Markets or any form of personal or investment advice.
Any opinions, news, research, analyses, prices, other information, or links to third-party sites contained on this website are provided on an "as-is" basis, are intended only to be informative, is not an advice nor a recommendation, nor research, or a record of our trading prices, or an offer of, or solicitation for a transaction in any financial instrument and thus should not be treated as such. The information provided does not involve any specific investment objectives, financial situation and needs of any specific person who may receive it. Please be aware, that past performance is not a reliable indicator of future performance and/or results. Past Performance or Forward-looking scenarios based upon the reasonable beliefs of the third-party provider are not a guarantee of future performance. Actual results may differ materially from those anticipated in forward-looking or past performance statements. IC Markets makes no representation or warranty and assumes no liability as to the accuracy or completeness of the information provided, nor any loss arising from any investment based on a recommendation, forecast or any information supplied by any third-party.

DXYWe are expecting DXY to give us bullishness in this week first.
Disclosure: We are part of Trade Nation's Influencer program and receive a monthly fee for using their TradingView charts in our analysis.

Central banks dominate calendar this week: Will Fed surprise?A pack of central bank decisions is set to drive market direction this week, with the Bank of Japan (Tuesday), Federal Reserve (Wednesday), Swiss National Bank (Thursday), and Bank of England (Thursday) all scheduled to announce their latest interest rate decisions.
The Federal Reserve will, of course, take center stage.
Despite President Trump’s continued call for a 100-basis point rate cut, Fed officials are widely expected to keep rates unchanged. However, softer-than-expected CPI and PPI data from last week may provide scope for a surprise.
The U.S. Dollar Index (DXY) is trading just above the key support zone at 98.00, a level not seen since early 2022. A decisive break below this area could open the door to further downside, potentially targeting the 96.00 region. However, a surprise from the Fed could trigger a rebound toward the 100.50–101.00 resistance band.

DXY is turning BULLISH,I'm buying at market open, you should tooTechnically, DXY should retrace from here, range for sometimes, take out liquidity and then continue higher. My DXY post this year has a 99% accuracy. Dont take it lightly.
Now, Dxy had been following a downward trendline since the beginning of this year and I'm seeing a break out soon. Conservative traders can wait for a break and retest but I'm fairly sure we will get it. Enter and add more as the move goes in your favour, stop wasting pips. Dont hold this trade and make only 1k. Add more, compound, not when in loss but when in gain. This will change the game for you.
This means that you should be looking for sell on EURUSD, GBPUSD, AUDUSD et al.
Ya gaziere unu
TP1 @ 99.4
TP2 @ 100.5

Index/US) Bearish trend analysis Read The caption)SMC trading point update
Technical analysis of U.S. Dollar Index (DXY) on the 30-minute timeframe, with the price respecting a clear downtrend and repeatedly rejecting a resistance zone near the 200 EMA.
---
Analysis Breakdown
Key Technical Elements:
1. Downtrend Structure:
The price remains within a descending channel.
Multiple lower highs and lower lows signal sustained bearish pressure.
2. Resistance Zone:
Highlighted near 98.490–98.495, aligned with the EMA 200.
Multiple rejections from this level (indicated by red arrows), confirming strong supply.
3. EMA 200 (98.490):
Acts as dynamic resistance.
Price is below it, reinforcing the bearish bias.
4. Projected Move:
Bearish price path targets the 97.189 level (target point).
A measured move of approximately -1.30% is illustrated.
5. RSI (14):
RSI currently at 46.27, below the neutral 50 mark.
This confirms bearish momentum without being oversold, leaving room for further downside.
---
Bearish Thesis:
Repeated failure to break above key resistance + downward channel + RSI weakness suggests a continuation to the downside.
Short-term consolidation expected before breakdown continuation.
---
Trade Idea Concept:
Entry: Sell on a minor pullback near resistance (~98.300–98.490), or breakdown below the recent minor support.
Target: 97.189 zone.
Stop Loss: Above 98.500 or EMA 200 to invalidate the bearish setup.
Mr SMC Trading point
Risks to Watch:
A break and strong close above 98.500 would invalidate the bearish structure and could initiate a trend reversal.
Economic events (noted by calendar icons) may trigger volatility – ideal to monitor closely around those times.
plesse support boost 🚀 this analysis)

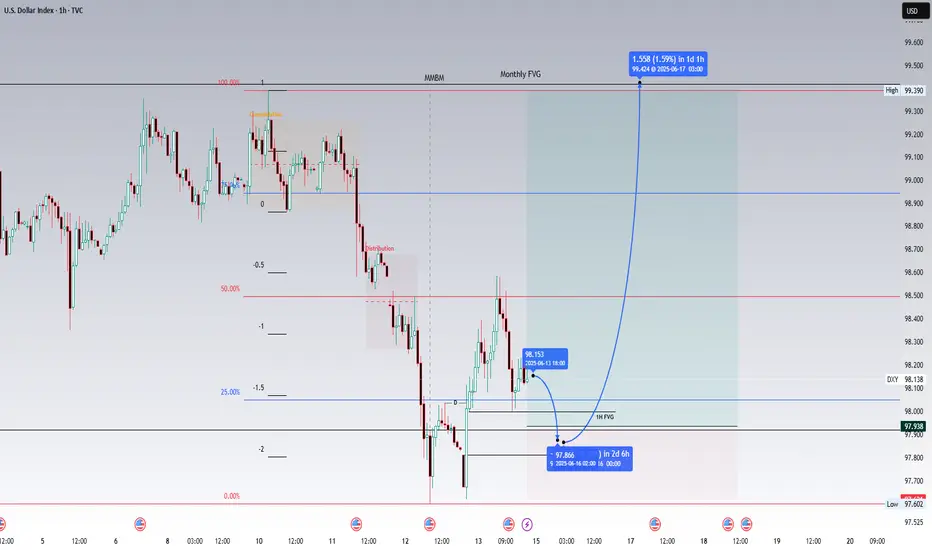
Potential bullish scenario formulating for DXY. Target: 99.418.Higher timeframe analysis
Thursday, 12 June 2025 saw the DXY take out the monthly low of 97.921. This poses the bearish monthly FVG as an immediate draw on liquidity at 99.418. Warranting a bullish bias till this level.
Intermediate timeframe analysis
This bullish bias is further confirmed by an initial consolidation identified on the 1H chart immediately below the said monthly FVG. This is a signature of the formation of a market maker buy model. Note the displacement to the updside which occurred at 21:00 EST leaving behind a bullish fair value gap on the 1H. This signals the beginning of the buyside of the curve of a market maker buy model.
Scenario
A potential long scenario could play out whereby price could respect the bullish 1H FVG at 97.999 and reprice updwards towards 99.418. I suspect that the target could be reached by Tuesday morning at 2:00 am - 3:30 am EST, though this is merely an estimation at best. This analysis is largely dependent on the reaction of price in the weekly open. Though in the event of a non-volatile market open this analysis holds decent probability.
Alternate Scenario
Should the above analysis fail the relative equal lows at 97.602 could be taken out before upside to 99.418 is seen.
DXY Weekly ForecastDXY Weekly Forecast
- expect short term up move then dont miss the upcoming fall
- again as I said in previous forecast, in any case DXY has to come down to 96.000 level, believe it or not, that’s the target the algorithm aims for.
A Message To Traders:
I’ll be sharing high-quality trade setups for a period time. No bullshit, no fluff, no complicated nonsense — just real, actionable forecast the algorithm is executing. If you’re struggling with trading and desperate for better results, follow my posts closely.
Check out my previously posted setups and forecasts — you’ll be amazed by the high accuracy of the results.
"I Found the Code. I Trust the Algo. Believe Me, That’s It."

My Thoughts #015My Thoughts
Are that the pair will sell in this manner.
The pair is in a bearish pattern
Currently the pair is making a new LL
Meaning that on the lower time frame the pair is in a bearish pattern.
As you can see that pair just made a new LL a new LH is expected
It could buy and invalidate the set up.
Just use proper risk management
Let's do the most

Caution for Dollar Shorts with Middle East Tensions FlaringMy educated guess is that the dollar is moving similar to the first time trump was elected. I am expecting dollar weakness to abate early next year. A major swing low formed in early 2018 one year after Trump was elected first round. Let us see if a similar situation forms next year. For now with DXY structured bearish caution is warranted with Oil up and 10 yr remaining elevated. There is a prior up move in April and until a decisive break below the current area Price Action and circumstances in the middle east warrant caution for dollar shorts.

DXY for short 45m*The content on this analysis is subject to change at any time without notice, and is provided for the sole purpose of assisting traders to make independent investment decisions.

Follow up on DXY Short post from 2022The DXY follows Fib levels quite accurately on macro movements using the monthly chart. Both on retracement and extension. It has recently tagged the .618 retrace of the last bullish wave 5 movement that started its decline.
I would suppose it is close to completion of wave A of a ABC correction that will play out over the next several months. As it tagged the .618 mentioned above, it has also tagged the .786 extension of what is likely the c wave of the abc structure (of the larger A).
B wave trade to the upside has good probability now in my opinion. I took the trade this morning with a 3-1 RR in place. It could fall to the trend line which is fine, but if it breaks in earnest and closes a few sessions below then my stop would be triggered.
There was a bullish divergence prior to the April lows on the Daily TF and one is developing at the current lows. A close above 99.40 would confirm.
Long term the dollar is likely still going to weaken and go much lower as QE inevitably comes back into the market picture. TP levels are at 99.40, 100.54, 101.25 and 101.76.

DXY: Local Bullish Bias! Long!
My dear friends,
Today we will analyse DXY together☺️
The market is at an inflection zone and price has now reached an area around 97.757 where previous reversals or breakouts have occurred.And a price reaction that we are seeing on multiple timeframes here could signal the next move up so we can enter on confirmation, and target the next key level of 97.970.Stop-loss is recommended beyond the inflection zone.
❤️Sending you lots of Love and Hugs❤️

DOLLAR INDEX (DXY): Bearish Again?!
Dollar Index leaves clear bearish clues after a test
of a significant intraday/daily supply area.
I think that the market will continue falling at reach at least 98.04 level.
❤️Please, support my work with like, thank you!❤️

Reversal pattern on DXYPrice entered into the 12 months Fair value gap the second time and took out the old low there. This is called stop hunt, which is particularly significant because it happened inside a Higher timeframe Fair value gap. After this stop hunt came an invalidation of a Fair value gap (BISI). This price signinature cause the reversal of price ultimately... it is noteworthy that price had spent more than a month in the 12 Month Fair value gap. It is worth trading

US DOLLAR INDEX(DXY): Classic Bearish SetupI believe that 📉DOLLAR INDEX has a potential to continue falling.
The market has been consolidating in a wide intraday horizontal range, and the breakout below the range support is a significant bearish indicator.
Target levels are 98.08 then 97.80 support.
