XAGUSD, XAUUSD, BTCUSD, ETHUSD & DXY Daily Trade SetupsIn this update we review the recent price action in Silver, Gold, Bitcoin, Ethereum & the Dollar Index and identify the next high-probability trading setups and price targets. To review today;s video analysis click here!
USDX trade ideas

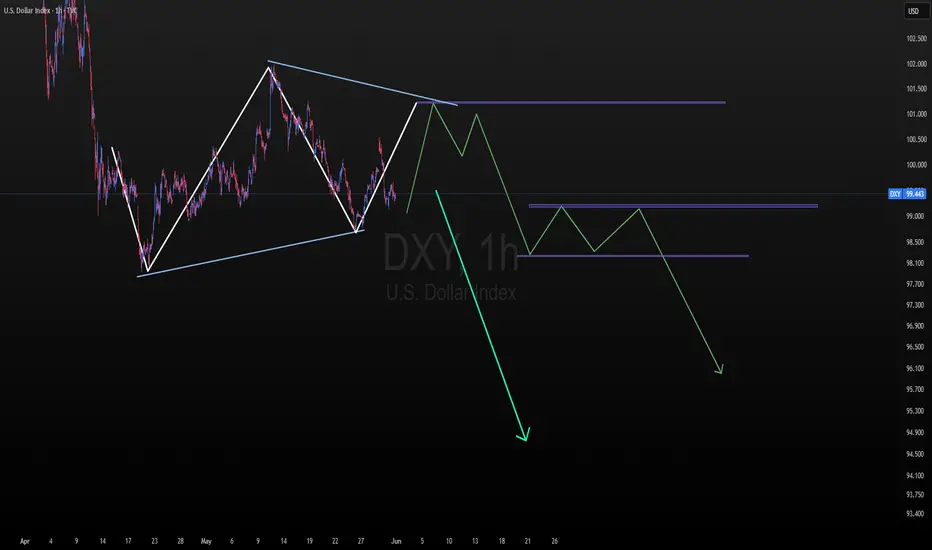
check the trendIt is expected that the correction trend will form up to the specified support zone, then there will be a possibility of a trend change. With the failure of the green resistance zone, confirmation of the bullish trend will be formed.

"Inflation Drops, Jobless Claims Jump — What’s Next for DXY, Gol🚨 Markets are shifting fast. CPI and PPI both came in lower than expected, while jobless claims hit an 8-month high. This triple data combo could mark a turning point for the US economy and the Fed’s next move.
In this video, I break down:
🔹 What soft inflation and rising unemployment mean for monetary policy
🔹 How DXY is reacting to weakening USD sentiment
🔹 Key levels for XAUUSD as rate cut bets rise
🔹 Where BTCUSD may head next with risk-on momentum building
📊 Technical + Fundamental insights — all in one session.
👉 Drop your thoughts in the comments and follow for more real-time market breakdowns!
#DXY #XAUUSD #BTCUSD #Inflation #FedWatch #TradingViewAnalysis #MacroUpdate #Forex #Crypto #Gold

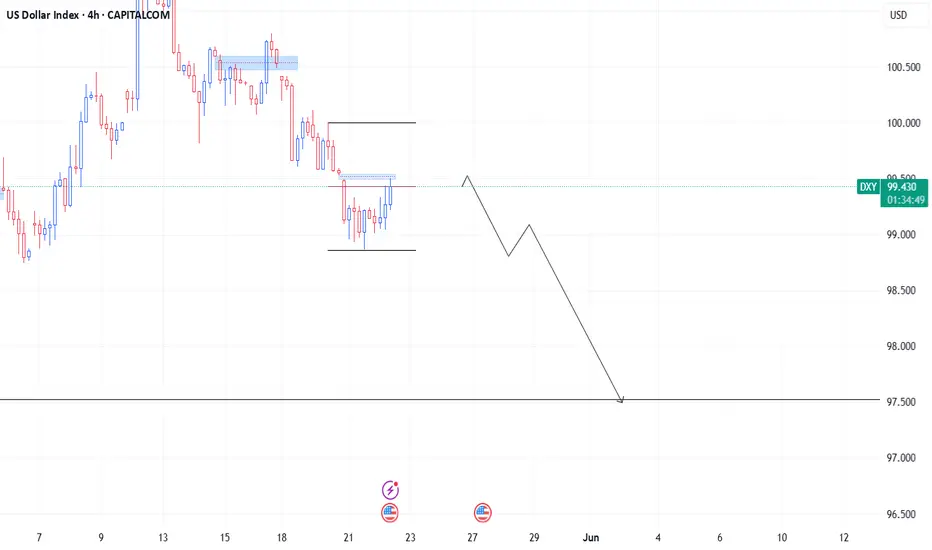
Stuck in the Zone: DXY Tests Balance Between 98 and 99Hello Traders,
After a sharp and uninterrupted decline in the DXY, price found support at the 97.921 level. Sellers then regained control from the weekly bearish Fair Value Gap (W-FVG), pushing price back into the 99 zone.
In this zone, neither sellers nor buyers have managed to assert dominance—suggesting that these levels may act as a pause or balance point. Given the extended drop, a temporary correction could follow if buyers gain traction after one last push.
For now, the bearish USD narrative remains intact. With upcoming catalysts like China/US talks and tomorrow’s CPI release, a renewed move toward 98 is likely to accelerate.
Whether this leads to further selling or a corrective phase will be assessed afterward.

Interesting correlation with Moon cycles and DXYwe got the 200ema and 50ema crossing at the moment. I got a really interesting theory about the moon cycles shown there.

U.S. Dollar Index (DXY) Bearish Setup – Supply Zone Rejection & 🔹 Trend Overview
📊 Overall Trend: Bearish (Downtrend)
📉 Price is forming lower highs and lower lows within a descending channel.
🔻 Recently bounced off a support zone, now heading toward a potential pullback.
🔵 Supply Zone (Resistance Area)
📍 Zone Range: 100.049 – 100.601
🧱 Acts as a resistance block where sellers might step in.
📏 Confluent with EMA 70 at 100.178, strengthening its validity.
🔸 Trade Setup – Short Position
🟠 ENTRY POINT: 100.088
❌ STOP LOSS: 100.587 – 100.595 (Just above supply zone)
🎯 TARGET: 98.000 (With intermediate support levels)
📌 Support Levels
🔹 98.112 – First minor support
🔹 98.106 – Close-range confirmation
🔹 97.885 – Additional support zone
🟦 Main Target: 98.000
⚖️ Risk/Reward Ratio
🟧 Small risk above supply zone
🟩 Large reward to downside = Favorable R:R
📌 Summary
📈 Expecting a pullback into supply zone.
🧨 Look for bearish confirmation around 100.088.
🎯 Target the downside at 98.000 for profit.

Bullish outlook Previous liquidity was taken , would be expecting a bullish move to ake out sell side


Buy Idea on Us Dollar Index (Dxy)Based on :
- Demand zone
- Pin bar Reversal
- Changing of correlation between dxy and zb1!
- cot report

Price action Dxy broke structure above had to wait for this confirmation all that needed is sweep the liquidity above

dxy bearish ideadxy rejected from weekly fvg and expecting it to fall after tapping the volume imbalance which is also in the premium zone
dxy bias ideaThe previously mentioned bias idea played out well. A pump was caused due to trump eu tariff situation.
Now if we get a weekly closing below this low we can see a further lower push. Amid current unclear fundamental situations this can be invalid.
DYOR this is just my pov (im a noob)
Price action If the 30 min candle close above the red line I'll resume selling Gbpusd currently sitting on my hands

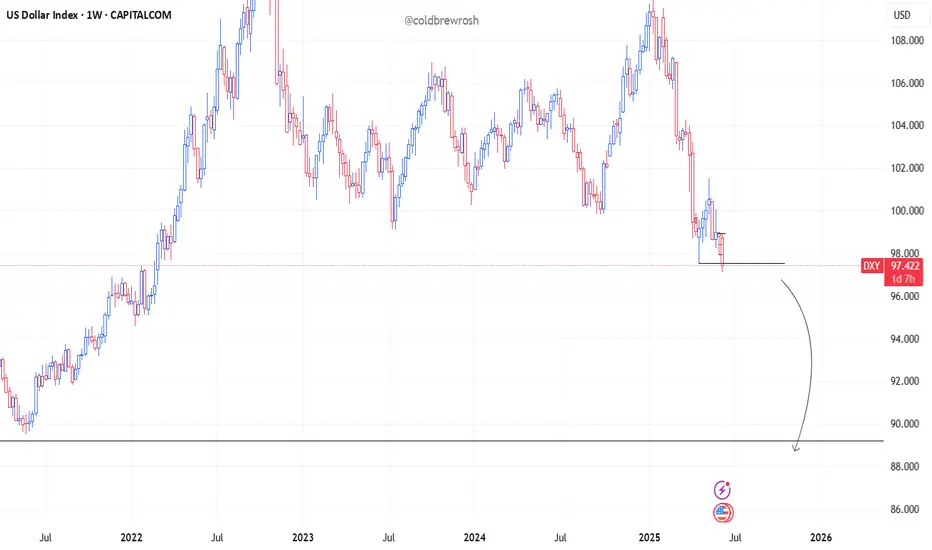
Dollar Falling Ends Soon? Look What Pattern Is Forming!”Asset: U.S. Dollar Index (DXY)
Timeframe: 1D (Daily Chart)
Methodology: Elliott Wave + FVG (Fair Value Gap) + Price Action
DXY has completed an impulsive 5-wave bearish structure, now entering a high-probability reversal zone marked by strong buyer interest around the Wave 5 bottom.
📌 Key Insights:
Wave 5 approaching demand zone (Buyers' area)
Price inside Fair Value Gap (FVG) – potential order block
Bullish reversal expected from here
Forecast: A breakout into an ascending channel, confirming reversal
💡 If Wave 5 holds, we may see a sharp upside rally aligning with smart money accumulation + Elliott Wave psychology.
🔔 Watch for bullish confirmations near 97.50–98.00 for a potential long setup targeting the 104–107 zone.


DXY has lost it...Despite what the news have been telling us, price action is indicating that it's heavy on the sellside delivery. The news failure so far has supported the Bears. We may see continue weakness until proven otherwise.

DXY 4hr chart Analaysis It is possible that the DXY may retrace back to the 101.208 level, which previously marked the beginning of a bearish move. Alternatively, it could also resume a bearish trend from its current level or around the 99.80 zone. The market at this point requires heightened caution.
A potential bearish entry could be considered if DXY breaks below the 98.66 – 98.30 support area. A clear break of this level would confirm a fully established bearish trend, with a likely continuation towards the 94.00 – 93.00 range. From there, a bullish momentum may be anticipated.
DXY H4 – Dollar Weakens Ahead of PPI Release DXY H4 – Dollar Weakens Ahead of PPI Release | Is the Market Pricing in a Fed Pivot?
🌐 Macro & Fundamental Context
As we head into the New York session on June 12, the market’s attention shifts to one critical data point: the US PPI (Producer Price Index). Following the softer-than-expected CPI reading of 2.4% YoY (vs. 2.5% forecast), the Dollar Index (DXY) dropped sharply—signaling fading inflation pressure and reigniting rate cut expectations.
✅ Bearish Fundamentals Building for the USD:
CPI miss fuels Fed rate cut bets (currently ~65% chance for September per FedWatch Tool).
US Treasury yields are easing, reflecting the market’s pricing of a less aggressive Fed.
Risk assets rallying as capital flows rotate away from USD into gold, equities, and long-duration bonds.
If today’s PPI also comes in below forecast, it could confirm a deeper correction in DXY. Conversely, a surprise PPI upside might trigger a short-term pullback.
📉 Technical Analysis – H4 Timeframe
🔹 Overall Trend:
DXY is locked within a clearly defined descending channel, with a consistent Lower High – Lower Low structure holding since late May.
🔹 Key Technical Zones:
Short-term resistance: 98.548 – likely to act as a ceiling unless PPI surprises to the upside.
Immediate support: 97.966 – a break below opens the door toward the key support zone at 97.191, which aligns with previous FVG imbalance and multi-timeframe demand.
🔹 EMA Structure:
Price remains below all major EMAs (13 – 34 – 89 – 200), confirming persistent bearish pressure.
EMA13 is currently acting as dynamic resistance on H4, pressing down on price.
🧠 Market Sentiment & Flow Insight
Investors are rotating out of USD as inflation fears fade and Fed easing expectations increase.
Risk-on sentiment is returning, benefiting gold and stocks while weighing on DXY.
However, a hot PPI print could spook the market briefly, leading to a corrective bounce in the Dollar before the trend resumes.
🔍 Scenarios to Watch:
PPI comes in lower than expected:
DXY may retest 98.548 resistance and reject lower.
Next targets: 97.966 → 97.191
PPI surprises to the upside:
Technical bounce toward 98.5–98.8 possible.
But trend remains bearish unless price reclaims 99.2+ zone.
✅ Conclusion
DXY remains under pressure from both macro and technical angles. The PPI report will be the next catalyst that determines whether this is a short-term dip or the continuation of a broader USD downtrend.
🎯 Tactical view: Favour short positions on DXY if price bounces into resistance and PPI supports the disinflation narrative. Target: 97.1 and below.

USDX TEMPORAL UPSIDE??The DXY looks set to take out the immediate low — all eyes on that level. Once it’s cleared, we’ll watch for signs of a possible retracement or reversal to the upside. If no such move occurs, the DXY is likely to continue its decline."

DXY Will Grow! Long!
Here is our detailed technical review for DXY.
Time Frame: 2h
Current Trend: Bullish
Sentiment: Oversold (based on 7-period RSI)
Forecast: Bullish
The market is trading around a solid horizontal structure 98.198.
The above observations make me that the market will inevitably achieve 98.620 level.
P.S
Please, note that an oversold/overbought condition can last for a long time, and therefore being oversold/overbought doesn't mean a price rally will come soon, or at all.
Disclosure: I am part of Trade Nation's Influencer program and receive a monthly fee for using their TradingView charts in my analysis.
Like and subscribe and comment my ideas if you enjoy them!

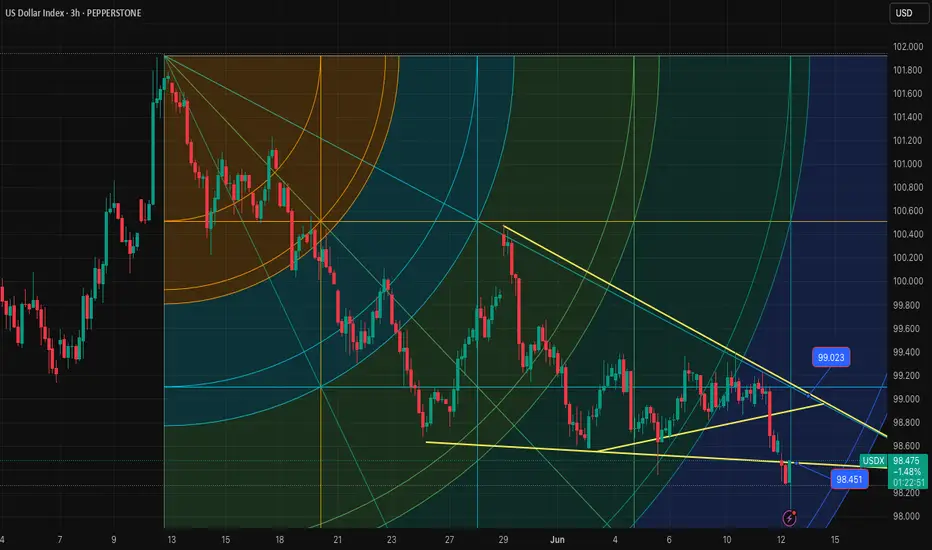
USDX-NEUTRAL BUY strategy 3 hourly GANN SQThe index is changing tune, but we should comfortably move beyond 98.60 before I feel we may have a chance to test 99.10 area. The chances are there, and perhaps this is start ofmit, but kindly wait and see a confirmation for it.
Strategy BUY @ 98.50-98.75 (on break) and take profit near 99.78 for now.
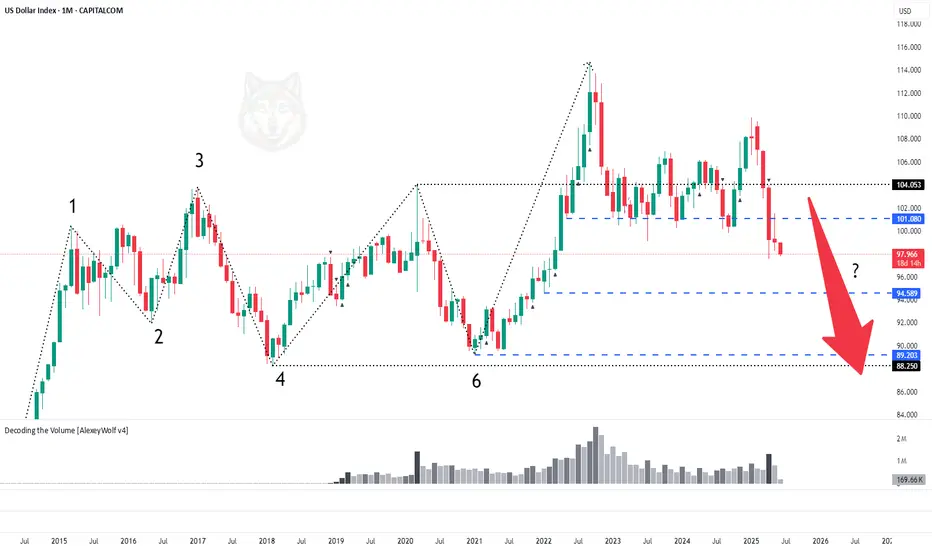
DXY. Midterm Analysis of the US Dollar IndexHey traders and investors!
📍 Context
On the monthly timeframe, the market was in a range. The price broke above the upper boundary and was long supported around the 101.080 level. This level was repeatedly tested by sellers and now appears to have been broken.
📊 Monthly targets: 89.20 and 88.300.
🔎 Analysis
Why might the downward movement continue?
Daily TF
On the daily chart, we can see that on the day buyers returned to the 101.080 level, the main volume was accumulated in a buyer candle right at and slightly above the level. This suggests the level was defended by sellers. This indicates they are currently in control, and the decline may continue. Let’s look at the nearest potential buyer activity levels.
11-day TF
The price has once again broken downward out of the range. Below, there is a small consolidation area formed during the previous upward movement. Its boundaries are: upper boundary — 97.385, lower boundary — 94.589.
🎯 Trade Idea: Rebounds from the upper boundary at 97.385 are possible, but overall the priority remains with a move into this range and towards the 95.00–94.589 zone.
This analysis is based on the Initiative Analysis concept (IA).
Wishing you profitable trades!