DXY Continuation Bearish Bias. 26 Mei 2025
DXY continuation bearish,
Market slow due to bank holiday.
currently retrace and will wait for another signal tomorrow.
SELL USDXXX atau BUY XXXUSD & GOLD
BIAS to no trade today.
USDX trade ideas

USXUSD OHLC Weekly ProfileUSXUSD OHLC Weekly Profile
Expecting a bearish week.
Notice how Bank Holiday aligns for a sponsorship lower from the Daily FVG.
Mix that with Economic Calendar - Thursday & Friday delivery lower, expecting a mid-week reversal.

DXY on daily tfSo we have this on daily tf. and there is a sign of rejection. hopefully this will validate my bias as long position for dxy

Dxy weekly charton this time frame, it shown clearly that price rejected at key level, in which if price dont take out the recent low at the end of the trading week, definitely dxy will continue bull run...

Dxymonthly view.
i will like to see dxy seek more lower price before going long again. but lets see if dxy will close the month with same bearish preasure or end up closing as indicition or rejection

DXY Possible Retest of Bearish FlagEven though the overall trend is still bearish, a pullback might be needed since we have a confirmed breakout of a bearish flag on the daily TF.

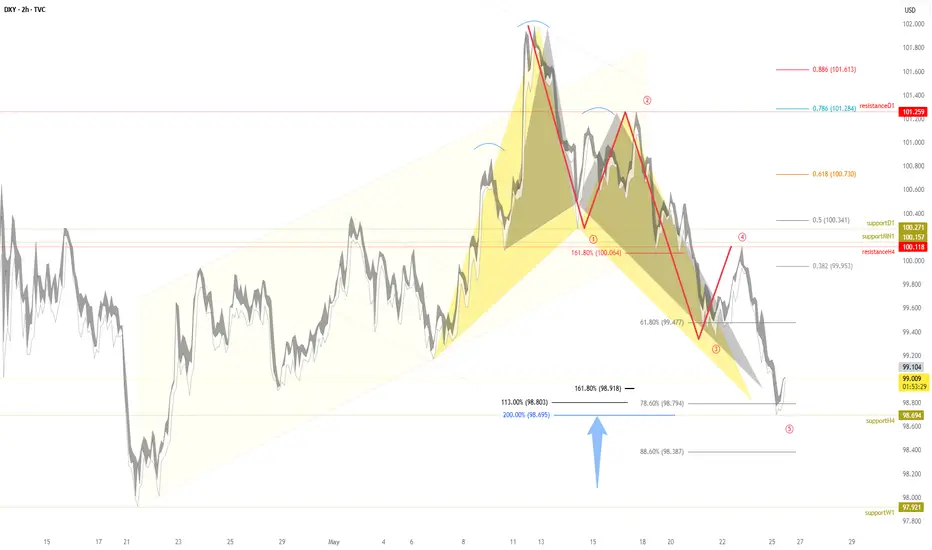
DXY | Harmonic Patterns | Technical Analysis. Recovery Underway?TVC:DXY
Over recent sessions, I’ve been highlighting a critical zone for the TVC:DXY between $98.70 and $98.80 , where several important technical patterns are forming that could signal the start of a rebound after the recent decline.
➡️ The dollar broke below the Head and Shoulders neckline at $100.27 , hitting the default target I projected at $98.69 , which corresponds to the 200% Fibonacci extension. This is a classic confirmation of the breakdown and subsequent drop.
➡️ However, since reaching this level, the TVC:DXY has begun to form strong bullish patterns:
Bullish Crab Pattern at the 161.8% Fibonacci extension, projected at $98.91
Bullish Alt-Bat Pattern at the 113% Fibonacci extension, at $98.80
These emerging bullish setups suggest a solid potential reversal, indicating that the TVC:DXY might be preparing to recover.
🎯 The default targets for these bullish patterns are around $99.95 , aligning with key resistance zones and Fibonacci confluence.
Summary: The TVC:DXY has completed the expected downward move from the Head and Shoulders pattern and is now showing clear technical signs of a possible reversal. The price action in the coming sessions will be critical to confirm whether the index can sustain this recovery toward higher levels.
Safe Traders,
André Cardoso
DXY 4hr chart analysis I expect the DXY to enter a temporary bullish phase, likely as part of a corrective move. The price may rise toward the 100.82 – 101.25 zone.
From that level, I anticipate a bearish reversal, with the potential for the price to decline toward the 97.00 – 94.00 region.

My Thoughts #011What I see coming is sells
Here's why
Because the pair just gave a LH in the current bearish trend of the HTF
and the pair just choch and it's only sells after a retest
It could just continue selling
But I will wait to see the market's hand before taking my first trades
This pair could buy so use proper risk management
Let's do the most

Bullish bounce off overlap resistance?The US Dollar Index (DXY) is falling towards the pivot and could bounce to the 1st resistance.
Pivot: 97.78
1st Support: 95.22
1st Resistance: 101.81
Risk Warning:
Trading Forex and CFDs carries a high level of risk to your capital and you should only trade with money you can afford to lose. Trading Forex and CFDs may not be suitable for all investors, so please ensure that you fully understand the risks involved and seek independent advice if necessary.
Disclaimer:
The above opinions given constitute general market commentary, and do not constitute the opinion or advice of IC Markets or any form of personal or investment advice.
Any opinions, news, research, analyses, prices, other information, or links to third-party sites contained on this website are provided on an "as-is" basis, are intended only to be informative, is not an advice nor a recommendation, nor research, or a record of our trading prices, or an offer of, or solicitation for a transaction in any financial instrument and thus should not be treated as such. The information provided does not involve any specific investment objectives, financial situation and needs of any specific person who may receive it. Please be aware, that past performance is not a reliable indicator of future performance and/or results. Past Performance or Forward-looking scenarios based upon the reasonable beliefs of the third-party provider are not a guarantee of future performance. Actual results may differ materially from those anticipated in forward-looking or past performance statements. IC Markets makes no representation or warranty and assumes no liability as to the accuracy or completeness of the information provided, nor any loss arising from any investment based on a recommendation, forecast or any information supplied by any third-party.

BEARS STILL IN CHARGE ! DXY- USD INDEX FORECAST Q2 W22 Y25DXY USD INDEX FORECAST Q2 W22 Y25
BEARS CRUSHING THE USD!
Professional Risk Managers 👋
Welcome back to another FRGNT chart update📈
Diving into some Forex setups using predominantly higher time frame order blocks alongside confirmation breaks of structure.
✅ U.S. dollar index is a measure of the value of the dollar against a basket of six foreign currencies.
✅The currencies are the Euro, Swiss franc, Japanese yen, Canadian dollar, British pound, and Swedish krona.
🔑 Remember, to participate in trading comes always with a degree of risk, therefore as professional risk managers it remains vital that we stick to our risk management plan as well as our trading strategies.
Pairs to look out for -
EURUSD - BUY
USDCHF - SELL
USDJPY - SELL
USDCAD - SELL
GBPUSD - BUY
- Perhaps it's time to accept that a recovery in the DXY is not occurring anytime soon...
📈The rest, we leave to the balance of probabilities.
💡Fail to plan. Plan to fail.
🏆It has always been that simple.
❤️Good luck with your trading journey, I shall see you at the very top.
🎯Trade consistent, FRGNT X

DXY 1W (Dollar Index Weekly Chart)All eyes on the Dollar’s weekly support zone — it’s looking vulnerable and may attempt a breakdown next week. 📉
If that breakdown confirms, the Dollar could head toward Support 1, and possibly Support 2 in the coming weeks.
And you know what that means...
Bullish for crypto. 🟢🔥
Stay alert — the coming weeks could get exciting!

DXY Weekly ForecastDXY Weekly Forecast
- keep an eye on 100.2 level for potential total down move
- in any case DXY has to come down to 96.000 level
"I Found the Code. I Trust the Algo. Believe Me, That’s It."

USD seeks sellsideDXY moved below the May Open, and as I was anticipating that it's still going to reprice lower where the IPDA Low is resting. The current price action supports the Risk-On regime for now.

"DXY Dollar Index" Market Bullish Heist Plan (Day/Swing Trade)🌟Hi! Hola! Ola! Bonjour! Hallo! Marhaba!🌟
Dear Money Makers & Robbers, 🤑 💰💸✈️
Based on 🔥Thief Trading style technical and fundamental analysis🔥, here is our master plan to heist the "DXY Dollar Index" Bank Heist. Please adhere to the strategy I've outlined in the chart, which emphasizes long entry. Our aim is to escape near the high-risk ATR Line Zone. It's a Risky level, overbought market, consolidation, trend reversal, trap at the level where traders and bearish robbers are stronger. 🏆💸"Take profit and treat yourself, traders. You deserve it!💪🏆🎉
Entry 📈 : "The heist is on! Wait for the Crossing previous high (100.400) then make your move - Bullish profits await!"
however I advise to Place Buy stop orders above the Moving average (or) Place buy limit orders within a 15 or 30 minute timeframe most recent or swing, low or high level for Pullback entries.
📌I strongly advise you to set an "alert (Alarm)" on your chart so you can see when the breakout entry occurs.
Stop Loss 🛑: "🔊 Yo, listen up! 🗣️ If you're lookin' to get in on a buy stop order, don't even think about settin' that stop loss till after the breakout 🚀. You feel me? Now, if you're smart, you'll place that stop loss where I told you to 📍, but if you're a rebel, you can put it wherever you like 🤪 - just don't say I didn't warn you ⚠️. You're playin' with fire 🔥, and it's your risk, not mine 👊."
📍 Thief SL placed at the nearest/swing low level Using the 2H timeframe (99.000) Day/swing trade basis.
📍 SL is based on your risk of the trade, lot size and how many multiple orders you have to take.
🏴☠️Target 🎯: 102.300
🧲Scalpers, take note 👀 : only scalp on the Long side. If you have a lot of money, you can go straight away; if not, you can join swing traders and carry out the robbery plan. Use trailing SL to safeguard your money 💰.
💰💵💸"DXY Dollar Index" Bank Money Heist Plan is currently experiencing a bullishness,., driven by several key factors. .☝☝☝
📰🗞️Get & Read the Fundamental, Macro Economics, COT Report, Geopolitical and News Analysis, Sentimental Outlook, Intermarket Analysis, Index-Specific Analysis, Future trend targets with Overall outlook score... go ahead to check 👉👉👉🔗🔗🌎🌏🗺
⚠️Trading Alert : News Releases and Position Management 📰🗞️🚫🚏
As a reminder, news releases can have a significant impact on market prices and volatility. To minimize potential losses and protect your running positions,
we recommend the following:
Avoid taking new trades during news releases
Use trailing stop-loss orders to protect your running positions and lock in profits
💖Supporting our robbery plan 💥Hit the Boost Button💥 will enable us to effortlessly make and steal money 💰💵. Boost the strength of our robbery team. Every day in this market make money with ease by using the Thief Trading Style.🏆💪🤝❤️🎉🚀
I'll see you soon with another heist plan, so stay tuned 🤑🐱👤🤗🤩

DXY Bullish Shark PatternThe US Dollar Index is showing strength at 98.8%, poised to move decisively towards its upcoming targets.
🦈💸 Will it bite or blow bubbles?
Stay tuned for more financial drama!

Highlighting the lagging inverse relationship BTC and DXY. This is crazy.
And if it continues to play out, it means that higher is next.
So what do we have here?
This is highlighting the lagging inverse relationship BTC has had with DXY since Bitcoin bottomed and DXY topped.
We can see that when DXY drops, BTC moves higher, but it has a lagging period beforehand.
The crazy part is that this lag has been 119 days until BTC moves back up to its recent local high.
EVERY single time.
From there, BTC enters an expansive phase, and every time this has been between 49 and 56 days.
Right now, we are right at that 119 day mark.
Is this continues to play out, we’re heading into price expansion next week for at least 49 days.
When you really dig into the charts you see that’s everything is actually very patterned and simple.
What makes it hard is our emotion.
Next week, expect volatility 🔥

Dollar Bottoming Out Pretty solid bottom for USD. I am assuming more money flowing into USD when a correction is about to happen. We see that this morning when we had that quick drop from 7:00 - 8:00 EST. US10Y rate dropping, USD rising, and equity declining. Back to the old game. So I am suggesting long USD, and short equities, given the recent comeback is way too ridiculous and needs a correction now.

$DXYThe U.S. dollar might face downward pressure as capital shifts into safer or high-demand assets:
💰 Stocks – High quality U.S. products still attract global demand.
🪙 Bitcoin – Emerging as digital reserves.
🥇 Gold – Classic portfolio leverage in times of uncertainty.
🇺🇸 U.S. Strategy – Dollar devaluation could be a smart move to attract foreign capital. Big market = big opportunity.
👉 The U.S. needs capital to grow. A weaker dollar might be the setup.
#Forex #DXY #Bitcoin #Gold #USMarkets #SmartMoneyMoves #TheMoneyAssociation

USD Bears Take Over After 102 ResistanceTiming moves can be difficult on both long and short-term basis. But when price goes oversold on the weekly chart, it can be really difficult to chase the move lower, such as we saw in DXY back in late-April.
The currency hit a major spot of confluent support on Easter Monday and at that point RSI on the weekly was in oversold territory for only the second time in the past seven years.
As I had highlighted in this post () it was the 102 level that I wanted to see DXY trade through to illustrate bullish control following that oversold reading.
It took a few weeks, but last Monday saw an open door for bulls to make the statement move - but they fell 2 pips shy of the big figure and since then, sellers have taken more and more control of the matter.
This is where the proverbial plot thickens as there's now no oversold reading on the weekly DXY chart, and sellers have an open door to push for a major low.
On that front, we will likely need to see a breach of the 140.00 level in USD/JPY to allow for a push to a fresh low, and given the momentum in both USD and USD/JPY from the past week, that's not something that I would want to discount.
But next week is the final week of May trade and it's a big week for both markets. USD/CAD remains of attraction for USD bears given the longer-term range that remains in play there. - js

DXY Aiming for Lower LowsHi,
DXY is bearish on the 1-hour chart, headed toward the 98.901 area, potentially aiming for 97.912 with an extended drop to 96.114.
Price volatility is moving in line with price momentum across both lower and higher timeframes, suggesting strong bearish sentiment at this time.
If the price reverses and breaks above 101.000, the setup will be invalidated.
Happy trading,
K.
Not trading advice


Bond Market Breakdown: Why Yields Are Surging and What It Means 🚨 Market Recap – May 2025 Edition
This week, markets sent a clear message: rising yields are shaking the foundation. In this video, I break down the key events driving the spike in U.S.
Treasury yields — the highest in nearly two decades — and what that means for major assets like:
💵 DXY (U.S. Dollar)
📉 XAU/USD (Gold)
🟠 BTC/USD (Bitcoin)
We unpack:
Why the dollar is showing strength despite long-term fiscal concerns
How bond market stress is impacting investor sentiment across all asset classes
What rising yields mean for your portfolio — in plain language
Why this might be the most important macro signal traders are missing right now
If you’re a trader, investor, or just trying to understand what’s really moving the markets, this recap connects the dots.
📊 Watch now to stay ahead.
🔁 Feel free to share or comment with your thoughts!
#MarketRecap #BondYields #DXY #Gold #Bitcoin #MacroAnalysis #TradingView #InvestorInsights #FX #Crypto #TradingStrategy
