DXY TO RETRACE, BUYMy yearly target for DXY has been smashed in April, not even 6 months in, lol. The move was fast and brutal, many were left out.
Now I think we will see some cool off, a retracement or a range, dont hold trades as the market may range after such big move and I don't like holding a ranging market.
Learn to let your profit run, stop chasing few pips. Dxy fell thousands pips and you caught only 100 pips due to day trading, it doesn't make sense. Learn to see the bigger picture
My TP 1 is 99
TP 2 = 101.3
Enjoy
Follow me as my trades are market order, so you'll see it on time and enter at premium
USDX trade ideas

22.04.25 Morning ForecastPairs on Watch -
FX:AUS200
FX:AUDUSD
FX:EURUSD
FX:GBPUSD
A short overview of the instruments I am looking at for today, multi-timeframe analysis down to what I will be looking at for an entry. Enjoy!

DXY Faces Continued Downtrend in Elliott Wave Bearish PatternThe Dollar Index (DXY) has experienced a significant decline since President Trump’s tariff war intensified global trade tensions. From its peak on September 26, 2022, the Index has exhibited a clear bearish sequence. This decline aligns with an Elliott Wave structure, offering insights into potential future price action.
The current bearish sequence is unfolding as a corrective zigzag pattern, labeled ((A))-((B))-((C)). Waves ((A)) and ((B)) have completed, and the Index is now in the ((C)) leg. Wave ((C)) leg subdivides into a strong five-wave impulse to the downside. Based on Fibonacci extensions, the projected target for this decline lies between 85.5 and 94.9. This corresponds to the 100% – 161.8% Fibonacci extension levels from the prior structure. This zone represents a critical support area where buyers may attempt to step in.
In the shorter cycle, the DXY is expected to face resistance in a 3, 7, or 11-swing corrective rally. As long as the pivot at 103.5 holds, the bearish momentum should persist, driving the index toward the Fibonacci target zone. Traders should monitor these levels closely, as a break above 103.5 could invalidate the immediate bearish setup, while continued failures at resistance reinforce the downside bias.
This Elliott Wave outlook suggests the DXY remains vulnerable, with the tariff war’s ripple effects continuing to pressure the dollar. Stay vigilant for price action near the 85.5 – 94.9 range for potential reversal signals.

Daily Analysis- XAUUSD (Tuesday, 22nd April 2024)Bias: Bullish
USD News(Red Folder):
-None
Analysis:
-Current ATH at 2443
-Looking for pullback
-Potential BUY if there's confirmation on lower timeframe
-Pivot point: 3300
Disclaimer:
This analysis is from a personal point of view, always conduct on your own research before making any trading decisions as the analysis do not guarantee complete accuracy.

EUR/USD Analysis: Weekly & Daily Timeframes
In this analysis, I explored the EUR/USD pair, identifying significant patterns and potential trade opportunities. The weekly timeframe shows a strong support level, while the daily chart highlights short-term resistance. Combining these insights with the DXY index, we can better understand market dynamics.

DXY is Strugglig to GrowHey Traders, in today's trading session we are monitoring DXY for a selling opportunity around 102 zone, DXY is trading in a downtrend and currently is in a correction phase in which it is approaching the trend a 102 support and resistance area.
Trade safe, Joe.


Elliott Wave Principles: A Study on US Dollar IndexHello friends, today we'll attempt to analyze the (DXY) US Dollar Index chart using Elliott Wave theory. Let's explore the possible Elliott Wave counts with wave Principles (Rules).
We've used the daily time frame chart here, which suggests that the primary cycle degree in Black weekly wave ((A)) and ((B)) waves have already occurred. Currently, wave ((C)) is in progress.
Within wave ((C)) in Black which are Weekly counts, Subdivisions are on daily time frame, showing Intermediate degree in blue wave (1) & (2) are finished and (3) is near to completion. Post wave (3), we can expect wave (4) up in Blue and then wave (5) down in Blue, marking the end of wave ((C)) in Black.
Additionally, within blue wave (3) Intermediate degree, we should see 5 subdivisions in red of Minor degree, which is clearly showing that waves 1 & 2 are done and now we are near to completion of wave 3 in Red. followed by waves 4 and 5, which will complete blue wave (3).
Key Points to Learn:
When applying Elliott Wave theory, it's essential to follow specific rules and principles. Here are three crucial ones:
1. Wave 2 Retracement Rule: Wave two will never retrace more than 100% of wave one.
2. Wave 3 Length Rule: Wave three will never be the shortest among waves 1, 3, and 5. It may be the largest most of the time, but never the shortest.
3. Wave 4 Overlap Rule: Wave four will never enter into the territory of wave one, meaning wave four will not overlap wave one, except in cases of diagonals or triangles.
Invalidation level is a level which is decided based on these Elliott wave Principles only, Once its triggered, then counts are Invalidated so we have to reassess the chart study and other possible counts are to be plotted
The entire wave count is clearly visible on the chart, and this is just one possible scenario. Please note that Elliott Wave theory involves multiple possibilities and uncertainties.
The analysis we've presented focuses on one particular scenario that seems potentially possible. However, it's essential to keep in mind that Elliott Wave counts can have multiple possibilities.
I am not Sebi registered analyst.
My studies are for educational purpose only.
Please Consult your financial advisor before trading or investing.
I am not responsible for any kinds of your profits and your losses.
Most investors treat trading as a hobby because they have a full-time job doing something else.
However, If you treat trading like a business, it will pay you like a business.
If you treat like a hobby, hobbies don't pay, they cost you...!
Hope this post is helpful to community
Thanks
RK💕
Disclaimer and Risk Warning.
The analysis and discussion provided on in.tradingview.com is intended for educational purposes only and should not be relied upon for trading decisions. RK_Charts is not an investment adviser and the information provided here should not be taken as professional investment advice. Before buying or selling any investments, securities, or precious metals, it is recommended that you conduct your own due diligence. RK_Charts does not share in your profits and will not take responsibility for any losses you may incur. So Please Consult your financial advisor before trading or investing.

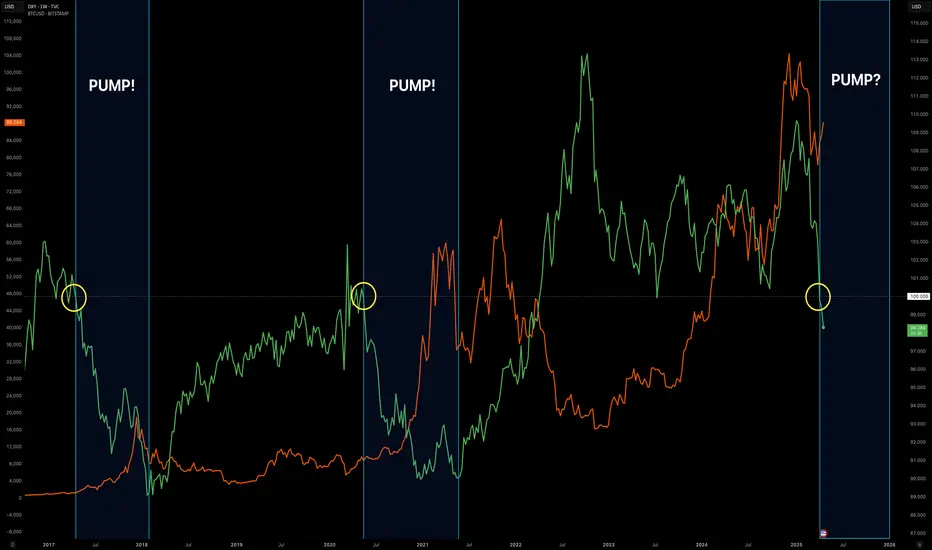
DXY Falling, Bitcoin Pump Imminent?This chart tracks the current decline in the dollar's value and compares it to two instances since 2018 when significant dollar depreciation coincided with sharp increases in Bitcoin's price.
US Dollar Index Decline in Wave C of A FlatTVC:DXY - has been trading lower from the 110 peak in wave "c" of a larger flat. We are currently in the late stages of wave (3) of "c".

DXYU.S Dollar Index
- Breakout of Demand Zone
- Exp FIAT as an corrective pattern in Long Time Frame
- Change of Characteristics
- Break of Structure
- Completed " 12345 " Impulsive Waves and " AB " Corrective Waves

2025 – The Year of the Normalized Dollar (Part Two)📉💵 2025 – The Year of the Normalized Dollar: Part Two 🔄🔥
Part 1:
As we kick off the week on April 21st, we find gold hitting historic highs of $3,400 while the U.S. Dollar Index (DXY) continues to slide — down 1.42% and firmly below the psychological 100 level. 📉 The breakdown at 99.3 confirms what we mapped out months ago.
Back in February, I highlighted the rejection at the 107.5 level and predicted that 2025 would mark The Year of the Normalized Dollar. That vision is unfolding exactly as drawn.
🔍 Technical Breakdown Recap
Rejection Zone: 107.5
Mid Support Breached: 100.95
Breakdown Level: 99.3
Next Target Range: 94.6–93.7 🧭
The visuals attached here are not new drawings — this is the same framework from my February 25th analysis, and it's playing out beautifully. 📊 The DXY is on a structural path toward normalization, aligning with macro policy shifts.
🗣️ Policy Catalyst
The dollar’s weakness isn’t just technical — it’s political and economic. Trump’s continued pressure on the Fed to slash interest rates, combined with tariff talk and geopolitical realignment, is creating a push toward a weaker but more "normalized" dollar.
From the Executive Order remarks on Jan 23, 2025:
“I'd like to see interest rates come down a lot. When oil comes down, prices come down — and then no inflation.”
These aren't just words — they're shaping market expectations and price action.
💬 Is this the soft landing the Fed is hoping for? Or the beginning of something bigger for DXY bears?
Drop your thoughts below and let’s keep the conversation rolling.
🎯 Charts attached for reference.
📢 Follow for more macro breakdowns & chart-focused insights.
One Love,
The FXPROFESSOR 💙

DXY Roadmap April 2025This was the highest likelihood trade based on Trumpian policy and asymmetric positioning at the start of the year. People will never learn it seems

dollar index just as explained in my videos, we can see it has been bearish a some while now, so price action would tell us our right direction on this index. watch and follow for more

2025 – The Year of the Normalized Dollar📉💵 2025 – The Year of the Normalized Dollar! 🔥
The U.S. Dollar Index (DXY) is showing clear signs of weakness after breaching key support levels. With interest rate cuts on the horizon and a shift in economic policy, we may be entering a new phase for the dollar’s normalization.
🔍 Key Levels to Watch
🔹 Resistance: 107.5 (Immediate resistance)
🔹 Key Mid Support: 100.95 (Next major level)
🔹 Final Target: 94.8 (Major support & potential bottom)
📰 Fundamental Factors Driving the Move
💡 Trump’s Dollar Policy: Historically, Trump has favored a weaker dollar to boost exports. His recent remarks during the Executive Order signing on January 23, 2025, reinforce this stance, as he pushes for interest rate cuts and lower energy costs.
Remarks by President Trump at Executive Order Signing (January 23, 2025):
Q: Mr. President, you said earlier that you would like to see interest rates come down.
THE PRESIDENT: Yeah.
Q: How much would you like to see them come down?
THE PRESIDENT: A lot.
Q: And will you talk with Powell?
THE PRESIDENT: I’d like to see them come down a lot, and oil prices will come down. And when oil prices come down, everything is going to be cheaper for the American people — and actually for the world — but for the American people. So, I’d like to see oil prices come down.
Q: Are you worried that there’s too much going on at once if you’re trying to bring interest rates down and get the economy back going?
THE PRESIDENT: No, no. It just works that way. I mean, it just economically works that way. When the oil comes down, it’ll bring down prices, then you won’t have inflation, and then the interest rates will come down.
Q: You said that you would demand that the interest rates come down. Do you expect the Fed to listen to you?
THE PRESIDENT: Yeah.
📉 What’s Next for the Dollar?
🔸 If 100.95 breaks, we could see further downside, testing the 94.8 region.
🔸 A retest of resistance at 107.5 would be a key test before further declines.
🔸 The global macro environment (oil prices, inflation, and geopolitical shifts) will heavily influence the dollar’s trajectory.
🌍 Economic & Geopolitical Impact
Beyond monetary policy, Trump’s trade and labor policies are also playing a role in shaping the inflation outlook. His push for tariffs and tighter immigration policies has led to higher labor costs, causing short-term inflation. However, on the global stage, Trump's potential deal with Putin to resolve the Ukraine conflict could help ease inflation worldwide by stabilizing supply chains and reducing geopolitical risks.
With Trump pushing for rate cuts, the Fed under pressure, and DXY losing momentum, could we see a full-scale dollar correction in 2025? Let’s discuss! ⏬
📢 Follow for more macro insights & market analysis!
One Love,
The FXPROFESSOR 💙

.DXY M30 ANALYSIS UPDATES
🕒 **DXY M30 Analysis**
📉 Price touched the **support zone** at **97.70 – 97.78** after a strong sell-off.
🔁 A **potential reversal** is forming at this level – key area to watch!
📈 If bulls take control, next targets:
- 🔹 **98.60** (interim resistance)
- 🔹 **99.62 – 99.70** (major resistance zone)
⚠️ Keep an eye on price action around 98.06 – confirmation needed before any long entries.
#DXY #M30 #ForexAnalysis #USD #ReversalZone 🚀📊
--

Dollar has next 4 years (Be greedy when others are fearful)The world is changing fast, and the next four years may be strong for the U.S. dollar . This is not random— it's part of a cycle . Greed-fear cycle
Right now, humanity is entering a time where AI will take over most service-based jobs . Lawyers, designers, consultants—even coders—are slowly being replaced by machines. The entire service economy is becoming automated.
When that happens, only countries with real manufacturing will survive.
That’s why what President Trump said earlier about “bringing back manufacturing” makes full sense now.
When services become automated, tangible assets rise.
And the dollar may lead this shift.

DOLLARThe U.S. Dollar Index (DXY) has fallen below the 100 mark in April 2025 due to a combination of trade tensions, shifting investor sentiment, and concerns over the U.S. economic outlook and Federal Reserve policy. Key reasons include:
1. Trade War and Tariff Impact
President Donald Trump's imposition of aggressive tariffs (e.g., 145% on Chinese imports) and China’s retaliatory tariffs have sparked fears of a full-blown global trade war. This has unsettled financial markets, leading investors to reduce exposure to U.S. assets and the dollar.
The tariffs have disrupted trade flows, increased inflationary pressures, and raised concerns about slower economic growth in the U.S., which undermines the dollar’s appeal.
2. Declining Safe-Haven Demand
Traditionally, the dollar benefits as a safe-haven currency during global uncertainty. However, in 2025, investors are increasingly turning to gold, which hit record highs above $3,300and headed to 3400 as an alternative safe haven. This shift reflects doubts about the dollar’s reliability amid trade tensions and fiscal imbalances.
3. Concerns Over U.S. Economic Growth and Recession Risks
Rising fears of a U.S. recession, fueled by tariff-induced economic headwinds and slowing corporate earnings, have dampened confidence in the dollar.
The Federal Reserve’s cautious stance and signals of potential rate cuts later in 2025 have also contributed to weakening the dollar, as lower interest rates reduce the currency's yield advantage.
4. Political and Policy Uncertainty
Market unease has been heightened by President Trump’s public threats to remove Fed Chair Jerome Powell, raising concerns about the Fed’s independence and future monetary policy direction.
Political noise and uncertainty over trade negotiations, especially with China, have further pressured the dollar.
5. Technical and Market Sentiment Factors
Technically, the DXY has broken below key support levels, including the 200-day simple moving average (~104.6) and the psychologically important 100 level, signaling bearish momentum.
Summary Table of Factors Driving DXY Below 100
Factor Impact on DXY
Trade War Tariffs = Reduced dollar demand, increased volatility
Shift to Gold as Safe Haven= Dollar loses safe-haven status
U.S. Economic Slowdown Fears= Weaker growth outlook dampens dollar strength
Fed Policy Uncertainty = Rate cut expectations reduce dollar yield
Political Risks = Fed independence concerns add to uncertainty
Technical Breakdown = Breach of key supports fuels bearish momentum
Conclusion
The DXY’s fall below 100 reflects a complex mix of trade-related economic risks, diminished safe-haven demand, political uncertainty, and expectations of a more dovish Federal Reserve. Unless these issues ease—such as through trade deal progress, clearer Fed guidance, or economic stabilization—the dollar is likely to remain under pressure in the near term.

DXY BEARISH LONG TERM I've been in this trade since January, thought I posted it. Anyways Longterm its bearish to 85K region if price doesn't close strong the redline

Bearish sentiment on the USD index (DXY)TVC:DXY
On this trading week (April 14-18), we have not seen much volatility in the USD index, with its highest trading point at approximately 100.3 and lowest 99.2, partly due to a long bank holiday for Good Friday and Easter on the following Monday. On last week's Friday, price briefly tapped into the weekly demand zone and gave a quick reaction upwards to the 4-hour supply zone, which then quickly rejected and cooled price back down. Currently, price is still sitting at the lower point of the weekly range, we can expect DXY to have a very short-term push back to this strong 4-hour swap zone above, possibly creating a higher high, before pushing it back down. Price is very likely to take out the weekly lows and continue to push towards the bottom of the weekly demand zone.
On fundamentals, Bank of America's analysts had identified close relationship of its depreciating USD, with its falling US asset and equities values. Economic activities have also declined due to trade wars and huge uncertainty of the upcoming policy changes by the Trump administration; asset managers and central banks may also continue to sell USD. Besides, the US is very likely to continue reducing its interest rates in order to boost its economic activity. One of the reasons why Trump imposed high tariffs into many countries was to reduce international dependency on the manufacturing sector and trade deficits, and to attract foreign investments to set up factories in the US, in order to sell to consumers at the 'good price'. However, it is still very controversial on how effective it is, business owners abroad may perceive Trump's policies as bipolar, which changes depending on his mood, therefore, majority of businesses would rather partner elsewhere than to put themselves through this hassle. USD has also dropped 10% since the start of 2025 and has reached its lowest in three years.
References:
www.investing.com
www.cbsnews.com

Bearish drop?US Dollar Index (DXY) has reacted off the pivot and could drop to the 1st support.
Pivot: 100.22
1st Support: 97.47
1st Resistance: 101.83
Risk Warning:
Trading Forex and CFDs carries a high level of risk to your capital and you should only trade with money you can afford to lose. Trading Forex and CFDs may not be suitable for all investors, so please ensure that you fully understand the risks involved and seek independent advice if necessary.
Disclaimer:
The above opinions given constitute general market commentary, and do not constitute the opinion or advice of IC Markets or any form of personal or investment advice.
Any opinions, news, research, analyses, prices, other information, or links to third-party sites contained on this website are provided on an "as-is" basis, are intended only to be informative, is not an advice nor a recommendation, nor research, or a record of our trading prices, or an offer of, or solicitation for a transaction in any financial instrument and thus should not be treated as such. The information provided does not involve any specific investment objectives, financial situation and needs of any specific person who may receive it. Please be aware, that past performance is not a reliable indicator of future performance and/or results. Past Performance or Forward-looking scenarios based upon the reasonable beliefs of the third-party provider are not a guarantee of future performance. Actual results may differ materially from those anticipated in forward-looking or past performance statements. IC Markets makes no representation or warranty and assumes no liability as to the accuracy or completeness of the information provided, nor any loss arising from any investment based on a recommendation, forecast or any information supplied by any third-party.

DXY bullish Here is my technical analysis on dxy and it's very looking bullish from a high timeframe of monthly to till to 4h. Buy dxy at current market.

Dollar index (DXY) Analysis DXY Analysis – General Outlook
This week’s analysis is more of a general overview, and it closely aligns with my view on EUR/USD. While I don’t trade DXY directly, I use it heavily as a confluence tool, so marking out its likely direction is key for aligning trades across other USD-related pairs.
At the moment, I’m favouring Scenario A, where I expect DXY to move a bit lower, accumulate, and then react from the 2-day demand zone. If that happens, we could see a bullish move on DXY, which would naturally result in bearish pressure for other pairs like EU and GU.
However, if price decides to retrace upwards first, there’s a clean supply zone that still needs to be mitigated. If that zone holds, DXY could continue its bearish structure for longer—meaning more bullish momentum across other major pairs.
