DXY Tests Key Support – What’s Next for the Dollar?
The U.S. Dollar Index (DXY), which tracks the dollar’s performance against a basket of major currencies, recently broke below its 50-month moving average based on the monthly chart —a significant technical signal. After this drop, the index is now bouncing off a key support zone near 96.50.
This area has acted as a pivot point in past cycles, and a sustained bounce could indicate the dollar regaining strength. If risk sentiment fades—due to weaker equity markets, geopolitical tensions, or stronger U.S. data—the dollar might find new momentum.
On the flip side, failure to hold 96.50 could open the door toward the 90.00 zone, a major long-term support level. Such a move would likely reflect expectations of looser U.S. monetary policy or further deterioration in economic confidence.
For now, price action near 96.50 will be decisive. A rebound could shift sentiment back in favor of the dollar, while a deeper decline may trigger broader adjustments in FX markets. Traders should closely monitor upcoming macro data and risk sentiment for cues on the next leg.
USDX trade ideas
DXY Jul. 11The information and publications are not meant to be, and do not constitute, financial, investment, trading, or other types of advice or recommendations.
Have a nice day ahead.

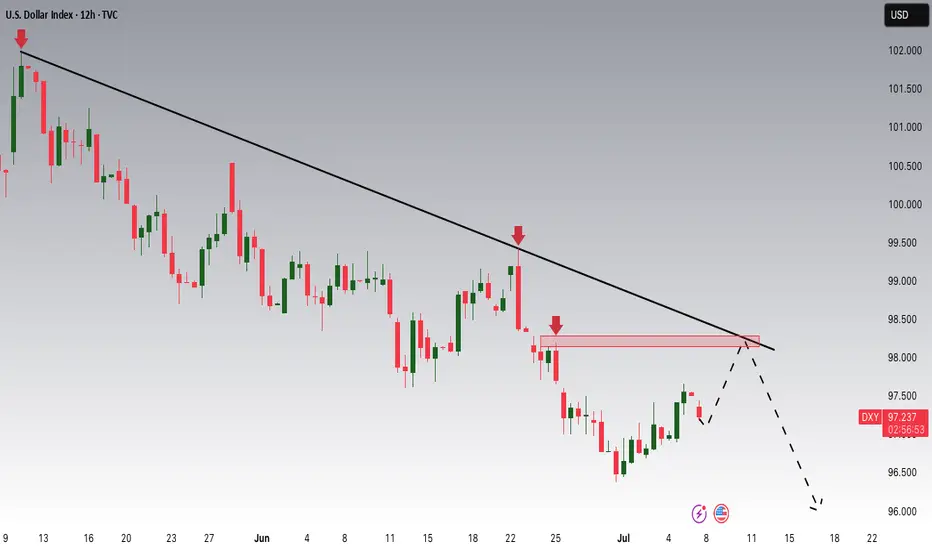
Bold analysis for the most powerful currency in the world (DXY)Orange range: entering in several steps .
Green area: important support and exit point .
Important note: The gray line is the liquidity range
Watch the dance around this line carefully (bank positions are settled around this line)
And in my opinion, by increasing the price, they are emptying it on the buyers, so buy cautiously, but sell boldly.
GL


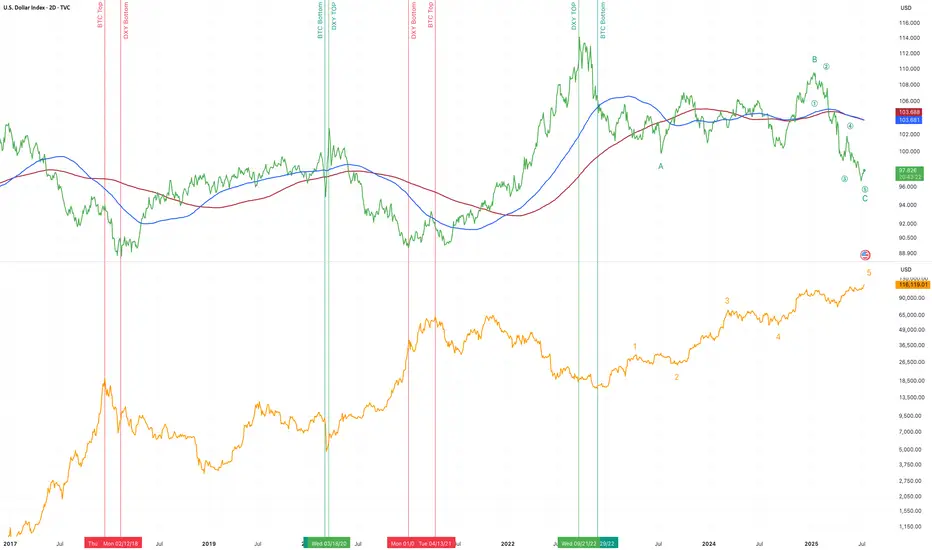
BTC vs DXYThe correlation between these two charts is striking. Now, both DXY and BTC have very completed patterns with BTC pretty high and DXY pretty low. Based on this chart it seems at least plausible that BTC should be topping in the next couple of months.
US interest rate reduction?!As you can see, the US dollar index has completed a 5-wave uptrend and after touching the top of the uptrend channel and breaking the uptrend line, it is currently in the second correction wave. I expect to see the beginning of the third correction wave soon. This may coincide with the reduction of the US interest rate in next week!!

Dollar Index AnalysisTwo possibilities for the dollar index has been shown here. We can see that dollar index is showing a short term uptrend. Which is clearly visible from the chart.
1: Dxy can maintain this short term uptrend. Because it is a monthly pullback. As it has been
for last 5 months.
2: Dxy can change character and again touches to the monthly demand zone as shown in my
previous video.

Dollar Index Analysis [DXY]Market has show upper wicks for last 3 days which is the sign that there is still sell pressure. The daily candles for this week are range bound. 4H chart is showing short term uptrend which is maintaining higher highs and higher lows. We can use this range to have scalps in this range.

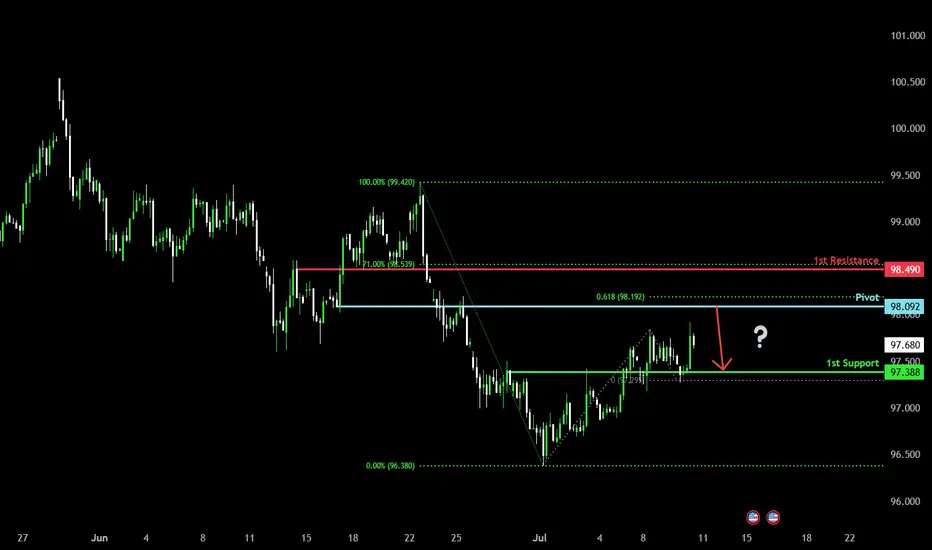
Could the price reverse from here?US Dollar Index (DXY) is rising towards the pivot and could reverse to the 1st support which acts as an overlap support.
Pivot: 98.09
1st Support: 97.38
1st Resistance: 98.49
Risk Warning:
Trading Forex and CFDs carries a high level of risk to your capital and you should only trade with money you can afford to lose. Trading Forex and CFDs may not be suitable for all investors, so please ensure that you fully understand the risks involved and seek independent advice if necessary.
Disclaimer:
The above opinions given constitute general market commentary, and do not constitute the opinion or advice of IC Markets or any form of personal or investment advice.
Any opinions, news, research, analyses, prices, other information, or links to third-party sites contained on this website are provided on an "as-is" basis, are intended only to be informative, is not an advice nor a recommendation, nor research, or a record of our trading prices, or an offer of, or solicitation for a transaction in any financial instrument and thus should not be treated as such. The information provided does not involve any specific investment objectives, financial situation and needs of any specific person who may receive it. Please be aware, that past performance is not a reliable indicator of future performance and/or results. Past Performance or Forward-looking scenarios based upon the reasonable beliefs of the third-party provider are not a guarantee of future performance. Actual results may differ materially from those anticipated in forward-looking or past performance statements. IC Markets makes no representation or warranty and assumes no liability as to the accuracy or completeness of the information provided, nor any loss arising from any investment based on a recommendation, forecast or any information supplied by any third-party.
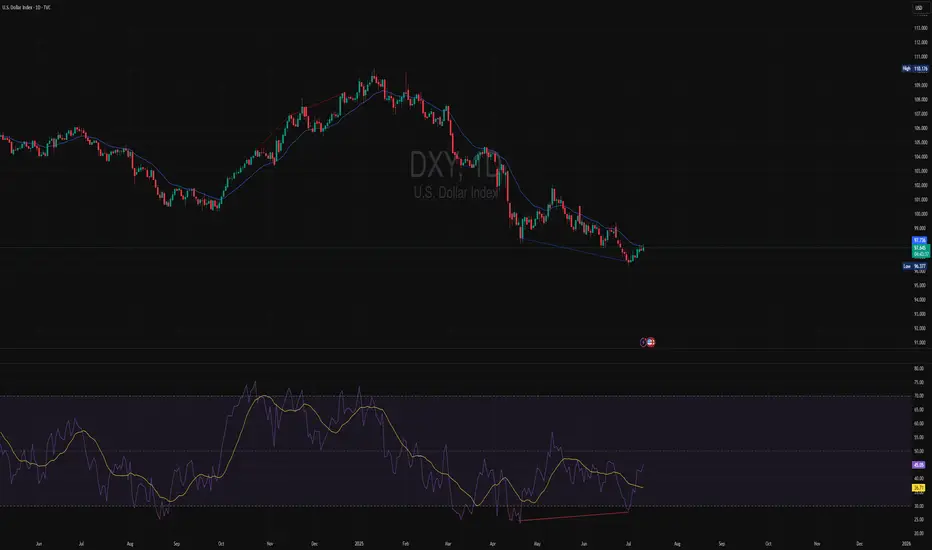
DXY-Technical Analysis DAILY Timeframe 📊 DXY – Technical Analysis (1D Timeframe)
🔷 Overall Trend:
The Dollar Index (DXY) has been in a strong downtrend for several months, forming multiple confirmed Breaks of Structure (BOS) to the downside.
However, recent price action is showing signs of momentum loss and potential exhaustion from sellers near the current lows.
🟡 Market Structure:
Price recently formed a lower low, but momentum indicators are showing bullish divergence — suggesting the downward pressure is weakening.
A small bullish reversal candle has printed, indicating potential short-term buying interest.
There is no confirmed bullish CHoCH yet, but structure is starting to slow down and compress — signaling a possible shift.
📉 Indicators (RSI ):
RSI is rebounding from oversold territory, showing potential early reversal signals.
The confirms bullish divergence and shows fading bearish momentum.
Overall, sellers are showing reduced strength, increasing the chance of a corrective move to the upside.
🔹 Key Levels:
Immediate resistance zones:
🔹 97.23 and 97.73 — key levels to watch for bullish continuation.
Major support:
🔻 96.34 – 96.50 — current low area that if broken, will confirm further downside.
✅ Conclusion:
While DXY remains structurally bearish, the recent bullish divergence, loss of selling momentum, and RSI recovery suggest the potential for a short-term correction or bounce.
A confirmed CHoCH and break above 97.73 would signal a potential shift to bullish structure.
If price fails to break resistance and drops below 96.34, the bearish trend is likely to continue.
🟢 Scenario Table:
Scenario Trigger Implication
Bullish shift Break above 97.73 with CHoCH Potential trend reversal
Continuation bearish Break below 96.34 Downtrend continuation
Disclaimer: This analysis is for informational and educational purposes only. It does not constitute financial advice or a recommendation to buy or sell any asse
"DXY Bullish Setup – High Probability Trade!"🚨 "DXY DOLLAR BANK HEIST" – THIEF TRADING STYLE MASTER PLAN (HIGH-IMPACT TRADE ALERT!)
🔥 "Steal the Market Like a Pro – This DXY Heist Could Print Serious Cash!" 🔥
🌍 Greetings, Market Pirates & Profit Raiders! 🌍
🤑 "Money isn’t made… it’s TAKEN!" 💰💸
Based on the 🔥 Thief Trading Style 🔥 (a lethal mix of technical + fundamental + psychological warfare), we're executing a DXY Dollar Index Bank Heist—a high-stakes robbery where YOU get to keep the loot!
📜 THE HEIST BLUEPRINT (TRADE PLAN)
🎯 ENTRY ZONE – "BREAK THE VAULT DOOR!"
📍Key Trigger: Wait for price to SMASH through the Moving Average Wall (97.700) – then STRIKE!
🔪 Thief’s Entry Trick:
Buy Stop Orders above MA (aggressive)
Buy Limit Orders near recent swing low (smart pullback play)
DCA/Layering Strategy for max profit extraction (real robbers scale in!)
🚨 ALERT SETUP: "Don’t miss the breakout – set an ALARM!" ⏰
🛑 STOP LOSS – "DON’T GET CAUGHT!"
"Yo, rookie! If you’re entering on a breakout, WAIT for confirmation before placing SL!"
📍Thief’s SL Zone: 97.400 (30min swing low – adjust based on your risk appetite!)
⚠️ WARNING: "Place it wrong, and the cops (market) will lock YOU up!" 🚔
🎯 TARGET – "ESCAPE WITH THE LOOT!"
🏆 Primary Target: 98.350 (Take profits before the resistance police show up!)
🔄 Scalper’s Bonus: "Trail your SL, squeeze every pip!"
💡 Pro Tip: "If you’re underfunded, ride with the swing traders – teamwork makes the dream work!"
💣 WHY THIS HEIST WILL WORK (MARKET DYNAMICS)
✅ Bullish Momentum Building (DXY showing strength!)
✅ Overbought? Maybe… but thieves don’t wait for permission!
✅ Trend Reversal Potential (Big money shifting!)
✅ Police (Resistance) Trap Ahead (Escape before they catch you!)
📡 NEWS & RISK MANAGEMENT (DON’T GET BUSTED!)
🚨 High-Impact News? AVOID new trades! (Use trailing stops to lock profits!)
📊 Check COT Reports, Macro Data, Geopolitics (Smart thieves do their homework!)
💥 BOOST THIS HEIST – LET’S GET RICH TOGETHER!
👊 "Hit the LIKE & BOOST button to fuel our next heist!"
💖 "More boosts = More robberies = More FREE money for YOU!" 🚀
⚠️ DISCLAIMER (LEGAL SPEAK)
"This ain’t financial advice – just a damn good robbery plan. Trade at your own risk, and don’t cry if you ignore the SL!" 😎
🔔 Stay tuned for the next heist… The market’s our playground! 🏴☠️💰
🚀 "See you at the next breakout, thief!" 🚀
🔥 #DXY #Forex #Trading #BankHeist #ThiefTrading #ProfitPirates #MakeMoney #TradingView #SmartMoney 🔥

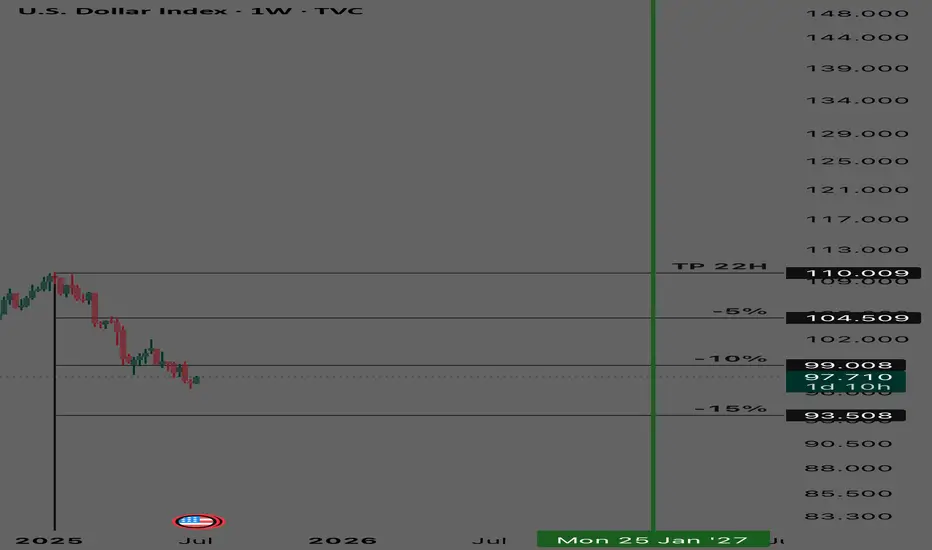
DXY - Long Term Buy Cycle DXY
Long term buy cycle
Started January 2025
TP 110
% Bubble Ratio
Currently in a negative bubble with a fair value at 110
DXY - MonthlyEvery breakdown in the past the DXY had a steep decline. Not really a period where it has continued to fluctuate at a certain level. I think it might be plausible that this pattern will continue to repeat itself.

Dollar I Daily CLS I KL - OB I Model 1Yo Market Warriors ⚔️
Fresh outlook drop — if you’ve been riding with me, you already know:
🎯My system is 100% mechanical. No emotions. No trend lines. No subjective guessing. Just precision, structure, and sniper entries.
🧠 What’s CLS?
It’s the real smart money. The invisible hand behind $7T/day — banks, algos, central players.
📍Model 1:
HTF bias based on the daily and weekly candles closes,
Wait for CLS candle to be created and manipulated. Switch to correct LTF and spot CIOD. Enter and target 50% of the CLS candle.
For high probability include Dealing Ranges, Weekly Profiles and CLS Timing.
Trading is like a sport. If you consistently practice you can learn it.
“Adapt what is useful. Reject whats useless and add whats is specifically yours.”
David Perk aka Dave FX Hunter
💬 Don't hesitate to ask any questions or share your opinions

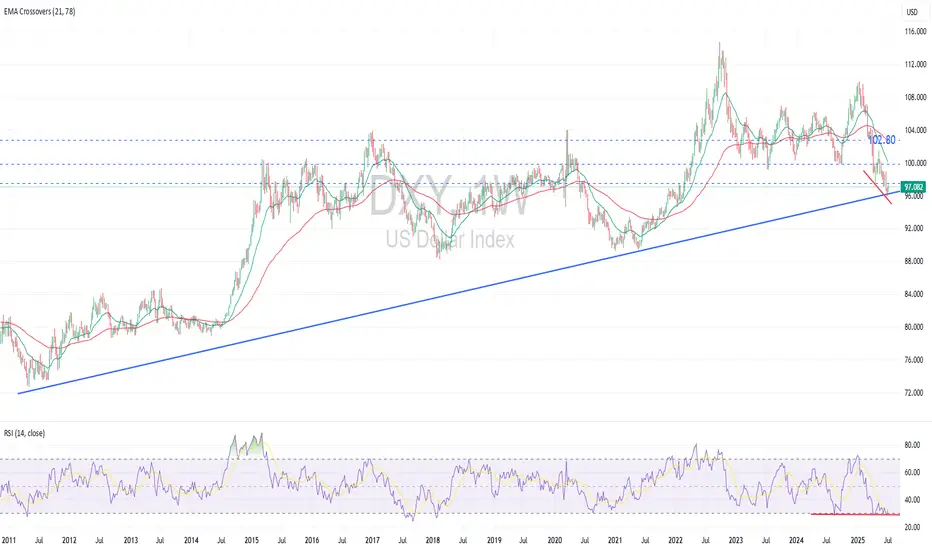
DXY may rebound significantly soonDXY Likely to Rebound Significantly Soon
Technical Perspective:
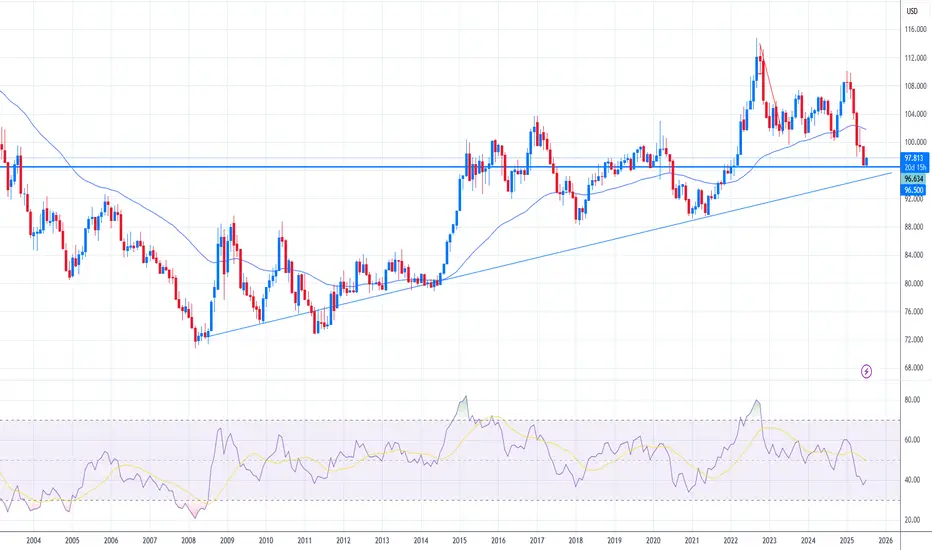
DXY recently broke below its previous low, forming a lower low, with both EMAs signaling a downtrend. However, the price has now reached a 14-year-old long-term ascending trendline support , which reflects the strength and effectiveness of this tool. So, we can expect a reaction at this line. Additionally, the RSI has entered the oversold zone (for the third time) and a Bullish Divergence has formed, supporting the possibility of a rebound in DXY in the near term.
However, any rebound may only be short-lived due to the recent strong bearish momentum and the steepness of the downtrend. A pullback following the rebound may occur, possibly retesting the ascending trendline before a more sustained trend reversal can take place (unless the price breaks below the trendline, which would indicate a bearish continuation following the prevailing downtrend).
The rebound, if it happens here, can target around the psychological level near 100 ±1 before pulling back again, which, if the pullback in the next shot does not result in a new low, it could signal the end of the downtrend, though this may take some time to materialize. (Please do not forget that we are looking at a weekly timeframe where each leg may take weeks or even months)
Hence, this level may mark the bottom of the current DXY downcycle or, at the very least, trigger a significant rebound.
Fundamental Perspective:
The key factor behind recent US dollar weakness has been President Trump's tariff policies, which have raised concerns over US assets. However, negotiations with major trade partners have been progressing, and many are nearing resolution. This is helping reduce investor concerns over a potential disruption to the global economic system.
The market appears to have passed its peak panic phase. Thus, further downside surprises are unlikely, as Treasury Secretary Scott Bessent recently remarked, the reciprocal tariffs announced are currently at the highest level. Over time, markets are expected to start pricing out the concerns, which could lead to a rebound in the US dollar.
An overlooked risk is the sizable US government bond maturities from June to August 2025, which may strain rollover demand. A smooth passage of this period could restore dollar confidence and support DXY. (This suggests that the reversal may take 1–3 months before a clear uptrend emerges.)
Some may argue that potential Fed rate cuts may pressure the dollar, but with two cuts largely priced in, the impact could be limited. A rebound may follow as markets shift from "buy the rumor, sell the fact."
Finally, please remember that President Trump’s tariff policies are aimed at reducing the US trade deficit—an objective that is likely to be met. As the effects of tariffs start to show in trade balance data by Q4 or beyond, confidence in the US dollar could return, accelerating DXY's recovery momentum.
Call for Action: This zone presents potential for accumulating positions due to a potential reversal, for both short-term and long-term investors, with the added advantage of a high risk-reward ratio.
Analysis by: Krisada Yoonaisil, Financial Markets Strategist at Exness
DXYInstitutions are currently holding a net short position on the Dollar, indicating bearish sentiment. With a net position of -4,282, we may expect continued weakness in the DXY, especially if price reacts from key supply zones. Swing traders should remain cautious with long setups and prioritize opportunities aligned with USD weakness across major pairs.

Forex Weekly Round-Up: DXY, GBPUSD, EURUSDKey Price Zones (DXY): 97.422 - 97.685
🟦 DXY (Dollar Index):
On paper, USD had a strong week:
🔹 Durable Goods smashed expectations (+8.6% vs 0.5%)
🔹 PMIs, GDP Price Index, and Jobless Claims came in solid
But the market ignored it:
🔻 Consumer Confidence disappointed (93.0 vs 99.4)
🏠 New Home Sales missed
🕊️ Fed Chair Powell stayed soft — no aggressive tightening talk
Result?
Despite strong fundamentals, DXY broke down, sweeping daily lows and printing fresh bearish structure.
It’s now down ~10% YTD — the worst first half in over 50 years.
📈 EURUSD & GBPUSD: Holding Strong Despite Weak Data
EURUSD
German Retail Sales: –1.6%
Import Prices: –0.7%
ECB tone: muted
Still, EURUSD held daily support and gained — thanks to broad USD weakness.
GBPUSD
Current Account widened (–£23.5B), GDP unchanged
No standout UK catalyst
Yet GBPUSD held its ground and edged higher as DXY continued to fall.
🧠 What This Tells Us
Strong data isn’t always enough.
When price action, market sentiment, and liquidity targets align — they override the numbers.

Dollar Index AnalysisDollar Index has been in continuous sell for last 5 Months. Has hit the demand zone and giving a pull back and short term trend in daily and 4H charts. From the 4H charts we can see that it is in short term uptrend move and has pushed higher and it is giving a pull back which is visible.

US dollar RSI divergence on the weekly TFWeekly RSI div right into weekly demand. Likely the dollar finds a bottom here

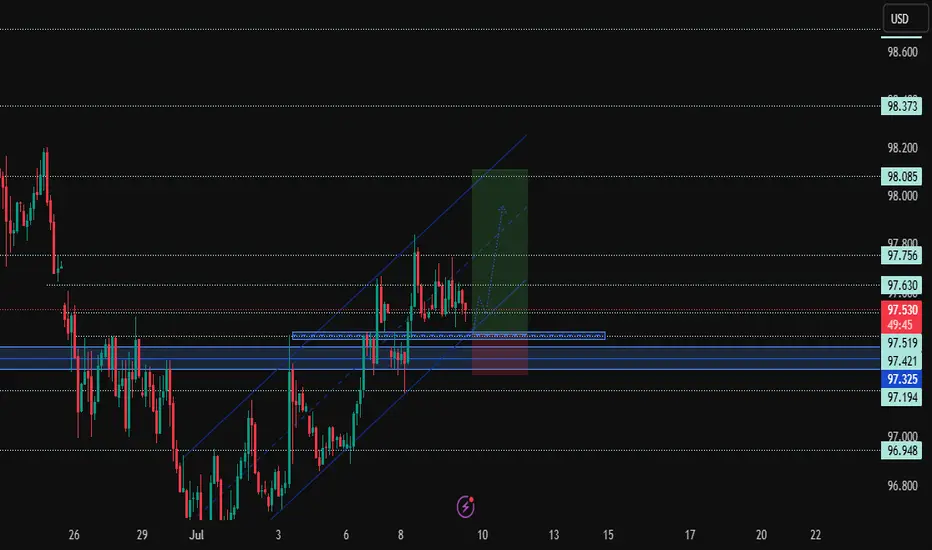
DXY Holds Above Channel Support: Next Leg Higher?Hey Traders,
The U.S. Dollar Index (DXY) is consolidating just above a strong support cluster around 97.325, aligned with ascending channel structure and historical demand. Price action is suggesting a potential bullish continuation if this support zone holds firm.
Current Market Conditions:
* DXY is trading within a well-defined ascending channel, maintaining higher highs and higher lows.
* Price is currently hovering above the 97.325 key support area and mid-channel dynamic trendline.
* Recent candles show rejection from the lower boundary of the bullish channel, indicating buyers may be stepping in again.
* Structure remains bullish unless price closes decisively below 97.325.
Fundamental Analysis/Outlook:
The dollar remains buoyed by persistent inflation pressures and Fed Chair Powell’s continued hawkish tone. Markets are pricing in fewer rate cuts in the near term, reinforcing USD strength. Today’s USD resilience is also supported by mild risk-off sentiment ahead of U.S. CPI data and Powell’s congressional testimony, which could further move the greenback.
Targets:
* TP1: 97.756
* TP2: 98.085
* TP3: 98.373
Risk Management:
* Stop-loss: Below 97.325 to invalidate bullish structure.
* Risk-to-Reward (R\:R): Minimum 1:2 setup. Consider adjusting position size based on support behaviour and macro event volatility.
Technical Outlook:
* Price needs to hold above 97.421–97.325 zone to maintain bullish bias.
* Watch for bullish engulfing or momentum candles as confirmation for long setups.
* A break above 97.630 could accelerate the rally toward higher resistance at 98.373.
Conclusion:
DXY is at a decision point. If bulls maintain control above 97.325, the index could push higher toward the 98.00+ zone. Keep an eye on U.S. economic data and Fed commentary for directional confirmation.
Sign-off:
“In markets, clarity often lies just beyond the fear. Trade the levels, not the noise.”
💬 Let me know your thoughts in the comments, and don’t forget to boost and follow for more insights. Trade safe!
DXY Potential DownsidesHey Traders, in today's trading session we are monitoring DXY for a selling opportunity around 98 zone, DXY is trading in a downtrend and currently is in a correction phase in which it is approaching the trend at 98 support and resistance area.
Trade safe, Joe.

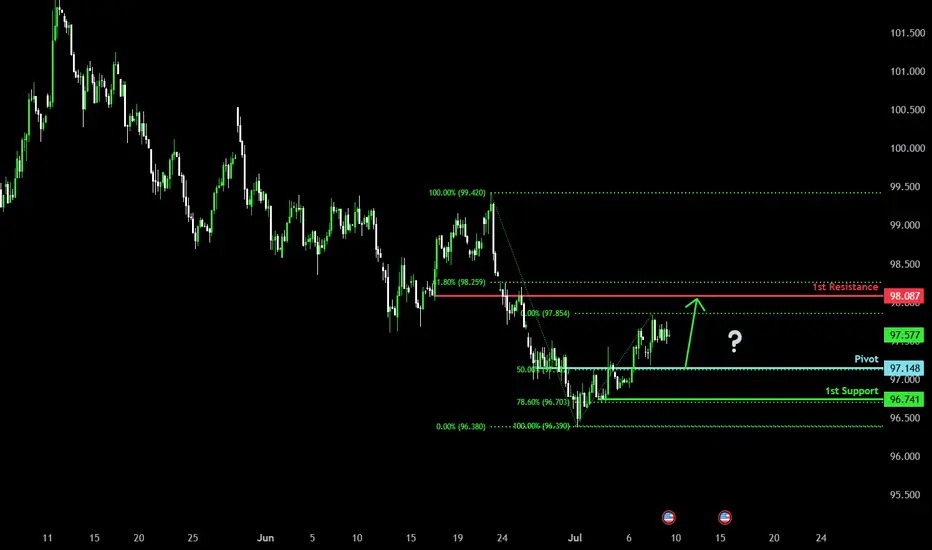
Bullish bounce off major support?US Dollar Index (DXY) is falling towards the pivot which has been identified as an overlap support and could bounce to the 1st resistance.
Pivot: 97.14
1st Support: 96.74
1st Resistance: 98.08
Risk Warning:
Trading Forex and CFDs carries a high level of risk to your capital and you should only trade with money you can afford to lose. Trading Forex and CFDs may not be suitable for all investors, so please ensure that you fully understand the risks involved and seek independent advice if necessary.
Disclaimer:
The above opinions given constitute general market commentary, and do not constitute the opinion or advice of IC Markets or any form of personal or investment advice.
Any opinions, news, research, analyses, prices, other information, or links to third-party sites contained on this website are provided on an "as-is" basis, are intended only to be informative, is not an advice nor a recommendation, nor research, or a record of our trading prices, or an offer of, or solicitation for a transaction in any financial instrument and thus should not be treated as such. The information provided does not involve any specific investment objectives, financial situation and needs of any specific person who may receive it. Please be aware, that past performance is not a reliable indicator of future performance and/or results. Past Performance or Forward-looking scenarios based upon the reasonable beliefs of the third-party provider are not a guarantee of future performance. Actual results may differ materially from those anticipated in forward-looking or past performance statements. IC Markets makes no representation or warranty and assumes no liability as to the accuracy or completeness of the information provided, nor any loss arising from any investment based on a recommendation, forecast or any information supplied by any third-party.