US Dollar Index forum
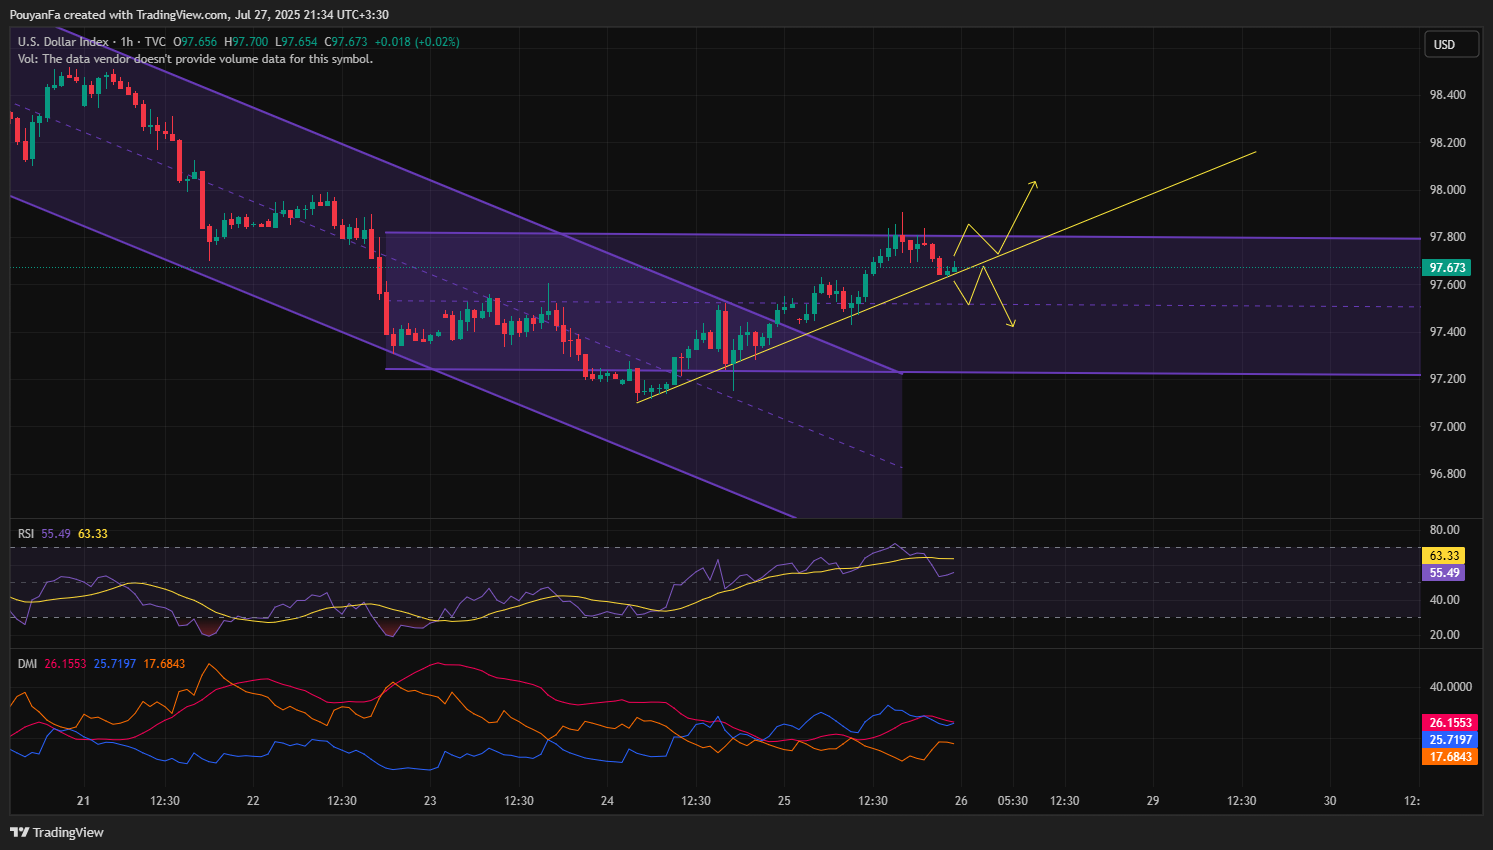
Sell 97.00 monday thuesday
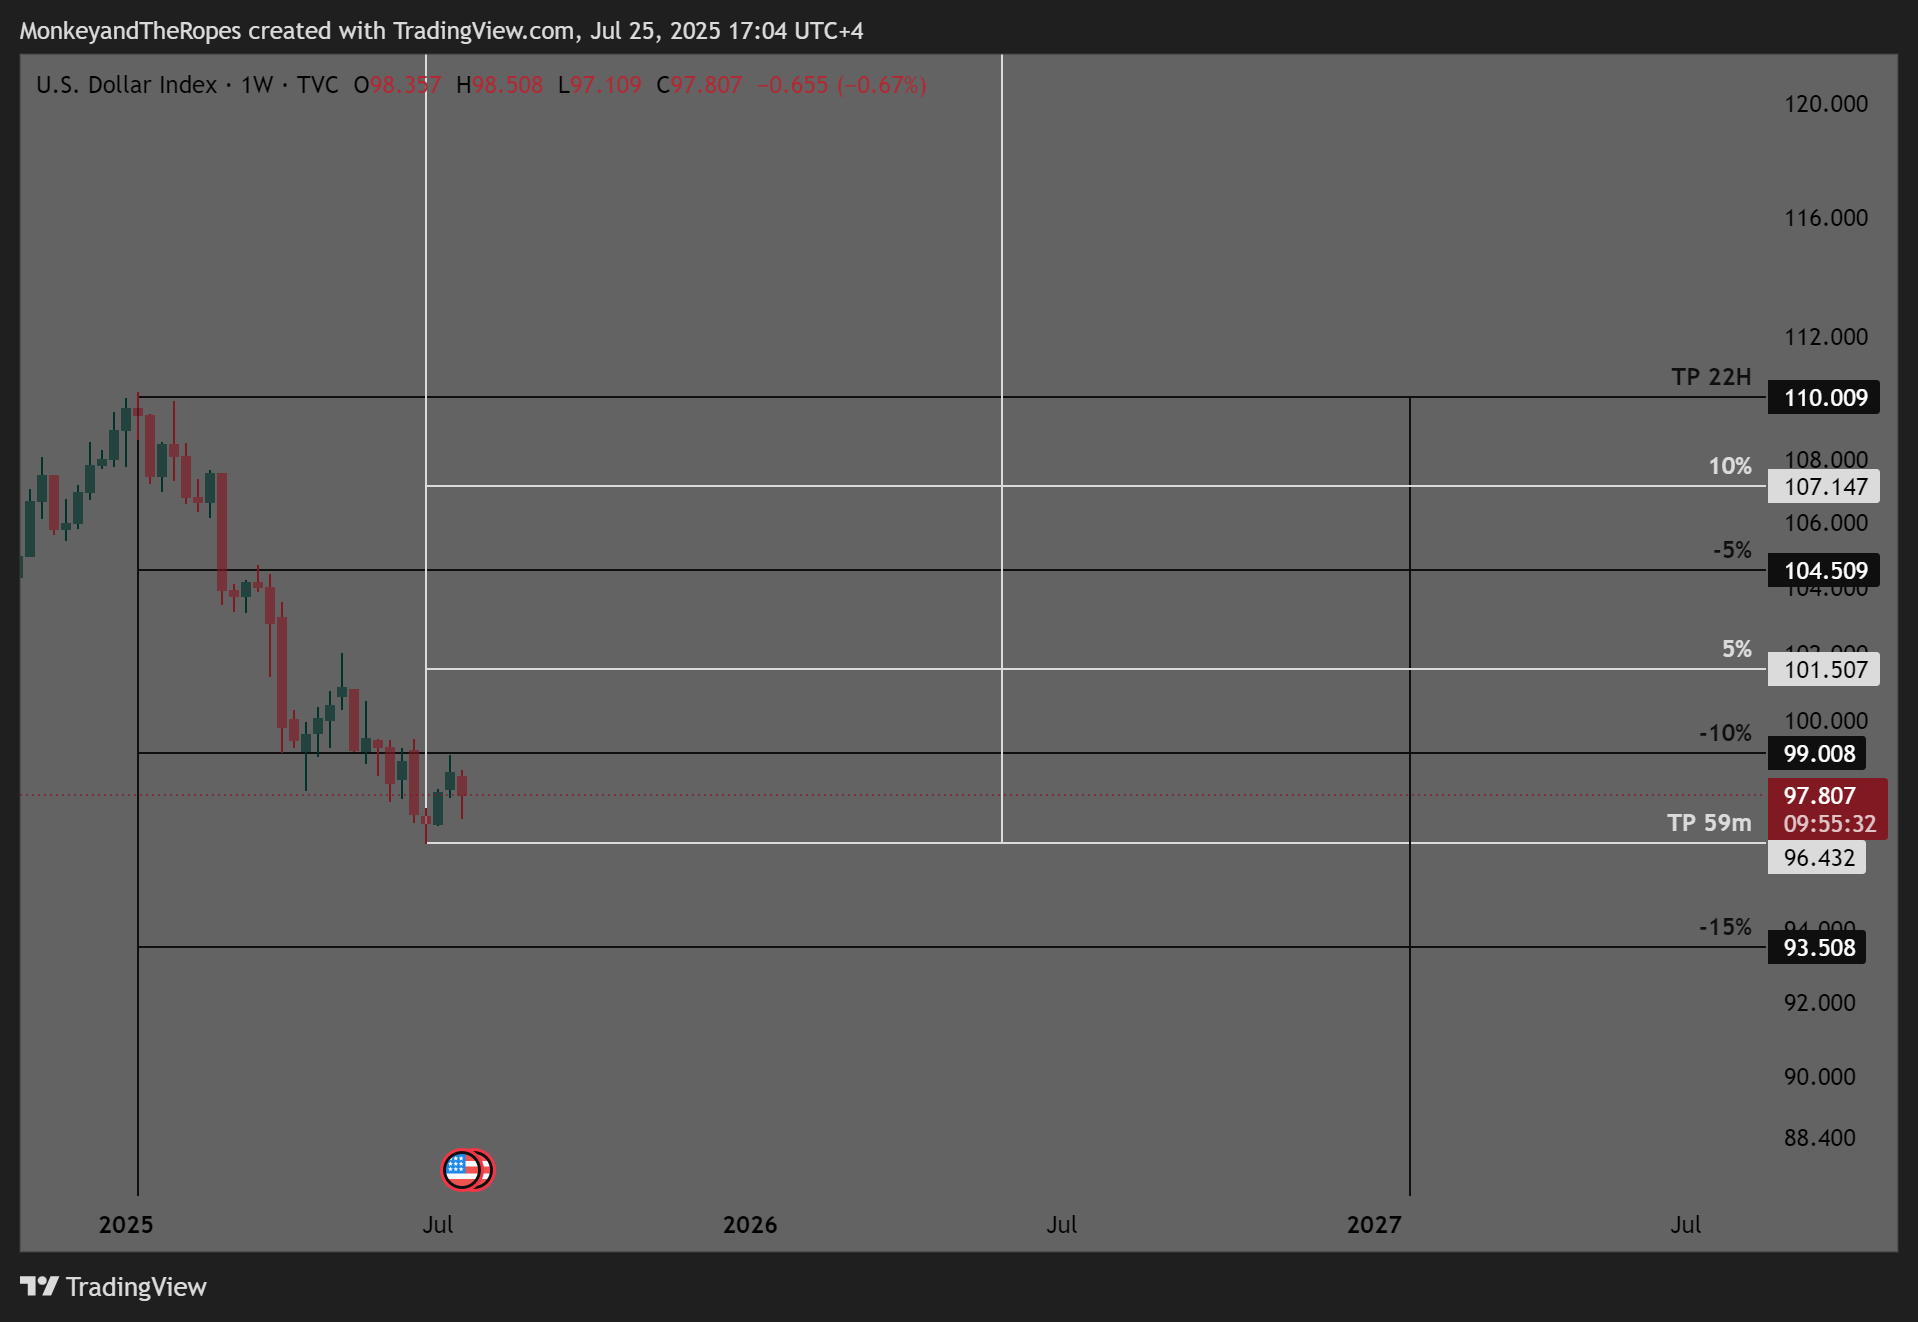
Beware
1- long term buy cycle (black lines)
2- midterm sell cycle (white lines)
% bubble ratio

As global markets show signs of overheating, the US Dollar Index (DXY) may be gearing up for its next big breakout — just like in past crises.
📈 DXY breakout likely above 106, targeting 110–112 in Aug–Oct 2025, driven by:
🔁 Historical Parallels:
2008: Global Financial Crisis → DXY +25%
2015: China slowdown + Fed hike → DXY +16%
2020: COVID panic → DXY surged short-term
2022: Inflation + war in Ukraine → DXY hit 20-year high (~114)
📊 Current Drivers (2025):
Fed holding rates steady while others prepare to cut
Trump-era tariff fears returning → inflation risk
Global equities & crypto topping → flight to safety
Capital flowing into USD as the global reserve
🎯 Strategy:
Long bias above 106
Target: 110+
Hedge against equity/FX volatility
The dollar rises when the world panics — and August–October has a history of fear.