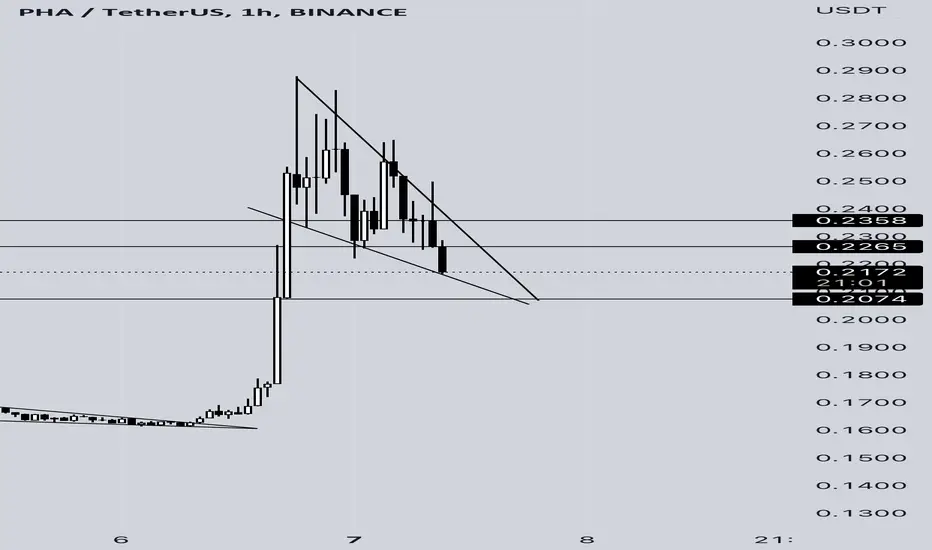
PHAUSDT Hit targets and hit 90% 🚀🤑#PHAUSDT
we published and shared this idea with you in our profile here as you can check the previous analysis for #INJUSDT
and this analysis gave really good and massive profits
Target 3️⃣ : done✅
Entry price: 0.117$✅
Price reached : 0.2224$ ✅
Profit: 90% ✅🚀🚀🚀🤑
Thank you, and for more ideas, hit "Like" and "Follow"!
You may also TELL ME in the comments section which symbol you want me to analyze next and on which time-frame. The one with the most posts will be published tomorrow! 👏🎁
PHAUSDT trade ideas

Seems Like Pha Time Has come Approaching Towards Major Trendline Incase Of breakout Expecting Massive bulish Wave
Incase Of successful Breakout Expecting 180 To 200% bulish Move Keep Eyes On for breakout
Note Please Always Wait for confirmed Breakout


PHA USDT TODAYpply your own risk management.
hunt the profits at any level you see convenient for you.
Green Zone for entry,
Red Level Exit,
Yellow levels are targets.
have a good day guys.

PHANot the best R:R. But a good trade regardless due to good volume, ETH pumping, price being at a lower volume profile.


PHAUSDTlong long long
disclaimer on
trade what you see
trade what you read.
ready to take off ?
not yet.
any comment ? please go ahead..
what coin should i read next ?

PHAUSDT#PHAUSDT
we published and shared this idea with you and gave good profits
Target 1️⃣ : done✅
Price reached : 0.1460$ ✅
Profit: 25.70%🚀🤑

short to mid term $Pha prediction ! 50%+ PossibleHello traders,
$pha dragon might be getting ready for a swift move towards the $0.20-0.30 zone. Be advised that it is not a clear cut move. If Btc fails the whole market will fail but pha does have quite a bit more room to grow.
Good luck and take risks according to the market!

PHA phala finding support at support level and moving PHA - Accumulation +10 days at support
Target 1: 0.1338
Target 2: 0.1473
Target 3: 0.1685
Target 4: 0.2006
Stop Loss: 0.1069
Manage Risk - have a stop loss in place
price movement prediction
Price Prediction
not financial advice
this is for entertainment purposes only
always DYOR

PHAUSDT#PHAUSDT
MACD is showing bullish RSI is neutral EMAs showing a bullish move Ichimoku cloud is bullish Parabolic SAR is bullish ZELMA is neutral Fib retracement is showing bullish Accumulation distribution is bullish Awesome oscillator in neutral
in daily chart time-frame as you can see at the chart we have very important and strong support zone in 10/2022 price flew from this powerful support zone 375% dont's miss up this opportunity buy and hold it to the next targets at the chart

PHAUSDT#PHAUSDT
in daily chart time-frame as you can see at the chart we have very important and strong support zone in 10/2022 price flew from this powerful support zone 375% dont's miss up this opportunity buy and hold it to the next targets at the chart MACD is showing bullish RSI is neutral EMAs showing a bullish move Ichimoku cloud is bullish Parabolic SAR is bullish ZELMA is neutral Fib retracement is showing bullish Accumulation distribution is bullish Awesome oscillator in neutral


PHAUSDT 30 min binance update PHAUSDT SHOWING SUPPORT AROUND 0.14$
Main resistance areas are mentioned and stop also
Play wisely

short to mid term Pha Another Big move expected.Big things for happening for Pha as of late. As long as Btc stay stable, we may see another attempt to $0.2-0.3 zone.
Best possible early Entry $0.145-0.155 zone! Do not risk your whole portfolio. This is only one possible scenario out of many other possible outcomes.
Good luck!

Target Reached !!!our team closed the short position that was distributed yesterday. For more details I am waiting for you in private.

PHA has registered a growth of more than 50% in the last 24h!PHA has registered a growth of more than 50% in the last 24 hours. The price of this currency had entered a correction wave after the previous upward wave of 550%, which we saw a positive reaction of this currency by using the correction Fibonacci tool and the range between 0.5 and 0.618 of this tool. Therefore, the static support range of $0.137 to $0.160 can be associated with a good reaction if retested. The goals of this currency are still in the resistance range of 0.390 to 0.480 dollars. Again, the $0.200-$0.215 range is considered supportive; if this range is maintained, buyers can gain strength and bring the price to the set targets.

always right!last night I posted the analysis that PHA will decrease to the area of $0.2! that's how it happens!
+58 % PROFIT IN 24 HOURS 🔥SPOT TRADING
PHA-USDT
BUY: 0.162$
SELL: 0.265$
(((PROFIT: 58% DONE)))✅✅✅
Target hit successfully

pha correction timepha had a nice growth in 4 hours, after an analysis I came to the conclusion that a correction has started that can be up to the area of 0.2$

pha usdt buying setuppha coin currently trade at 0.175$
its brok now decendending triangle pattern on4h time frame chart.
now possible we seee it soon on its strong support area at 0.15$-0.14$
also bounce back expected from this support.
good buying range for shortterm profit is 0.14-0.15 cents
sell targets depend on you according to your investment plan
follow me for more updates.

PHA UPDATEif this time the MACD is rejected for 4 hours, then we will have a new correction of around 15%, bringing it down to the value of 0.15 cents approximately

PHA/USDTPHA/USDT
The uptrend line has broken.
In my opinion, it will make a pullback up to 12 cents and continue its growth.
#PHAUSDT #PHA #BTCUSDT #BTC #ETHUSDT #DOGE #DOGEUSDT
