EU50 approaching resistance, potential drop! EU50 is approaching our first resistance at 3272 (50% fibonacci retracement, 100% fibonacci extension, horizontal overlap resistance) and a strong drop might occur pushing price down to our major support at 3128 (38.2% fibonacci retracement).
Stochastic (55, 5, 3) is also approaching resistance and we might see a corresponding drop in price should it react off this level.
Trading CFDs on margin carries high risk.
Losses can exceed the initial investment so please ensure you fully understand the risks.
EUSTX50 trade ideas

SHORT Euro stoxx 50 approaching resistance, potential drop!Euro stoxx is approaching our first resistance at 3262.6(horizontal swing high resistance, 61.8% & 50%Fibonacci retracement, 100% Fibonacci extension ) where a strong drop might occur below this level pushing price down to our major support at 3134.7 (38.2% Fibonacci retracement , Horizontal overlap support, 61.8% Fibonacci extension )
Stochastic (55,5,3) is also approaching resistance where we might see a corresponding drop in price.
Trading CFDs on margin carries high risk. Losses can exceed the initial investment so please ensure you fully understand the risks.

Euro stoxx 50 approaching resistance, potential drop!Euro stoxx is approaching our first resistance at 3262.6(horizontal swing high resistance, 61.8% & 50%Fibonacci retracement, 100% Fibonacci extension ) where a strong drop might occur below this level pushing price down to our major support at 3134.7 (38.2% Fibonacci retracement , Horizontal overlap support, 61.8% Fibonacci extension )
Stochastic (55,5,3) is also approaching resistance where we might see a corresponding drop in price.
Trading CFDs on margin carries high risk. Losses can exceed the initial investment so please ensure you fully understand the risks.

EU50 approaching resistance, potential drop! EU50 is approaching our first resistance at 3272 (50% fibonacci retracement, 100% fibonacci extension, horizontal overlap resistance) and a strong drop might occur pushing price down to our major support at 3128 (38.2% fibonacci retracement).
Stochastic (55, 5, 3) is also approaching resistance and we might see a corresponding drop in price should it react off this level.
Trading CFDs on margin carries high risk.
Losses can exceed the initial investment so please ensure you fully understand the risks.


Mission Statement for the "- in Review" seriesI'm not sure of the exact figures, but I think TradingView has about 7M+ users. That's 7M+ people working towards the same end. 7M+ people with insights and ideas. 7M+ people with access to an in-house programming language tailored for trading and technical analysis. Yet despite this there's only a small, mumbling community for discussing Pine, trading and how to bring them together.
A few people have endeavored to change this and I'd like to play my part. So I'm going to begin publishing a series of articles through TradingView that will try to bring light to the secretly-active Pine community. The three titles I suggest will be: (1) "Week in Review", (2) "Coder in Review" and (3) "Script in Review".
One of the reasons I want to do this is because I think it's incredibly difficult for new users to get recognition for their brilliant work due to the current TradingView search system being an echo-chamber. Those with the most followers get the most views and the most likes and then more followers and more views and... LazyBear, a cherished asset of the TradingView community, is all some people will know and search for. This can be disastrous for building a lasting community around Pine and for developing your own concepts around trading. So I want to give more exposure to those who publish now so that we can all have the opportunity to be involved in conceptual progress. Hopefully in due time TradingView will revamp their search engine. Most popular scripts of the week/month/year would be a start, but I'm sure more could be done.
The articles written will never be defamatory or provocative. I don't want to rouse spirits, but focus minds. In that same vein, I will never shill someone's profile or scripts. All choices will be mine alone (unless I can poll effectively and transparently) and, as such, will have my biases (unless others join me in this effort)
Week in Review
Every Tuesday I'll pore through the scripts that have been published in the last week and select one for review, once it meets the minimum criteria. The criteria for being considered is: (A) for the script to be open-source and (B) not to be a direct copypasta-job from another coder. There's nothing wrong with using something not made by you to help you create something better though, but there has to be obvious improvements made from the original.
The script reviewed is meant to be my pick-of-the-bunch, but that is by no means an ultimate opinion. Some qualities that I'll most likely be looking for are: (A) creativity and innovation; just do as Ezra Pound did and "Make it new!", (B) usefulness: it can either be useful in it's own right, or it can be useful when used as a component within another script; both will be considered, neither will be favored and (C) a decent description of what it's supposed to do or how it's supposed to be used. Clean charts are a plus too: you only need the indicator you're publishing on the chart most of the time.
Aside from the script, there will be a brief mention of the programmer and their body of work.
Coder in Review
This is where I'll look over the portfolio of a user on TradingView and comment on their body of work, some of their best (my favorite) scripts and how they've helped the community to grow as a whole. The criteria for being considered are: (A) must have an account for over six months and (B) must have published at least ten scripts.
These won't be published regularly (at least not at the start), so I'll just push them out when I get the itch. From referencing so much of RicardoSantos' work in my initial builds, I felt indebted enough that I wanted to write him an essay explaining my thanks. I've since had that feeling for a lot of programmers. Some qualities I'll be looking for will be: (A) breadth of analysis and (B) efficient code.
Script in Review
Some weeks we're going to have a handful of top-notch scripts, most which we don't want discluded from the narrative. So in order to accommodate for them there'll also be a "Script in Review" thread of articles. This will also give me the opportunity to discuss scripts that were published a long time ago. Criteria to be included will be the same as the "Week in Review" selection. Like the "Coder in Review", these won't be regularly publications for the time being, but may become so in the future.
Disclaimer
I'm going to talk about scripts and programmers that I like, but that is by no means an endorsement. If someone I talk about sells products or services, I do not want you to make a decision to engage with their products or services based on my opinions. I'm not selling anything or trying to get you to buy something. I just want to open up the discussion about Pine and bring together a community of like-minded people.
Want to learn?
If you'd like the opportunity to learn Pine but you have difficulty finding resources to guide you, take a look at this rudimentary list: docs.google.com
The list will be updated in the future as more people share the resources that have helped, or continue to help, them. Follow me on Twitter to keep up-to-date with the growing list of resources.
Suggestions or Questions?
Don't even kinda hesitate to forward them to me. My (metaphorical) door is always open.


Euro Stoxx 50 Index . Short Term Supply Area Detected by TrackerPrice at supply Area
Potential move to the downside expected
Preferable to wait for a break of 3186 to confirm the downside move


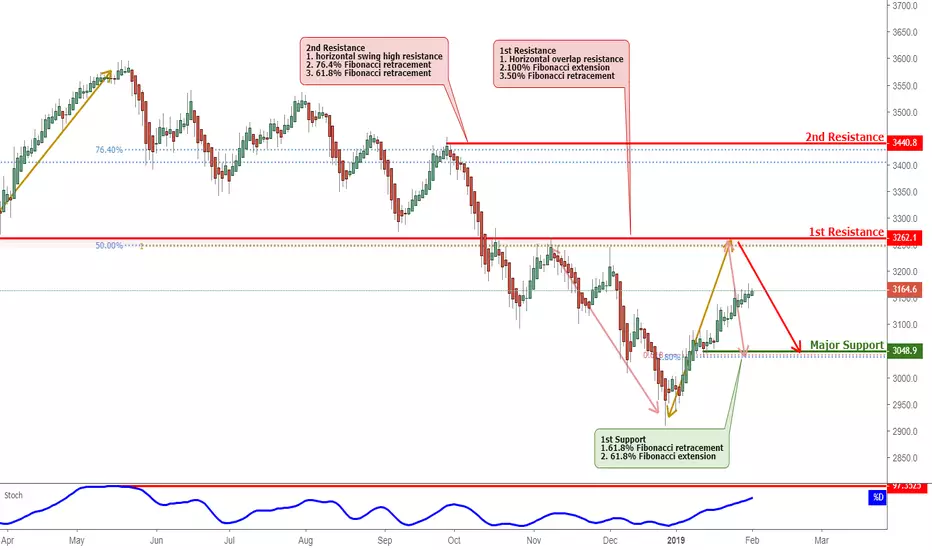
SHORT SHORT Euro Stoxx 50 approaching resistance, potential droEuro Stoxx 50 is approaching our first resistance at 3262.1(horizontal overlap resistance, 50% Fibonacci retracement ,100% Fibonacci extension ) where a strong drop might occur below this level pushing price down to our major support at 3043.7 (61.8% Fibonacci retracement ,61.8% Fibonacci extension )
Stochastic (89,5,3) is also approaching resistance where we might see a corresponding drop in price.

SHORT Euro Stoxx 50 approaching resistance, potential drop!Euro Stoxx 50 is approaching our first resistance at 3262.1(horizontal overlap resistance, 50% Fibonacci retracement ,100% Fibonacci extension ) where a strong drop might occur below this level pushing price down to our major support at 3048.9 (61.8% Fibonacci retracement ,61.8% Fibonacci extension )
Stochastic (55,5,3) is also approaching resistance where we might see a corresponding drop in price.
Euro Stoxx 50 approaching resistance, potential drop!Euro Stoxx 50 is approaching our first resistance at 3262.1(horizontal overlap resistance, 50% Fibonacci retracement ,100% Fibonacci extension ) where a strong drop might occur below this level pushing price down to our major support at 3043.7 (61.8% Fibonacci retracement ,61.8% Fibonacci extension)
Stochastic (89,5,3) is also approaching resistance where we might see a corresponding drop in price.

EU50 approaching resistance, potential drop! EU50 is approaching our first resistance at 3167 (ascending overlap resistance, horizontal swing high resistance, 76.4% fibonacci retracement, 61.8% fibonacci extension) and a strong drop might occur below this level pushing price down to our major support at 3088 (horizontal overlap resistance, 161% fibonacci exteension).
Stochastic (55,5,3) is also approaching resistance and we might see a corresponding drop in price should it react off this level.
Trading CFDs on margin carries high risk.
Losses can exceed the initial investment so please ensure you fully understand the risks

Euro Stoxx 50 approaching resistance, potential drop!Euro Stoxx 50 is approaching our first resistance at 3261.7(horizontal overlap resistance, 50% Fibonacci retracement ,100% Fibonacci extension ) where a strong drop might occur below this level pushing price down to our major support at 3090 (50% Fibonacci retracement , horizontal overlap support)
Stochastic (89,5,3) is also approaching resistance where we might see a corresponding drop in price.


EU50 approaching resistance, potential drop! EU50 is approaching our first resistance at 3087 (50% fibonacci retracement, 100% fibonacci extension, horizontal swing high resistance) and a strong drop might occur below this level pushing price down to our major support at 3016 (38.2% fibonacci retracement, horizontal overlap resistance).
Stochastic (34,5,3) is also approaching resistance and we might see a corresponding drop in price should it react off this level.
Trading CFDs on margin carries high risk.
Losses can exceed the initial investment so please ensure you fully understand the risks

Time to short European indicesIn a prevalent potential or on-going bear market, sharp countratrend rallies and 50% retracements are usual.


EUR50 approaching resistance, potential drop! EUR50 is approaching our first resistance at 3075 (50% fibonacci retracement, 100% fibonacci extension, horizontal swing high resistance) and a strong drop might occur below this level pushing price down to our major support at 3016 (50% fibonacci retracement, 100% fibonacci extension, horizontal swing high resistance).
Stochastic (89,5,3) is also approaching resistance and we might see a corresponding drop in price should it react off this level.
Trading CFDs on margin carries high risk.
Losses can exceed the initial investment so please ensure you fully understand the risks

Sell Euro StoxxThis is just a journal for me. I strongly warn you to not take this in your real account. Good luck!

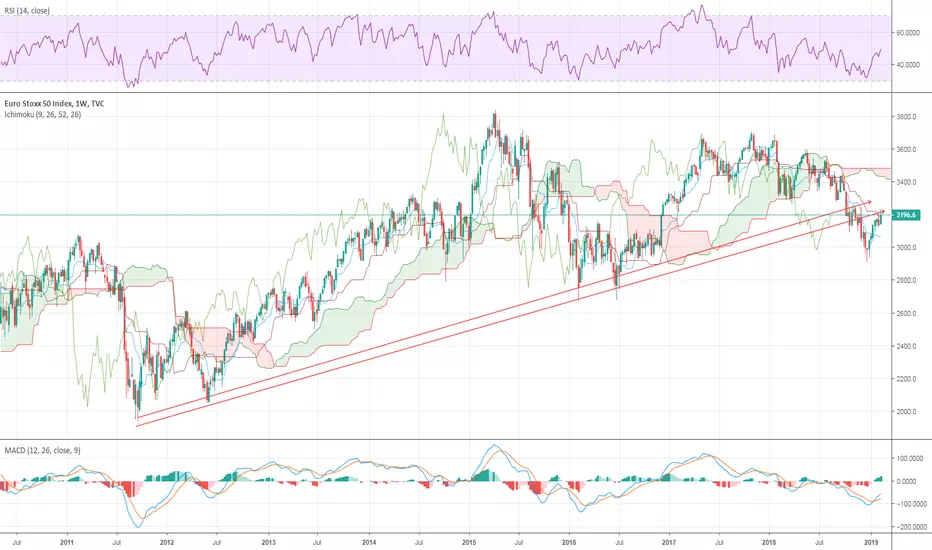
EURO 50 STOCKS (EURO 50 STOXX) (EU50EUR)Price on the EURO STOXX index broke out of the ascending channel on the weekly timeframe, and now it is coming back to retest the support-turned-resistance. We will only be taking shorts on this index, and we will only do so when the RSI is fully overbought on the higher timeframes. Until then, we keep on waiting.
