USDPHP - 11Oct2021USDPHP - 11Oct2021
On H4, USDPHP is consolidating at previous breakdown level, we could expect it to drop to retest 1st Support. Stochastic is also indicating bearish momentum.
There is also a slight possibility for the price to retest weekly 1st Support at 49.72 this week.
This is for personal record purposes only, not financial advise or solicitation of trade.
PHPUSD trade ideas

USDPHP - 08Oct2021USDPHP - 08Oct2021
USDPHP plunged yesterday and found support at 50.21. We could expect it to retest 1st Resistance at 50.57 before dropping back down to retest 1st Support again at 50.21.
We could expect further downside in USDPHP until RSI come into support at around 37.28
This is for personal record purposes only, not financial advise or solicitation of trade.

USDPHP - 07Oct2021USDPHP - 07Oct2021
USDPHP faced bearish pressure from the descending trendline resistance, limited upside for today. We could expect it to have a short-term bounce again to descending trendline resistance and drop to 1st Support.
This is for personal record purposes only


USDPHP continues its downtrendPHP continues to strengthen as weak demand for dollars in the country, lackluster import demand and continuing weakness in USD continues.
>Downtrend Line continues to be respected
>Trend Indicators remain weak
>Next Support level seen at 47.90 - 48.00 levels

PHPUSD Outlookphilippines is struggling alot, offshore workers going back. so foreign remittance decreased alot. Tourism decreased by 75% + -, unemployment is going to keep going up and the government have to keep borrowing money from outside. GDP -16.5&, GNI -17%, Inflation 2.7% July 2020, trade exports: $5.33 p Imports: $6.63 p =balance of trade $-1.3p )fob value in billions(June 2020 stats), The country though, would benefit from a much weaker php, focus on more export, and you need to be price competetive, cut imports. Weaker php also means increased tourism boom once covid start normalizing. Just my thoughts.

USDPHP Trading planPattern: Channel Down.
Signal: (A) Buy as long as the 4 year Support holds. (B) Sell if it breaks.
Target: (A) 50.00 (just below the Symmetrical Resistance). (B) 48.00 (the next Support level).
** Please support this idea with your likes and comments, it is the best way to keep it relevant and support me. **

USDPHP If hold this level correction is done. It's possible this is just a retracement and we may see a bounce not a reversal from the original count

USD/PHPMy Technical Analysis
USD/PHP
Based on my technical analysis and as caused by the ongoing COVID-19 pandemic, I can see that the value of PHP (Philippine Peso) can possibly drop from 47 to 45
Reason:
1) June & July closed below Exponential Moving Average 20 & 50
2) Elliott Wave (4) is a corrective wave. it played out perfectly in Fibonacci retracement
3)Stochastic RSI shows a big drop at 1.0 & MACD is now below -0.1.
Conclusion:
Drop at PHP 47.00 to 45.00
Long Term: Let's get back to PHP 56.00
SHORT THE MARKET
NOT FINANCIAL ADVICE


USDPHP Weekly AnalysisBSP announces rate cut last May 9 and multiple RRR cuts thereafter. USDPHP has spoken it wants to go up. Possibly 56 if the previous 8% to 9% runups are any indication.

USDPHP Trading Plan - Artacho, Cipriano, LopezScenario 1:
Bias - Short
Entry: 51.97
stop loss - 52.02
TP: 51.85
Scenario 2:
Bias: Short
Entry: 52.19
Stop Loss: 52.41
TP: 51.85
Scenario 3:
Bias: Long
Entry: 52.25
Stop Loss: 52.19
TP: 52.62
Scenario 4:
Bias:Long
Entry: 51.86
Stop Loss:51.74
TP: 52.19

PHP.USD P-Modeling Pt 1. Forex Experimentation In Quantra Forex Experimentation using Quantum Hyperspace Decoding Protocols.
Next up, is PHP.USD
Find the "we are here" bubble to begin.
Global Modeling Harmonic Strings of Quantum Butterflies + Quantum Cyphers + a developing Cup and Handle .
Long Term Prediction Modeling.
Date-frame: 2008 to 2021
Timeframe: 1 Week
A potential legendary trade is possible here for the PHP .USD pairing for the year of 2020.
Waiting for geometric confirmation before longing...
As shown, we must go down a bit before Long Entry is viable
Must confirm drop to initiate long Trade.
Mapped 2008 to 2011..
Executed 2020.
If one looks closely we can say an array of strings of harmonics, butterflies and resistances and two distinct cycles present.
These are not mistakes. Geometric representation of analog data is superior to most programmed indicators and Traditional Analysis.
I feel there will be a completion of the current 1 Day timeframe harmonic scales between timeframes outlined and a well executed cup and handle ..
All harmonics are constructed from actualized data strings from 2D to 3D using unique hyperspace protocols.
Failure is a necessary component of success.
Trial and Error is the superior phenomenological reductionist analysis.
Welcome to the Hyperspace.
Thanks for pondering the unknown with me,
Glitch420


USDPHP WEEKLY CHARTWeekly chart shows that it already broke down its trend support and forming head and shoulders. it would be better if we short now until the elections this coming May

USDPHP Wave (4) TP at 49-50If we break the 52 level it's possible the Peso will go to 49 to 50 Level Wave (4).

US Dollar and Philippine Peso Analysis (Daily Chart) 11.13.2018US Dollar and Philippine Peso Analysis (Daily Chart) 11.13.2018
Still an Uptrend. Price hit EMA 200 on 11/7, Bearish Candle, but followed by 2 Bullish Candle
Price just came from a major support level
Retracement already ended, Stochastic is almost on level (out of the oversold zone)
Generally a Healthy uptrend
Recommendations: BUY at 53.025 when market opens next week
SL: 52.056 Below the major resistance level
TP: 54.365 Previous swing high
Risk and Reward Ratio: 1:2

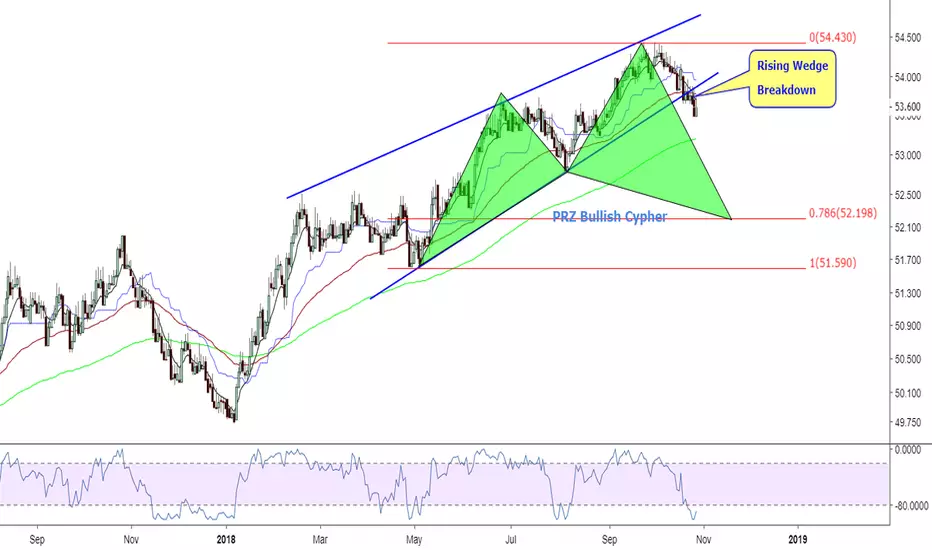
USDPHP Potential Bullish CypherThe chart is telling us that we will have a stronger peso this coming days and it is foretasted to go down to 52 level to complete the Potential Bullish Cypher harmonic Pattern.
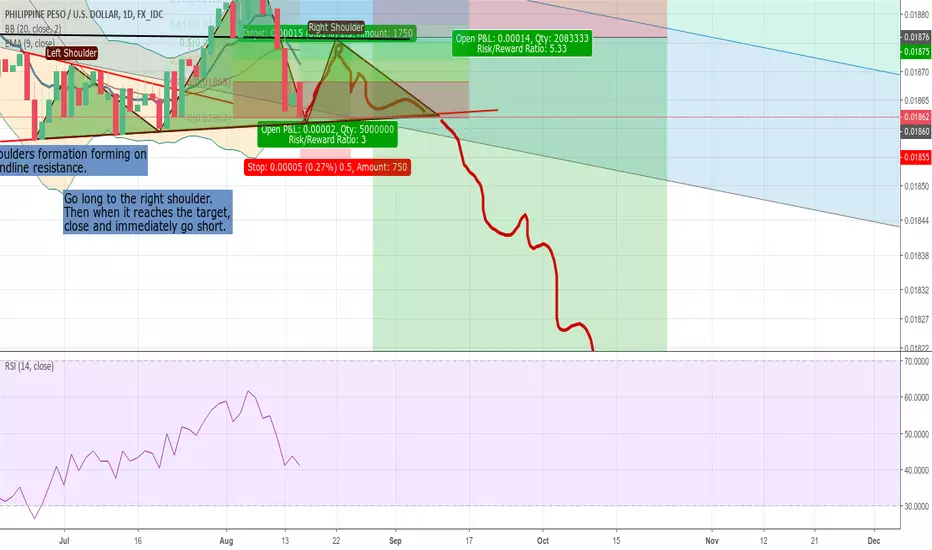
PHP downtrend continuation. Great R:R.The Peso continues to decline this month. Since the 10% crash from January to February, the long term trend is in a downwards channel. However I believe that it will once again break below the channel and continue to fall. (Click and drag on the price axis to move the chart).
Looking at more short term profits:
A Head and Shoulders pattern is forming on the daily chat. This is normally a reversal pattern and not a continuation, however I believe that a 50% retracement of the "head" will still act as resistance, as it has in previous red daily candles. See the black horizontal minor resistance level from the past month as this also lines up.
Normally the target of this H&S would be a 1:1 extension of the head to the neckline, however because it will be breaking this important channel, there is no resistance there to hold it so expect a drop fast. Possible resistance level is the black line on the chart.
The RSI is not near the oversold level, so still has further to fall.
Downsides:
-There have not been any noticeable H&S formations on this pairing in the past.
-H&S normally signifies a reversal rather than continuation.
-The resistance in the channel may be enough to push it back up as this "H&S" is not yet so big. If this fails then look for a short opportunity after a larger structure.
Good luck trading.