PI's situation+ Target PredictionThe price has broken the ascending wedge, and this could push it toward the middle of the channel, potentially happening very quickly.
Best regards CobraVanguard.💚
Related pairs

PIUSDT falling wedge breakout 🚨 Hello Traders!
PIUSDT has successfully broken out of a falling wedge — a strong bullish pattern.
This breakout may indicate the start of an upward move.
Watch for a retest of the breakout zone for potential entries.
Volume confirmation will add confidence to the setup.
Stay alert and always apply

The falling wedge of Pi Coin?Falling wedge Pi network pattern?The Pi Network (PI) token is currently showing signs of forming a falling wedge pattern, which is often interpreted as a bullish reversal signal in technical analysis. This pattern is characterized by two downward-sloping trendlines that converge, indicating a slowdown in bearish momentum.
One week

PIUsdti dont see any reason for pi to go above a dollar for now. in as much pi team is still in control of billions of token, the investors will always go short. so am still expect pi team to release community token after the price drop below 0.07

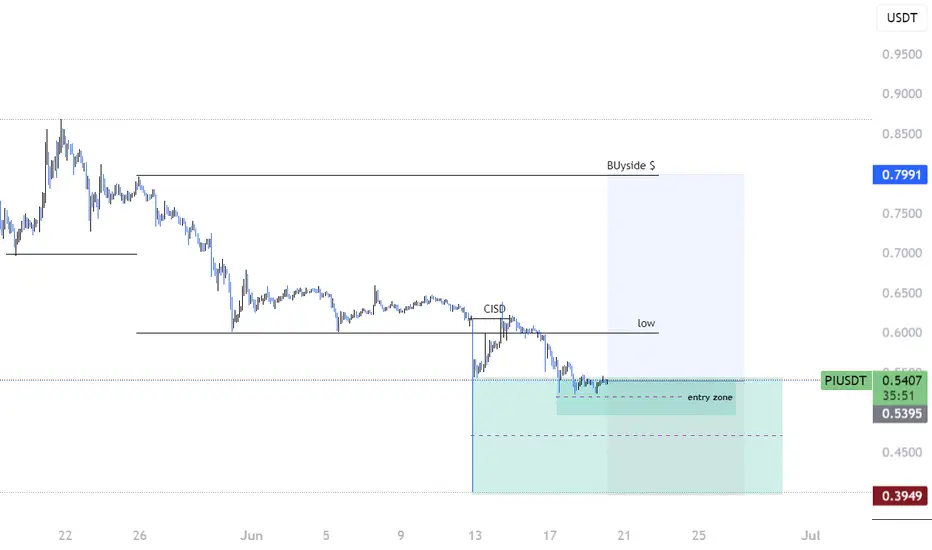
Pi long !! proper risk management Hello traders, keeping a close eye on NASDAQ:PI — forming a solid pattern.
Strong wick indicates a potential buy zone in this area.
We do have some untapped downside liquidity below.
However, with CRT in play, a bullish move is likely.
We’ve already completed CISD confirmation on the 3H timeframe.
PI/USDT Final Call before it flies to the next galaxyWe see so many bullish signs.
Price could potentially tap into the discount zone
before it soars.
Good luck!


$PI TECHNICAL ANALYSIS ! !NASDAQ:PI is finally breaking out of the long-term downtrend and showing early signs of strength.
Price has reclaimed the falling wedge resistance and is now pushing toward the 0.236 Fib zone around $0.69 that we need to break to move further up.
If bulls hold momentum, the next target could be $

PI/USDT potential entry before flying to the next galaxyCould this be the zone?
Either we will make profit or be liquidated.
Good luck babies!

PI breakout !!Trendline Break:
Price has broken above a descending trendline — often a bullish signal.
A small retest is visible, indicating confirmation of the breakout.
Equal Highs (Liquidity Pool):
Labelled “$$ same highs” — this suggests buy-side liquidity is resting above that level.
Price often targets

See all ideas
Summarizing what the indicators are suggesting.
Oscillators
Neutral
SellBuy
Strong sellStrong buy
Strong sellSellNeutralBuyStrong buy
Oscillators
Neutral
SellBuy
Strong sellStrong buy
Strong sellSellNeutralBuyStrong buy
Summary
Neutral
SellBuy
Strong sellStrong buy
Strong sellSellNeutralBuyStrong buy
Summary
Neutral
SellBuy
Strong sellStrong buy
Strong sellSellNeutralBuyStrong buy
Summary
Neutral
SellBuy
Strong sellStrong buy
Strong sellSellNeutralBuyStrong buy
Moving Averages
Neutral
SellBuy
Strong sellStrong buy
Strong sellSellNeutralBuyStrong buy
Moving Averages
Neutral
SellBuy
Strong sellStrong buy
Strong sellSellNeutralBuyStrong buy
Displays a symbol's price movements over previous years to identify recurring trends.
Frequently Asked Questions
The current price of Pi Network/Tether USD (PI) is 0.5296 USDT — it has risen 0.05% in the past 24 hours. Try placing this info into the context by checking out what coins are also gaining and losing at the moment and seeing PI price chart.
Pi Network/Tether USD price has risen by 7.08% over the last week, its month performance shows a −23.15% decrease, and as for the last year, Pi Network/Tether USD has decreased by −98.74%. See more dynamics on PI price chart.
Keep track of coins' changes with our Crypto Coins Heatmap.
Keep track of coins' changes with our Crypto Coins Heatmap.
Pi Network/Tether USD (PI) reached its highest price on Dec 31, 2022 — it amounted to 500.0000 USDT. Find more insights on the PI price chart.
See the list of crypto gainers and choose what best fits your strategy.
See the list of crypto gainers and choose what best fits your strategy.
Pi Network/Tether USD (PI) reached the lowest price of 0.4018 USDT on Jun 13, 2025. View more Pi Network/Tether USD dynamics on the price chart.
See the list of crypto losers to find unexpected opportunities.
See the list of crypto losers to find unexpected opportunities.
The safest choice when buying PI is to go to a well-known crypto exchange. Some of the popular names are Binance, Coinbase, Kraken. But you'll have to find a reliable broker and create an account first. You can trade PI right from TradingView charts — just choose a broker and connect to your account.
Crypto markets are famous for their volatility, so one should study all the available stats before adding crypto assets to their portfolio. Very often it's technical analysis that comes in handy. We prepared technical ratings for Pi Network/Tether USD (PI): today its technical analysis shows the strong sell signal, and according to the 1 week rating PI shows the sell signal. And you'd better dig deeper and study 1 month rating too — it's sell. Find inspiration in Pi Network/Tether USD trading ideas and keep track of what's moving crypto markets with our crypto news feed.
Pi Network/Tether USD (PI) is just as reliable as any other crypto asset — this corner of the world market is highly volatile. Today, for instance, Pi Network/Tether USD is estimated as 10.25% volatile. The only thing it means is that you must prepare and examine all available information before making a decision. And if you're not sure about Pi Network/Tether USD, you can find more inspiration in our curated watchlists.
You can discuss Pi Network/Tether USD (PI) with other users in our public chats, Minds or in the comments to Ideas.