PI BelieverThose god wicks are strong indication of some investors buying the dips, hope we see some god solid candles before year ends.
PIUSDT trade ideas


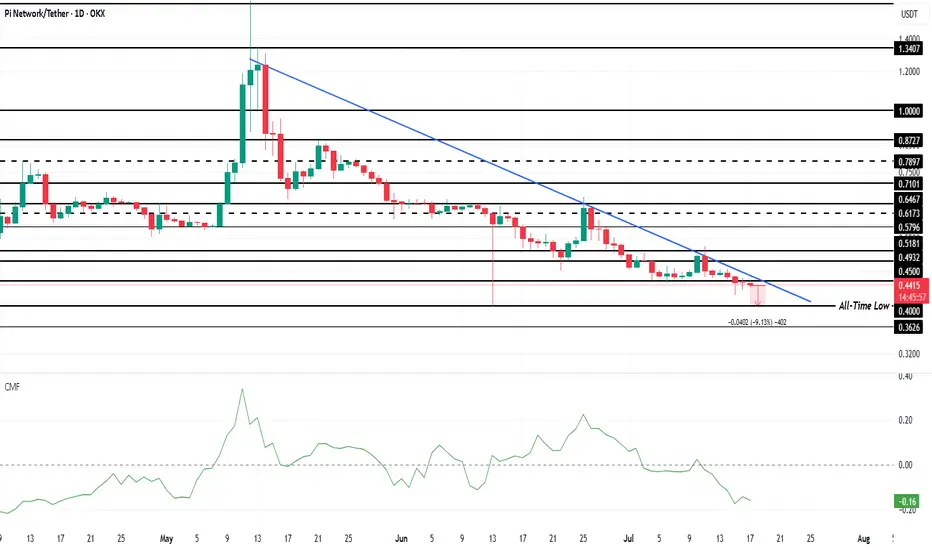
Pi Coin Continues To Bleed Money As Skepticism Hits 3-Month HighOKX:PIUSDT is currently trading at $0.44, just 9% above its ATL of $0.40 . The altcoin has been stuck in a downtrend for the past two months, and the lack of support could lead to further declines. As investor sentiment continues to erode, Pi Coin could soon test its ATL , with the potential for further losses.
The Chaikin Money Flow (CMF), which tracks the flow of money into and out of an asset, has dropped to a 3-month low . This indicates that OKX:PIUSDT is experiencing a significant outflow of capital, with more money leaving the coin than entering .
With the bearish sentiment and technical indicators pointing to a downtrend, OKX:PIUSDT may struggle to find support in the near future. If the altcoin loses its support at $0.40, it is likely to drop to the ATL of $0.36 . This would mark a significant loss for holders who have seen their investments lose value over time.
However, if the investor sentiment shifts and OKX:PIUSDT is picked up at lower prices, there may be a chance for recovery. A positive change in momentum could be signaled by Pi Coin breaching the $0.51 resistance level and flipping it into support . This would invalidate the bearish thesis and open the door for potential price gains.
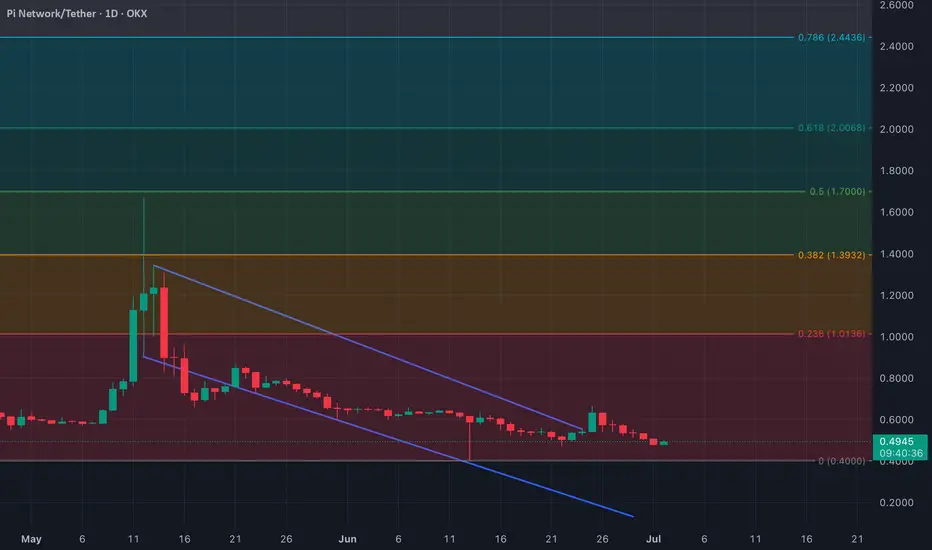
PIUSDT Range Play Within a Potential Descending TriangleAfter reaching a high of $2.9645, PIUSDT has experienced a sharp decline, establishing a base near the $0.38 zone. This base continues to hold, suggesting the formation of a potential descending triangle.
For now, the strategy is to trade the range while the structure matures. A break below $0.38 would likely trigger further downside toward $0.16, where a strong external demand zone aligns with the completion of a possible WXY corrective formation.
On the flip side, a breakout above the upper trendline of the triangle would be a strong bullish signal, potentially igniting a significant rally. Upside targets are already projected on the chart.
As the structure develops, all eyes remain on the key levels that will determine the next major move.

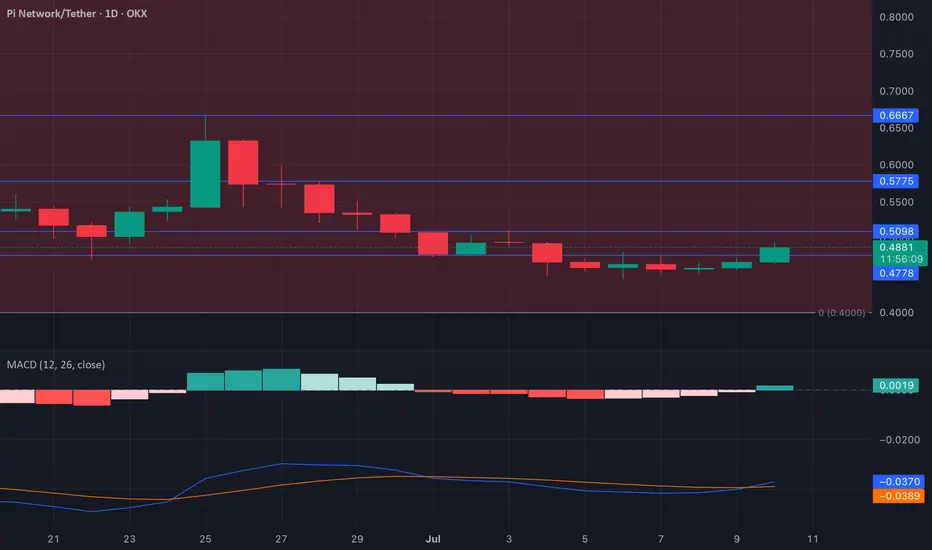
PI | Bullish MACD Crossover Signals Rebound AttemptPI has seen a 2% price uptick, triggering a bullish crossover on the MACD indicator—the first since July 1. This technical setup occurs when the MACD line crosses above the signal line, often viewed as a shift toward bullish momentum. It suggests increasing buying interest as bears begin to lose control.
Though both MACD and signal lines are still below zero—a sign of the meme coin’s prolonged downtrend—the crossover indicates a possible change in sentiment. For traders, this move is often interpreted as a buy signal, hinting at a short-term price rebound if bullish momentum continues to build.
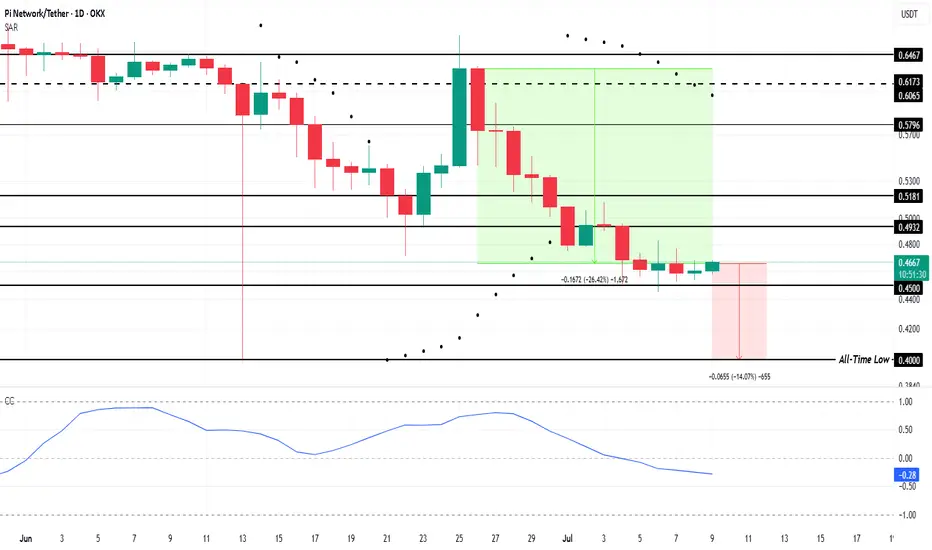
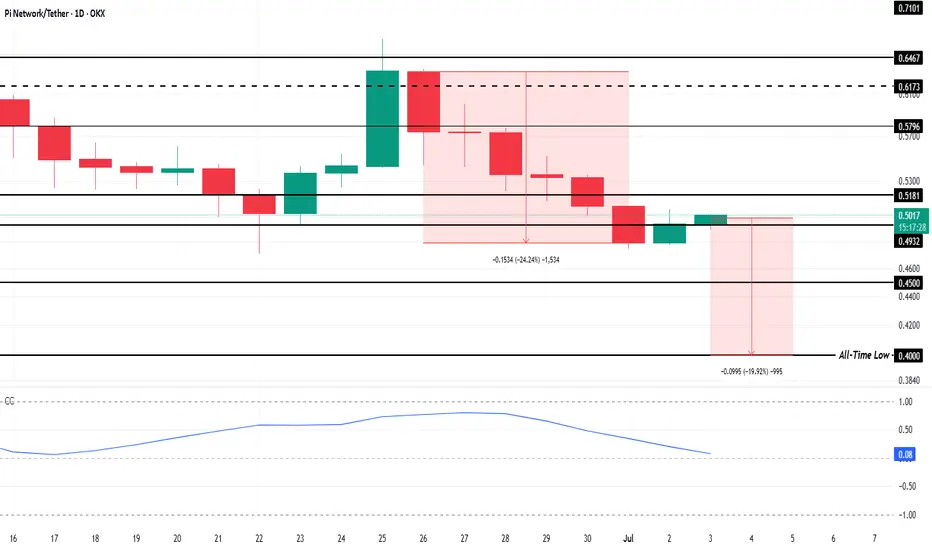
Pi Coin Decouples from Bitcoin, Pushes Price To All-Time LowOKX:PIUSDT is currently priced at $0.465, just above the critical support level of $0.450. With the altcoin hovering only 14% above its all-time low of $0.400 , it faces significant downside risk.
This price range puts Pi Coin in a precarious position, as a break below $0.450 could trigger a further decline. In the past two weeks, OKX:PIUSDT has already suffered a 26.4% drop , highlighting its ongoing struggle to regain momentum.
OKX:PIUSDT has experienced a dramatic shift in its correlation with BINANCE:BTCUSDT , now sitting at a negative 0.27 . This negative correlation means that Pi Coin is moving in the opposite direction to Bitcoin. In simpler terms, as Bitcoin rises, OKX:PIUSDT continues to struggle.
The negative correlation with Bitcoin suggests that Pi Coin will not capitalize on the positive trends seen in the wider cryptocurrency market. Instead, OKX:PIUSDT faces the risk of further decline.
Given these indicators, it seems likely that OKX:PIUSDT will fall to its all-time low of $0.400 . The fear of further losses is likely to prompt additional selling, which could accelerate the price decline. With the market sentiment weighed down by Pi Coin’s disconnection from Bitcoin, the path to recovery looks increasingly challenging.
However, there is still hope for OKX:PIUSDT if investors show restraint. If Pi Coin manages to hold the $0.450 support level, it could bounce back. A move past the $0.493 resistance level would be a positive sign , potentially pushing the price to $0.518. Such a recovery would invalidate the bearish thesis and offer a fresh outlook for the altcoin.
PI breakout from wedge and Trendline !!🚨 PI Breakout Update 🚨
Hey traders, hope you're all doing great!
Looks like PI just broke out of a strong trendline, and things are getting interesting.
We’ve seen solid support holding for a while, and now bulls are starting to wake up.
This move could be the start of something big if momentum continues.
Still early, but signs are pointing towards a possible bullish leg up.
Watch for a clean retest of the trendline — that could be your confirmation.
Volume is building nicely, and price action is starting to shift.
If you're tracking PI like I am, this is one to keep an eye on.
🔔 Follow for more updates and let's catch this move together!
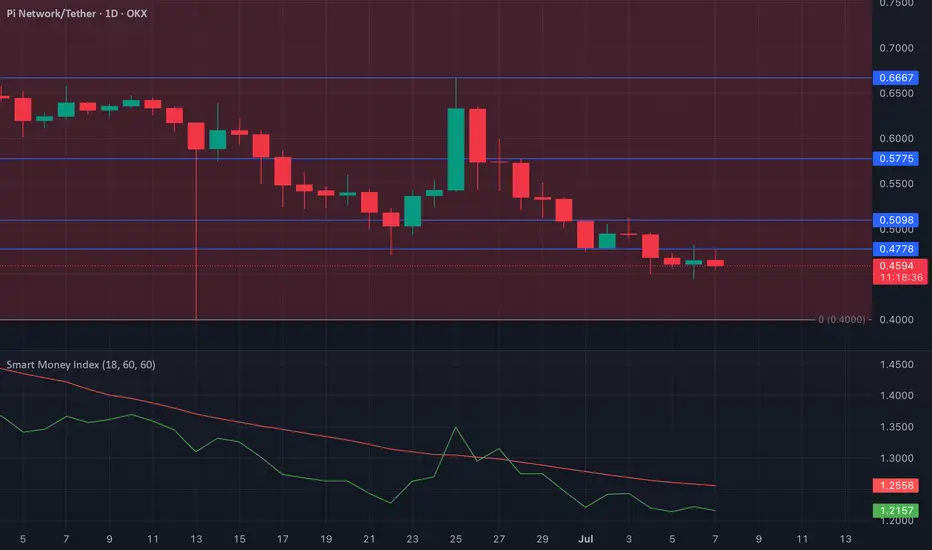
PI Smart Money Index (SMI) Signals Key Holder ExitPI’s Smart Money Index (SMI) has been steadily declining since June 25, dropping by 9% to reach 1.22 at the time of writing. The SMI tracks the behavior of experienced or institutional investors by analyzing trading patterns during the first and last hours of the market session.
A rising SMI typically indicates increased buying activity from these "smart money" players, reflecting growing confidence in the asset. However, the current downward trend highlights a different story — heightened selling activity and waning confidence from key market participants.
This persistent decline in SMI suggests that institutional investors are stepping back, signaling limited belief in a near-term price recovery for PI. Until sentiment shifts, upward momentum may remain subdued.
Pi Coin is Now 10% From an All-Time Low; Any Chance of Recovery?OKX:PIUSDT current price of $0.44 is holding just below the resistance of $0.45, a critical level for the altcoin. However, with the ongoing downtrend, this resistance is proving difficult to breach. The altcoin has faced continuous declines for the past two months, and without significant support, it remains susceptible to further drops.
OKX:PIUSDT is only 10% away from reaching its all-time low of $0.40. Given the current market conditions and Pi Coin's negative correlation with Bitcoin, the chances of the altcoin falling to this level are growing.
However, if investors increase buying pressure, OKX:PIUSDT may experience a rebound . A successful breach of $0.45 as support could lead to a recovery, pushing the price to $0.49. If this happens, the current downtrend could be invalidated, providing a potential window of opportunity for OKX:PIUSDT to reverse its fortunes.

Breakout coming very soon
The asset is in a falling wedge pattern, which is typically bullish if confirmed by a breakout.
You're forming higher lows at the bottom (marked by “L”) and lower highs at the top (marked by “H”).
There’s visible bullish divergence forming as the price makes lower lows while momentum indicators likely flatten or rise.
A breakout above the wedge with strong volume would target:
0.55 (first resistance)
0.60–0.62 (EMA/previous highs)
Breakout confirmation above the blue mid-line would suggest a trend reversal or at least a relief rally.

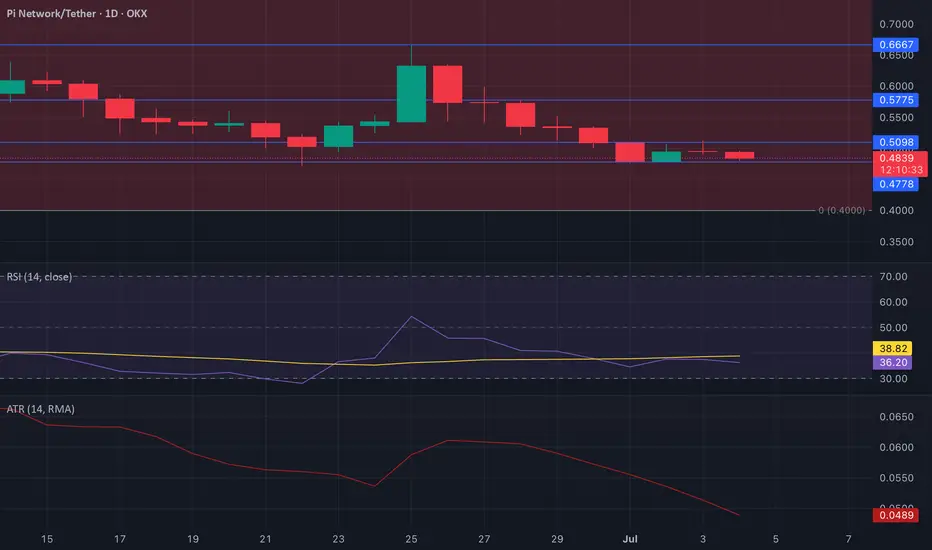
PI – Consolidation and Shrinking VolatilitySince Tuesday, NASDAQ:PI has been trading within a tight range between the $0.47 support and the $0.50 resistance level. This sideways movement reflects a balance between buyers and sellers, with neither side showing enough strength to push the price in a clear direction. The market appears to be in a state of indecision, as participants wait for a fundamental or technical catalyst to spark a breakout.
The Relative Strength Index (RSI) currently sits at 36.18 and has remained relatively flat over the past few days. This indicates a lack of momentum and weak conviction among traders. When RSI trends sideways like this, it typically signals that market participants are staying on the sidelines, avoiding large positions until a clearer trend emerges.
Additionally, the Average True Range (ATR) has dropped to 0.048, marking a 12% decline since Tuesday. This confirms the ongoing reduction in market volatility. A falling ATR suggests that price swings are narrowing, often preceding a significant breakout as the market builds up pressure.
Taken together, the flat RSI and declining ATR paint a picture of a consolidating market. While NASDAQ:PI lacks strong directional momentum at the moment, these conditions often set the stage for a sharp move. Traders should keep a close eye on the $0.47–$0.50 range for signs of a breakout in either direction.
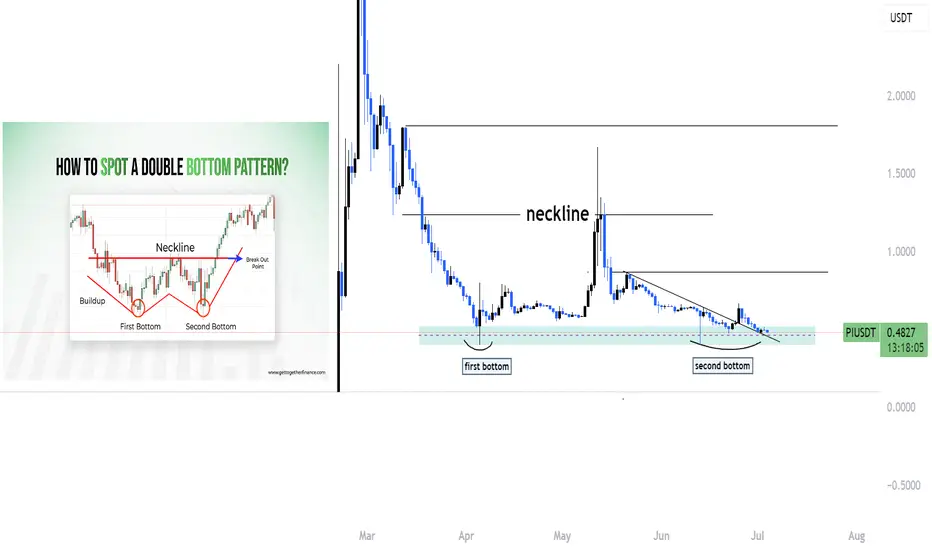
Piusdt making double bottom ??Hello traders, I hope you're all doing well!
Currently, we're seeing an interesting setup on PI that could lead to a potential bullish move. Let's break it down:
🔹 Double Bottom Formation
PI appears to be forming a double bottom on the higher time frame — a classic bullish reversal pattern. This indicates that the market has tested a key support level twice and failed to break lower, which often suggests that selling pressure is weakening.
🔹 Trendline Breakout
In addition to the double bottom, we’ve also broken out of a descending trendline that has been acting as dynamic resistance for some time. A clean breakout with volume often signals a shift in market structure from bearish to bullish.
🔹 Strong Support Zone & Liquidity
We are still holding above a strong support zone, where previous demand has stepped in. This area has likely accumulated a lot of liquidity, with stop-losses from retail traders sitting just below. If price holds this level, it may trap sellers and trigger a short squeeze, pushing the price higher.
🔹 Possible Upside Move
As long as we remain above this support and confirmation continues, there is a high probability of an upward continuation. This could be the start of a bullish leg, especially if we see a break of recent highs with strength.
📈 Conclusion
This confluence of technical signals — double bottom, trendline breakout, and liquidity resting below support — gives us a strong reason to watch this setup closely.
👉 Like and follow if you’re seeing the same structure or planning to trade this move. Let’s ride it together!
Pi Coin Closes In On All-Time Low; Bitcoin ResponsiblePi Coin’s price is currently hovering around $0.499, which is approximately 20% above its all-time low of $0.400. However, the overall market environment suggests further decline may be imminent. With continued bearish sentiment and decreasing confidence in Pi Coin , the altcoin could struggle to maintain its current levels.
Furthermore, the correlation between the Pi Coin and Bitcoin has steadily decreased. Currently, it is just 0.07, a stark contrast to the positive relationship the two coins once shared.
A low or negative correlation means that Pi Coin is moving independently of Bitcoin. This is concerning for investors who have relied on Bitcoin’s momentum to drive altcoins like Pi forward.
If Pi Coin loses the support level of $0.493, it may drop further, potentially testing the $0.450 mark. A sustained decline below this support would make Pi Coin vulnerable to hitting its all-time low again. The ongoing outflows and negative market sentiment only add pressure to Pi Coin’s price, keeping it on a downward trajectory.
However, should the altcoin experience a shift in momentum, Pi Coin could find demand from investors looking to capitalize on a potential recovery. If the coin breaches $0.518 and flips into support, it could open the door for a price rebound. A reversal would allow Pi Coin to regain investor confidence and potentially invalidate the current bearish outlook.
Head and Shoulders Head and shoulders at the bottom of a downtrend.
Closed below neckline and rejected the neckline on the uptrend.
Heigh of head to neckline (price difference) x 2 = price target.
needs to close above the right shoulder to invalidate.
Always set a SL

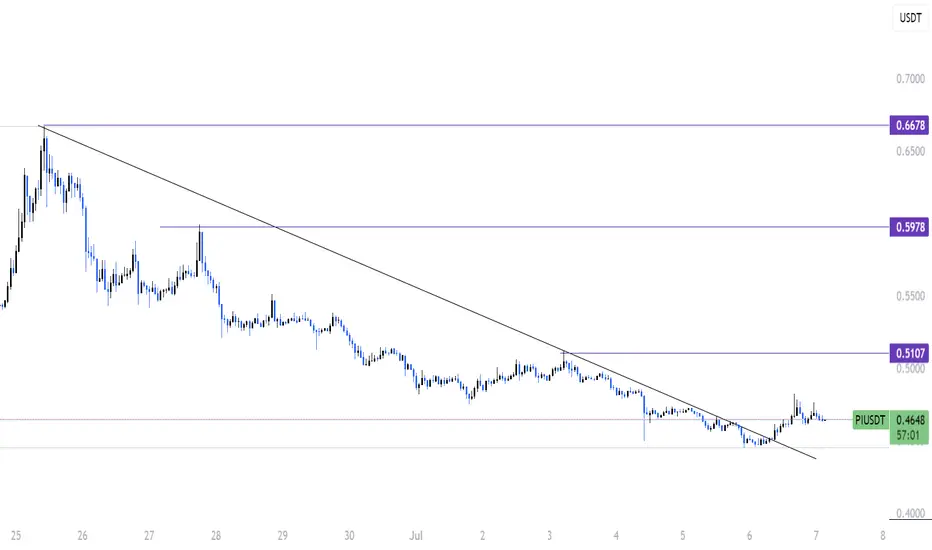
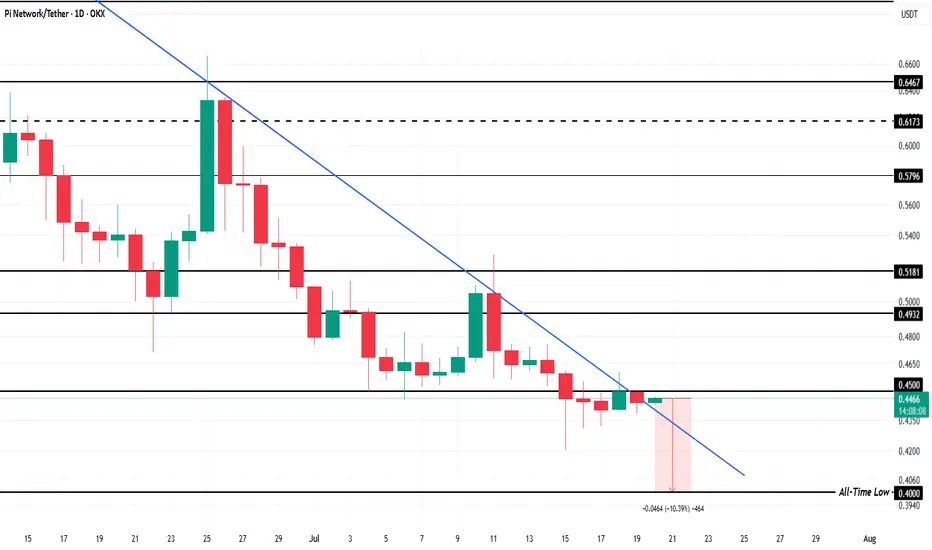
PI Slips Back Into Downtrend – Eyes on $0.40 SupportPI has fallen back into its descending trendline after a brief breakout on June 25 failed to hold. Selling pressure remains dominant, increasing the risk of a drop toward the all-time low at $0.40.
If bearish momentum persists, further downside is likely. However, a spike in demand could invalidate this outlook and push PI back toward the $1.01 resistance.
Pi scalp risky but lets GO!!!!Hello traders, hope you're doing well!
NASDAQ:PI is showing strong bullish signs.
It's currently moving within a falling wedge pattern.
A breakout and pump could be coming soon.
If you profit from this, don’t forget to like and follow!

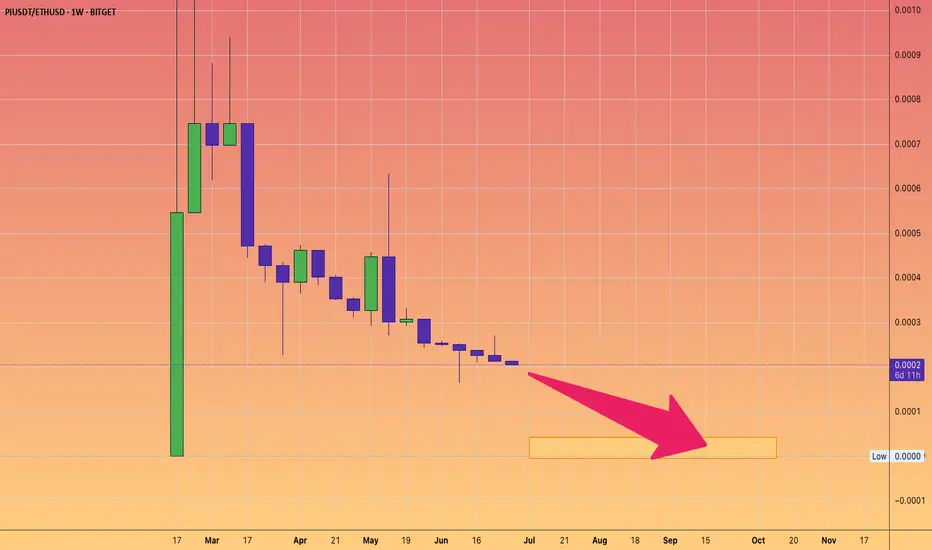
DON'T BUY Pi Network. It's a PUMP and DUMP.But feel free to short it if you desire.
This is Pi v ETH chart
It will continue it's trend to near ZERO.
Market makers will keep dumping into oblivion.
PI/USDT Final Call before it flies to the next galaxyWe see so many bullish signs.
Price could potentially tap into the discount zone
before it soars.
Good luck!

Pi can recapture the last support trend line soonLooking at the possible ascending head and shoulder pattern, Pi can recapture the last support trend line soon.

Pi USDT WILL MAKE A LONG RUN AGAINPi/USDT
After analyzing the Pi Network chart, I noticed it seems to be repeating a previous pattern, which caught my interest. As a beginner trader, I decided to test the water with a small position (just trying my luck 😅).
My entry point is 0.4946, and if I decide to scale in aggressively, I might just enter at the market price.
Here’s a quick summary:
Entry: 0.494
TP1: 0.57
TP2: 0.66
TP3: 0.85
If I have a long-term vision and the patience to hold, I might extend my take-profit levels from $1 to $1.25 or even higher.
May God make us among the successful traders 🙏🏽.
Ibrahim Ibrahim Shuaibu #Chaza 📌
#Danbolajari #CryptoTrader #CryptoTrading #Success #Hausa #crypto

$PI TECHNICAL ANALYSIS ! !NASDAQ:PI is finally breaking out of the long-term downtrend and showing early signs of strength.
Price has reclaimed the falling wedge resistance and is now pushing toward the 0.236 Fib zone around $0.69 that we need to break to move further up.
If bulls hold momentum, the next target could be $0.88 (0.382 Fib), with $1+ in sight if the trend continues.
The structure looks bullish, but watch for a clean breakout and retest, and continuation.
DYOR, NFA

PI's situation+ Target PredictionThe price has broken the ascending wedge, and this could push it toward the middle of the channel, potentially happening very quickly.
Best regards CobraVanguard.💚
