PI Possible Movement.At some key level marked for buy entry... there are possible entry in those zone. which a few can take with low risk and propper risk to maximize profit
PIUSDT trade ideas

Good Short Entries.Pi coin in my Opinion is extended and should drop.
1- There are 2 sell setups.
2-One from this price but small lot and stop because Risky.
3-Second can be best if that high forms.
4-Use Stop and book some profit.
5-Never give market all profit nor book all profit, leave some at breakven.
Good Luck May you be Profited.


PI coinAfter a strong rise in price and volume Pi coin is now showing stability at its golden pocket. considering weekends having slow volumes and range bund price action, Pi coin is also expected to maintain the price range of 0.58-0.59. however aligning with pricing of btc and near weekly close it price expected to pump till .7 or above. its ADX is trending at 4hrs and daily, its stoch rsi is about is bottoming. rsi showing multiple divergences at 4h and LtF. it is forming butterfly pattern with expected "C" at 0.5603, but as it is showing strength at golden pocket so it is expected to go above from here that is 0.5833. that is why I suggest 3 entries for average pricing and avoid missing any opportunity.
Thus take entry with confluences like
1.BTC bottoming at 4h
2. weekly close
3. rsi golden cross
4. C leg of harmonic butterfly
5. bottoming of stoch rsi
Here is the setup
entry 1. 0.5833 10% of ur investment
entry 2. 0.5606 30%
entry 3. 0.5496 %
SL 0.54
Tp1. 0.576
Tp2. 0.614
Tp3. 0.6685
Tp4. 0.702

pi coinAfter a strong rise in price and volume Pi coin is now showing stability at its golden pocket. considering weekends having slow volumes and range bund price action, Pi coin is also expected to maintain the price range of 0.58-0.59. however aligning with pricing of btc and near weekly close it price expected to pump till .7 or above. its ADX is trending at 4hrs and daily, its stoch rsi is about is bottoming. rsi showing multiple divergences at 4h and LtF. it is forming butterfly pattern with expected "C" at 0.5603, but as it is showing strength at golden pocket so it is expected to go above from here that is 0.5833. that is why I suggest 3 entries for average pricing and avoid missing any opportunity.
Thus take entry with confluences like
1.BTC bottoming at 4h
2. weekly close
3. rsi golden cross
4. C leg of harmonic butterfly
5. bottoming of stoch rsi
Here is the setup
entry 1. 0.5833 10% of ur investment
entry 2. 0.5606 30%
entry 3. 0.5496
SL 0.54
Tp1. 0.576
Tp2. 0.614
Tp3. 0.6685
Tp4. 0.702

Pi Coin Trend 2.So far trend for pi coin shows bulls and bear fighting for control in 0.6 price range.
NOTE: 0.6 is the Mid point of 0.8 & 0.4 - the highest and lowest prices on April 5th.
Two trends have emerged where Bears Pull the Peaks lower while Bulls push the Troughs higher.
A clear Uptrend will push towards 1.0 with resistance at 0.75 - 0.78.
A break past 0.55 will make a clear downtrend that will push towards 0.288.
We should have a clear trend by 6th May.

Let watch outHi traders, the buyside liquidity at 0.7827, is a strong zone market have tested it twice and failed to break out. The next buyside liquidity the market will be interested is at 0.5741.
I will be patiently waiting and stay watchful

PI UPDATEHello friends
According to the triangle pattern that the price has formed, you can see that we had a decline and after that the price has managed to create a small ascending channel that indicates the inflow of money and we can expect the price to grow to the ceiling of the channel within the channel itself and in case of failure in the lower ranges, other buying steps have been identified.
*Trade safely with us*

PIUSDT Daily Technical AnalysisPIUSDT Daily Technical Analysis
Pi Network Coin indicators are POSITIVE.
On April 14th, Pi Network Coin faced a strong sell-off after failing to break above the 21-day moving average (0.75121), dropping down to the support level at 0.59073 before attempting to recover. If this support holds, it may test the 21-day moving average (now at 0.71713) again. If it can rise above this level, it will also break through the 0.69100 resistance at the same time. Overall, we can say that Pi Network Coin has halted its downtrend and increased the probability of a new upward move. Positive news from the Pi Network team could support a price increase. At these price levels, accumulating Pi Network Coin for long-term investment might be a reasonable decision. The final decision is yours. In the medium term, there's also a possibility that Pi Network Coin could retest the $3 level.
For users of the Pi app who have locked coins, if there's no urgent need, they can choose to relock their coins for another 2-week period instead of selling. They can then track the price every two weeks and decide to relock again if appropriate. The long-term potential for the price to reach much higher levels still remains strong.
THIS IS NOT INVESTMENT ADVICE.
The information, comments, and recommendations here do not constitute investment advice. Investment advisory services are provided within the framework of an agreement to be signed between the investor and brokerage firms, portfolio management companies, or non-deposit-taking banks. The content shared here reflects only personal opinions. These views may not be suitable for your financial situation, risk, and return preferences. Therefore, no investment decisions should be made solely based on this content.
If you'd like to avoid missing out on our technical analyses with positive or risky indicators, please follow and like us — we'd appreciate your support!

PIUSDT Daily Technical AnalysisPIUSDT Daily Technical Analysis
Pi Network Coin indicators are POSITIVE.
After experiencing a sharp decline, Pi Network Coin started showing sideways price movements following the positive action on April 5. Currently, it is trading above the support level of 0.5087. With today’s positive movement, a slight increase in volatility is also observed. If the positive sentiment in the cryptocurrency market continues, Pi Network Coin is likely to show upward movement as well. For stronger support and bullish momentum, it is important for the coin to break through the resistance levels at 0.6910 and 0.7711. Additionally, if it can break above the 21-day moving average around 0.8060, it may gain strength in the medium term and potentially reach back to the $1 level.
THIS IS NOT INVESTMENT ADVICE
The information, opinions, and suggestions here do not constitute investment advice. Investment advisory services are provided through an agreement between the investor and authorized institutions such as brokerage firms, portfolio management companies, and non-deposit banks.
The content on this page reflects personal opinions only. These views may not be suitable for your financial situation or your risk and return preferences. Therefore, no investment decisions should be made based solely on the information and writings on this page.
To avoid missing any of our analyses with positive or risky technical indicators, feel free to follow and like us — we would really appreciate it!

Cup and handle formingI've been watching PIUSDT.P since launch as I have been part of the program in its early days of inception. I have over 8000 mined pi, 1700 of which I cashed in at launch as a "thank you" that ill probably kick myself later on.
Im not overly familiar with this Cup and Handle formation but it caught my eye just now after I received a notification of a trendline break last night.

Pi Network is a stablecoin? “Cryptocurrency is becoming more popular. A legal framework for stablecoins is a good idea.”
Jerome H. Powell
The market, global economy is entering a greatest thunder storm, yet not end.. and it is still going. The financial market, organization, banks, ets.. are now getting fear, panicking on what is happening to the market crash, and new tariff pause.
Yet, there is a crypto..still not yet plumeting crashing and waitting the game changer. Crypto already grow rapidly fast years by years, and proven in the market crash, covid , the crypto still strong.
The price currently trying to breaking trough resistance and still in the bearish for the moment.

PI/USDT to Grab Discount Zone FirstPrice consolidated/accumulated at 0.7400 which ultimately made a bearish move.
The momentum was so strong that it ignored the level.
Price is looking to grab the discount zone before going bullish.
Pi Coin Trade Setup (30-Minute Time Frame) 16/04/2025Market Structure: Currently moving in a zig-zag pattern, indicating potential consolidation or corrective phase within a broader trend.
Entry Price: 0.6630
Target Price: 0.7250
Stop Loss: Below last swing low at 0.6210
Risk/Reward Ratio: Approx. 1:1.6
Trade Bias: Looking for a bullish breakout from the zig-zag range. Entry aligns with potential continuation if price breaks upward from consolidation.
Disclaimer: This is not financial advice. Trading cryptocurrencies involves significant risk and may not be suitable for all investors. Always do your own research and consult with a qualified financial advisor before making any investment decisions.

Pi Network Price tracking every two hour, bearish or bullish ?This coming week is getting more exictement will be. The Pi Coin getting more attention in crypto space, and for surely the big investors are now waitting for the curcial price to enter a buy price.
Over the past 24hr, at this writting now. Pi Coin network has reach for more 16% incresement in 24hour, and 14% invreasement in past 7 days. Bitcoin, Eht, Sol, and the rest still far behind in term of growth percentages.
If the calculation is right in June or July 2025 Pi coin will get mark of $3-4 price.
Stay in touch, get more Pi..


PI/USDT:SIGNALHello friends
Given the price growth, you can see that we had a stop and a triangle pattern was formed, which is a continuation pattern of the trend.
Now, given the complex market conditions, our suggestion to you is to buy in stages and be sure to observe risk and capital management.
I have also specified goals for you.
*Trade safely with us*

PIUSDT Rocketing to Pluto SoonThis could be it.
Price touched the discount zone.
We saw divergence in AO signaling weakening and potential flip to the upside.
We saw change of character.
Price reacted to 0.618 retracement.
Price could go up from here any time.

Eat a pie with PISo much closed narrow i mean the worlds something most narrow move you could expect

PI will bottom up soon. Many of the holders might be sold their bags right now. Bag holders will be waiting for any leg up, people accumulating right now will be holding until any listing news comes up. NASDAQ:PI CRYPTOCAP:USDT
#Crypto #Pi #Network #Binance

Pi Network has began to soar?Previously, Pi Network was keep on silent with the pioneers getting frustrated with declining prices. Just get reminded that Pi core team already mention that keep posted any NEWS coming. They are getting more working hours more than we had. So, pioneers just keep on what your doing daily, let the team core doing their part.
Global payments company BANXA has made a big splash by purchasing over 30.5 million Pi Coins, worth around $19 million. But this isn’t just another crypto deal—it’s a clear sign that major players are starting to take the Pi Network seriously as a future leader in digital payments.
With this move, BANXA now lets users buy Pi directly on its platform and send it straight to their wallets. This makes it much easier for users to access Pi, especially as the community keeps growing.
BANXA’s purchase isn’t just about owning Pi—it’s a vote of confidence in the entire Pi Network. It shows that Pi is no longer just an experiment, but a growing digital economy with real-world potential.
By supporting direct purchases and improving infrastructure, BANXA is helping Pi shift from a mined-only coin to one that has real value in the market.
This is a new steps in the crypto digital payment to all nation wide, with uncertain economy crashing today lots of countries are seeking the safest way to sustain economy. The traditional way of economy has getting older and slower.
My personal opinion is, Trump's crypto team now silently work closely with Pi core team to develop a new bond tie of digital economy, and will makeing a huge and powerfull worm hole of economy, that may suck any all kind of economy into it. Looks like a Si-Fi movie.. Lol..
The chat can be automaticly updated in every two hours, and I try to keep a new updates regarding Pi Coin , for the sake of Pi Pionners movement and Pi coin awarensess. Keep watch closely until th cup and handle chart pattern completed.

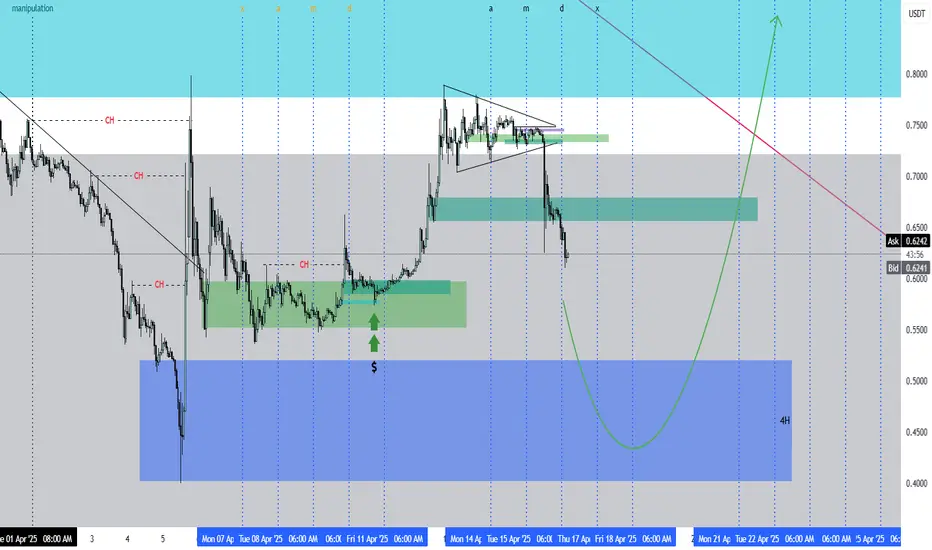
Pi nerwork broke the trend? We all looking a same goal. the CGV 314,159... but before that happen it has to make a LOGIC sustainable price and a strong foundation/ base.. like the skycraper tall building it mus build from the botom of the earth. We never see a tall building start from 900 meters and going up.. Maybe in Mars..
Refering to the chart, some a new key has been broken, it is the 4 hour bearish trendline and a triangle pattern also broken. With a discount below it, buyers in exchange can buy a cheap price. Maybe a corretive pattern will make a double bottom, or it can develop a W shape before getting to a new high.
Stay positive, keep on mining and God bless.

Trading opportunity for PIUSDTBased on technical factors there is a Buy position in :
📊 PIUSDT
🔵 Buy Now
🪫Stop loss 0.47000
🔋Target 0.99000
📏 R/R 3,3
💸RISK : 1%
We hope it is profitable for you ❤️
Please support our activity with your likes👍 and comments📝
