Pi network is trying hard.I know recently the Pi pioneers are getting mad because of the prices are getting lower, be chill, be cool guys.. that is the process to making a new high and lows. It has to be that way in the market. All what we need it patients and time, the rest let the news and core team make it happen.
According the chart pattern, we need to wait the breaking of 4hour chart structure bearish patten to be broke, and waitting the next equil to break up. Foresee if the equil is brok, we will see the sunlight of $1.00 mark up.
PIUSDT trade ideas

PIUSD - ANALYSIS👀 Observation:
Hello, everyone! I hope you're doing well. I’d like to share my analysis of PI Network (PI-USD) with you.
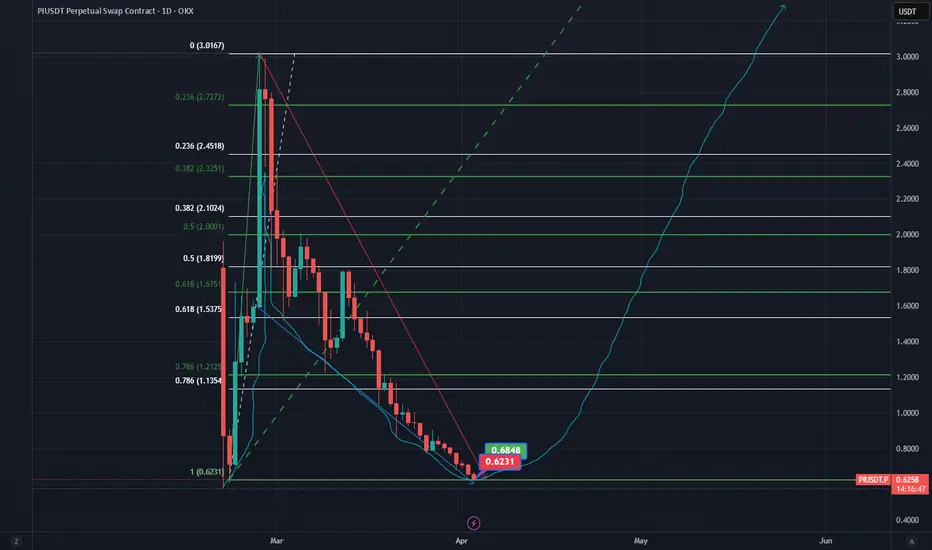
Looking at the PI Network chart, I anticipate a price decline towards the 78.60% Fibonacci level, which should bring the price down to 0.4854. After reaching this level, I expect a potential price bounce upwards towards 0.6466. However, if the 78.60% Fibonacci level breaks to the downside, I expect further price decline with a target of 0.100.
📉 Expectation:
Bearish Scenario: Price reaches 0.4854, followed by an upward move to 0.6466.
Worst-case Scenario: Break below the 78.60% Fibonacci level → further downside targeting 0.100.
💡 Key Levels to Watch:
Support: 0.4854
Resistance: 0.6466, 78.60% Fibonacci level
💬 What’s your take on PI Network this week? Let me know in the comments!
Trade safe

Pi network updateThis is the end of the bearish, mire than +30% has made bullish for today. The rest will be History.

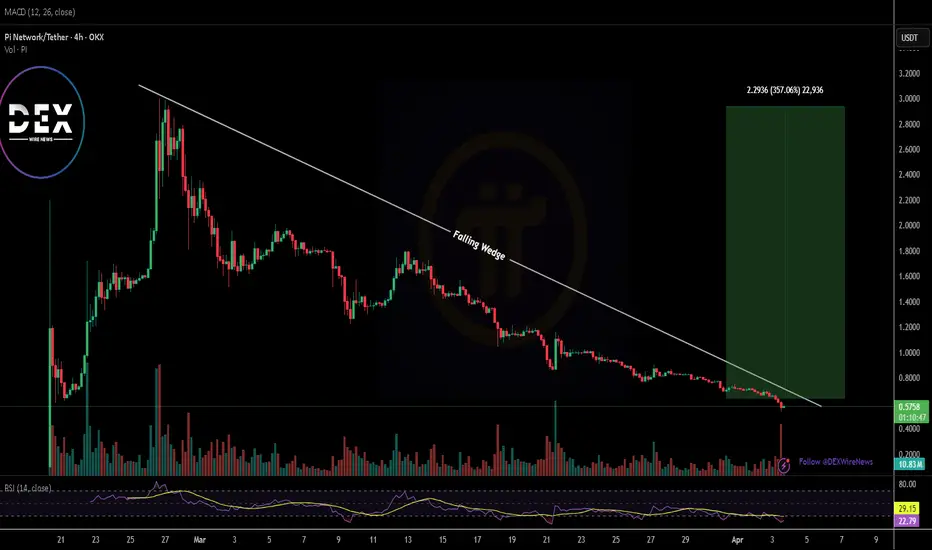
Potential bounce back to 3$it was doing a sell off for a while with a 0.4 bounce. NASDAQ:PI broke out its falling wedge potential 3 dollar target. currently doing a retest to 0.5 area.

Pi coin price prediction up side targetswe have sell momentum but most chances are that it will bounce from here and make all time high again in upcoming months.

80% DropIs an 80% Drop Ahead for Pi Network (PIUSDT)? 📉
🔹 Key Supports: 0.50, 0.10, and 0.01 USD
🔹 Key Resistances: 0.60, 0.70, and 1.00 USD
✅ PIUSDT is in a downtrend, and after breaking below 0.60 USD, it has dipped under the 0.50 USD support zone. If this trend continues, a decline toward 0.10 USD (approximately 80% drop) is possible.
📉 If sellers maintain control, breaking 0.50 USD could accelerate the downtrend.
📈 However, reclaiming 0.60 USD may lead to a corrective move toward 0.70 USD and potentially 1.00 USD.
🔍 Conclusion: The trend remains bearish, and a confirmed breakdown of 0.50 USD increases the likelihood of a drop to 0.10 USD.

Breaking: $PI Dips 18% Today, Reaching New All-Time Low The price of the notable crypto asset NASDAQ:PI saw a nosedived today plummeting 18% reaching a new all time low price albeit the general crypto landscape is in a bloodbath with CRYPTOCAP:BTC dipping to $81k pivot similarly assets like CRYPTOCAP:ETH , CRYPTOCAP:SOL , $TRUMP and a whole lot of tokens saw a massive selling spree except for NYSE:FUN token that surged 55% today.
As of the time of writing, NASDAQ:PI is down 13% with the RSI at 21, this is hinting at a bullish reversal prior to the falling wedge pattern depicted in the chart. Other factors that attributed to the crypto currency and stock market downturn is the Donald Trumps' tax Tariff edict leading to Over $1.65 trillion wiped out from US stock market at open.
What Is Pi Network?
Pi Network is a social cryptocurrency, developer platform, and ecosystem designed for widespread accessibility and real-world utility. It enables users to mine and transact Pi using a mobile-friendly interface while supporting applications built within its blockchain ecosystem
Pi Price Live Data
The live Pi price today is $0.568544 USD with a 24-hour trading volume of $437,786,014 USD. Pi is down 16.31% in the last 24 hours. The current CoinMarketCap ranking is #27, with a live market cap of $3,862,744,520 USD. It has a circulating supply of 6,794,101,040 PI coins and a max. supply of 100,000,000,000 PI coins.
There is an upcoming Bullish trendIn the daily chart of Pi Network, we see substantial bullish reversal signals, the first being the Massive Bull Flag. Then, multiple timeframes of Bullish Divergence, the 3rd is the predictable Bullish Adam and Eve pattern.
In any possible bullish scenario, it is undeniable that the next strong key support is the current 0.57 area
Just In: $PI Dips 6% Losing The $1 Pivot- Is There Still Hope?The price of the crypto currency NASDAQ:PI saw s noteworthy dip today, down by 6% approaching All time Low (ATL). With massive selling pressure, NASDAQ:PI has lose the $1 pivot to the bears.
However, with the appearance of a falling wedge, it clearly hints at an impending bullish reversal on the horizon with a speculated 350% surge albeit the crypto is having its own fair share of the marker's volatility.
With the RSI at 31 further hinting at a trend reversal, a breakout might be lurking around the corners.
Pi Price Live Data
The live Pi price today is $0.678989 USD with a 24-hour trading volume of $213,832,968 USD. Pi is down 5.03% in the last 24 hours. The current CoinMarketCap ranking is #26, with a live market cap of $4,612,460,558 USD. It has a circulating supply of 6,793,134,138 PI coins and a max. supply of 100,000,000,000 PI coins.

A possible massive bull runBased on the initial trend pattern, the Bull Flag did not happen; however, it did not have any more significant major dump, instead, it became an apex of massive support printing into a very big Adam and Eve pattern.

PI – Potential Head & Shoulders Pattern Forming📉 PI – Potential Head & Shoulders Pattern Forming
We may be seeing a possible Head & Shoulders structure on the chart — a classic bearish pattern.
If the neckline breaks, this could trigger a downside move, so watch closely for confirmation!
⚠️ Not confirmed yet — stay alert and manage your risk.
📍 Key zone: Neckline support area.
🔔 Follow for more updates and live trade setups

Pi Network , a cup and a handle.My opinion is the trend is forming a cup and a handle pattern. It's may take weeks to complete the pattern.
If you are a holder, just hold it. Nothing too loose here, mining still have for the pioneers. No body knows what is happen next, in the future.

Pi network predictionWill this be the last low of the trend or it will continue to go down?
Don't sell your pi now, you gona regret it later.
Pi is the next Bitcoin? Join My Team to Mine Pi ~
It is free, all you need to do is click an icon once every 24 hours and earn Pi coins daily:)
Your phone will do the job for you.
Steps to join:
First, please ensure you take notes on everything, this is a long-term plan!
If you lose your info, you will not be able to withdraw your coins in the future!
1-Download the "Pi Network" app from the Apple Store or Play Store
2-Register using your real identity, it will help you during the verification period
3-Use my username in the invitation code (Nshanv)
Once you are in the app, the next step will be verification where you need to download the "Pi Browser"
I will be sharing another post on how to verify your account, later.
Once you complete the steps, send me a message, and let's connect.

PI LONG SETUP ALL trading ideas have entry point + stop loss + take profit + Risk level.
hello Traders, here is the full analysis for this pair, let me know in the comment section below if you have any questions, the entry will be taken only if all rules of the strategies will be satisfied. I suggest you keep this pair on your watchlist and see if the rules of your strategy are satisfied. Please also refer to the Important Risk Notice linked below.
Disclaimer

PI PI
March 26, 2025
8:10 am
PI is about to reverse and is currently sitting around our Wave C levels (0.8578 , 1.0578). But personally, I think we could still see a move lower (potentially dipping below $0.80 or around that area as a possible bottom.)
Just to be clear, this is purely from a technical perspective, and I'm not a fan of the coin myself.
PI is pretty controversial in the crypto space. It's not even listed on Binance yet, which is another reason I think it could still trend lower.

PI BUY TIME IS NEAR!!!In-Depth Analysis: Pi Network (PI) Falling Wedge Pattern & Potential Buying Opportunity at $0.75

PIUSDT Daily Technical AnalysisPIUSDT Daily Technical Analysis
Pi Network Coin indicators are NEGATIVE. The selling pressure on Pi Coin is still ongoing. Indicators are at a low position but still appear negative. If it can move sideways above the 0.92957 support level, the chances of recovery in the coming days may increase. The 0.92957 - 0.858 price levels are important support points.
It seems that the Pi Network team is somewhat weak in social communication. The applications created on the platform are still inactive, and the KYC period for users who joined before the Mainnet has now expired. There has been no explanation regarding the coins removed from accounts, or at least, we haven't seen one. In fact, no statement has been made on their YouTube channel either. If the coin does not break below these support levels, it could create a buying opportunity for positive price movements in the future. There is currently no clear information, so we will see how things develop.
NOT INVESTMENT ADVICE.
The information, comments, and recommendations provided here do not constitute investment advice. Investment advisory services are offered within the framework of an agreement between clients and brokerage firms, portfolio management companies, and non-deposit banks. The content on this page reflects only personal opinions. These views may not be suitable for your financial situation, risk tolerance, or return preferences. Therefore, investments should not be made based on the information and writings on this page.
To avoid missing our analyses of both positive and risky technical indicators, follow us and like our content—we would appreciate it!

PIUSDT Hourly Technical AnalysisPIUSDT Hourly Technical Analysis
In the 1-hour technical analysis of Pi Network Coin, the selling pressure continues as it failed to break the 1.21 resistance. The price has dropped to the 1.0770 support level. If this support is also broken downward, the next support levels are 1.031 - 1.010. Our current expectation is negative. Next week, we may shift to daily technical analysis since daily technical data is also becoming clearer. However, for now, the daily outlook also appears negative. If there are sharp declines, buying at lower prices could create a potential for significant long-term returns.
THIS IS NOT INVESTMENT ADVICE.
The information, comments, and recommendations provided here do not constitute investment advice. Investment advisory services are provided within the framework of an investment advisory agreement signed between the investor and brokerage firms, portfolio management companies, or non-deposit banks. The content on this page reflects only personal opinions and may not be suitable for your financial situation, risk tolerance, or return expectations. Therefore, no investment decisions should be made based on the information and statements provided here.
To stay updated on our analyses with both positive and risky technical indicators, please follow and like our page. Your support is greatly appreciated!

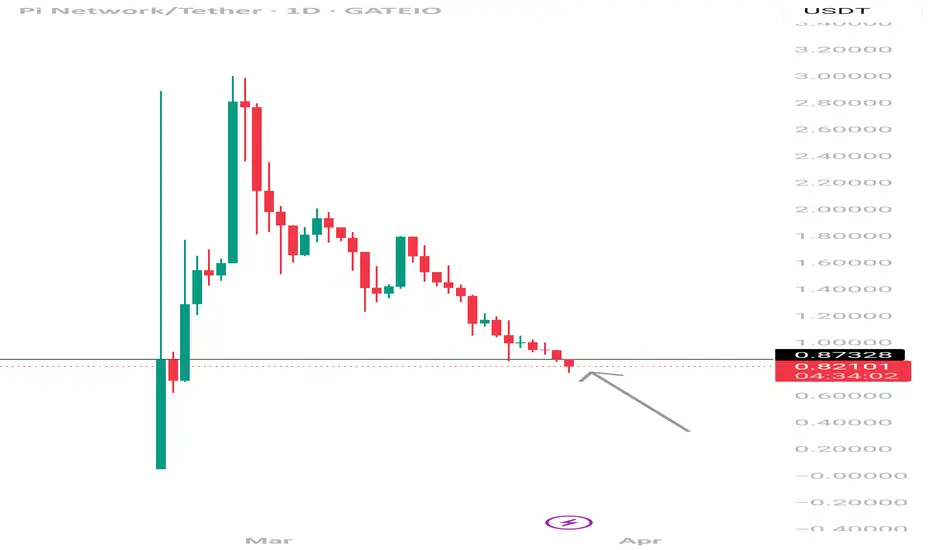
Pi Network Bounce... The Pi Network's price has been experiencing significant fluctuations recently. After a sharp drop of over 20%, the price fell below $0.90, with resistance levels identified at $1.20 and $1.50-$1.80. If the price breaks below $0.80, it could decline further to $0.60.
However , some experts suggest that the Pi Network could rally back to $3, citing factors like potential exchange listings, merchant partnerships, and ecosystem advancements. The introduction of Pi-based domains and growing adoption might also contribute to its recovery.
The market sentiment remains mixed, with concerns about delays in the mainnet launch and exchange listings. If you're following Pi Network closely, it might be worth keeping an eye on these developments.
And one more thing, If Pi network will enter the ETF market...
If Pi Network were to enter the ETF market, it could potentially boost its price and credibility significantly. Analysts suggest that an ETF approval by the SEC could lead to increased inflows and validate Pi Network as a legitimate cryptocurrency. This move might also quell concerns about its legitimacy, as ETFs often attract institutional investors.
Pi Network's large market cap and liquidity make it a strong candidate for ETF consideration. However, no application for a Pi ETF has been made yet. If approved, it could lead to a surge in Pi's price, with some predictions suggesting it might even reach $100 in the long term.

From Rejection to Explosion: PI Breaks FreeThe price of PI/USDT has been moving within a well-defined falling channel, consistently facing rejection from the upper trendline and finding support at the lower boundary. Notably, the price has bounced multiple times from the falling support line, indicating it as a significant dynamic zone.
Recently, the price broke out of this descending channel with strong momentum, suggesting a potential trend reversal. The breakout candle is accompanied by high volatility, signaling bullish strength.
Additionally, the previous support zone, which turned into resistance, has now been reclaimed. This flip adds further bullish confirmation.

Pi coin: here are some key levelsPi coin: here are some key levels.
After hitting TP for out last sell trade for Pi,
Here are some levels I am looking at if the sell pressure continues.
Trade with care

Where is Pi network heading ?Looks like there is a selling pressure here, the feeling of loosing is more higher.
I don't expect to see bearish trend but I'm expecting for a long run holder.
If the trend is breaking the supports, there is chances for more room to bullish run in coming months.
