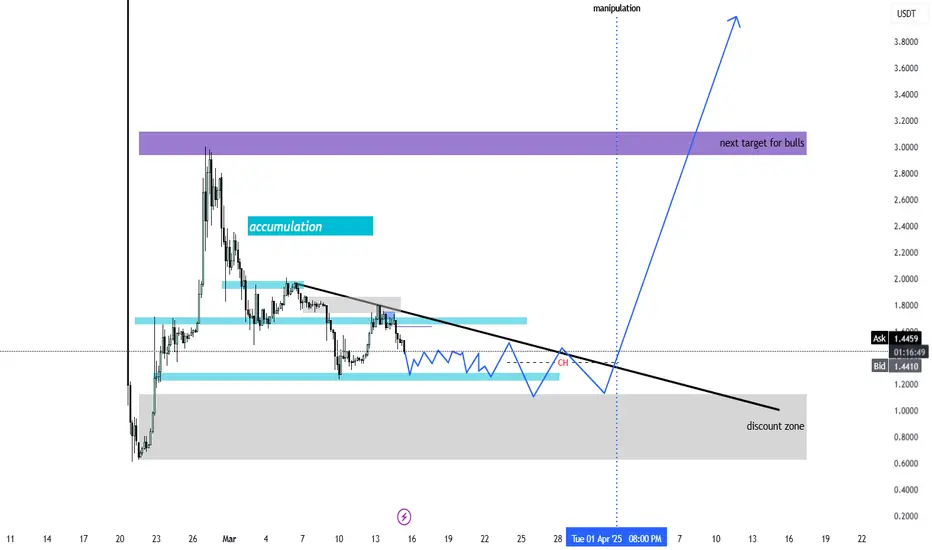
Bullish ScenarioI'm seeing a possible bullish harmonic Leonardo pattern. This phase is an accumulation zone for Pi Network.
PIUSDT trade ideas

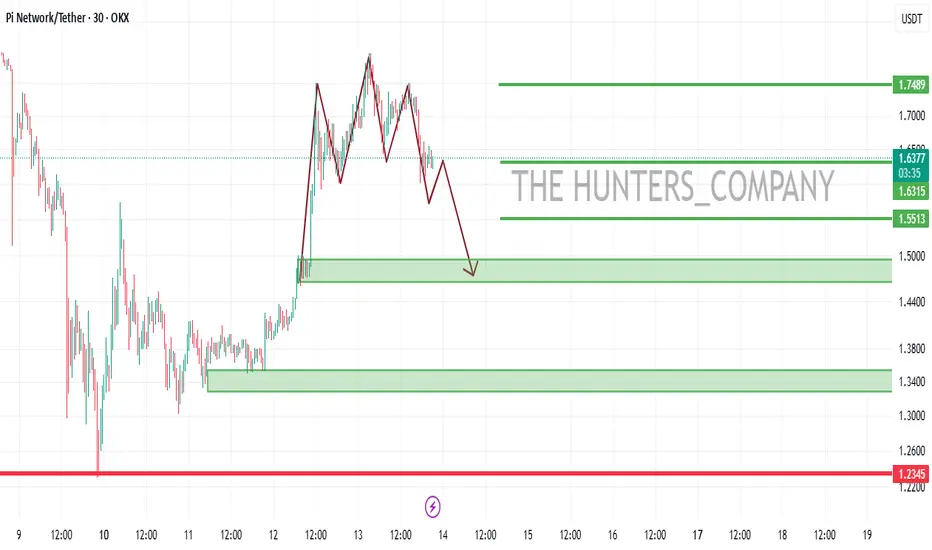
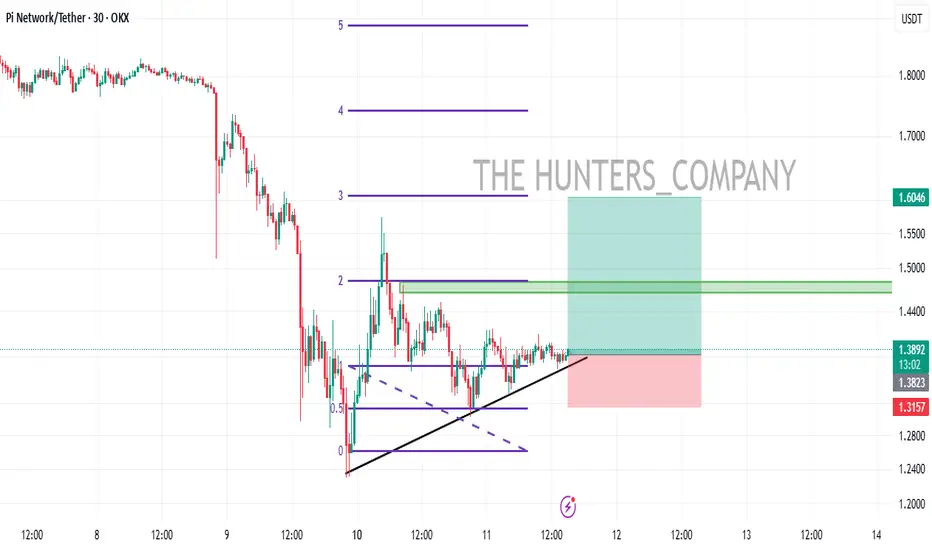
PI ANALYSIS (4H)Given the bearish CH and the formation of multiple supply zones, this asset is expected to move toward the green zone.
Targets are marked on the chart.
A daily candle closing above the invalidation level will invalidate this analysis.
For risk management, please don't forget stop loss and capital management
When we reach the first target, save some profit and then change the stop to entry
Comment if you have any questions
Thank You

PI: A Breakout is LoomingLooks like PI is ready to breakout the symmetrical triangle pattern in either upside or downside. What's your take?

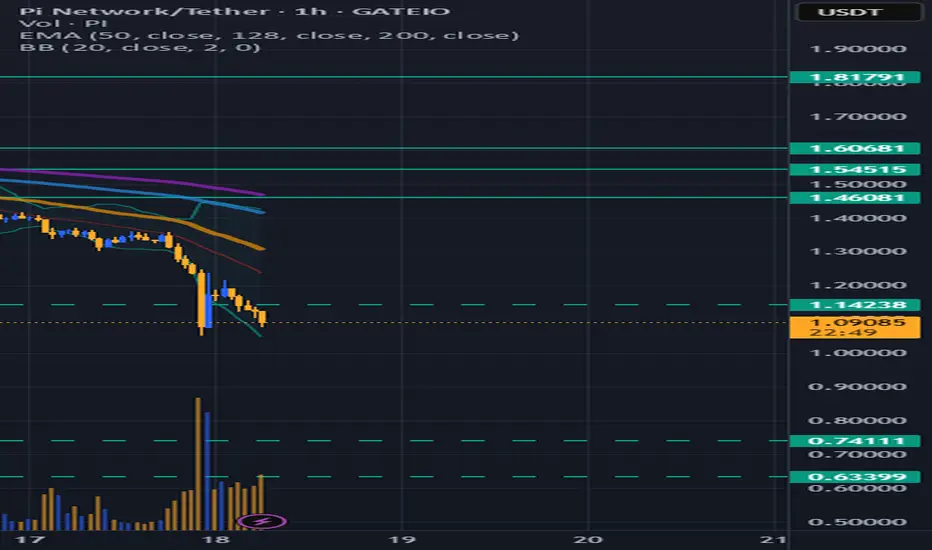
Race To Zero? Pi To Sub A DollarPi, the coin that drew a line between the haters and believers. We've seen Pi rise then fall on the first trading days, then a massive recovery to almost $3, but now its been going straight down. We must also note that BTC is down 13.5% in a month, while Pi is down 60% from all time highs, but 70% from the lows of $0.60. What could be causing this?
Cons
- Binance Listing hasn't came to light after the community poll wanted them to list Pi.
-Core has been selling Pi, now speculation was for Pi listing on Binance, but at this time its unknown what the funds are for.
-Pi domains hasn't been received well and imo isn't needed, since the payment is open source and amazon doesn't need a pi domain to add payments. Only bringing this up since someone bid for amazon pi domain for 30k pi, which was about 42,000 at the time roughly.
-Bitcoin is also down, which is causing crypto markets to crash.
-Tariff wars bringing global markets down.
-PiCore team roadmap is unknown whats next.
-From Reddit, many applications are stuck in verifying process which is limiting the use of the Pi browser.
-More unlocked Pi is hitting the market every couple weeks.
Pros
-User base keeps growing, which the "mining" rate got cut
-Transaction speeds are instant
Trading Zones
Now Trading zones are interesting, but with it going down, its catching a falling knife. Pionex grid trading doesn't work, since the volitily is down and then it drys up. With current price range, 1.14 would be support, but its dipping under creating resistance. EMA's are down and heading towards bearish. Next target is $0.90 then it drops to the trading range of 0.60-0.74 .
Final Thoughts
I'm personally sold out, but have over 3k Pi locked from 3 years. I may rebuy Pi under a dollar or if it stabilizes in its price. I moved to Solona for the time being, but if BTC crashes again it might be best to stick with USDT or a stable coin and wait till Wednesday for JPowel to see what hes going to stay.
PIUSDT : Head & Shoulders Signals a Major Drop Incoming!Yello, Paradisers! PIUSDT is flashing strong bearish signals! The price has formed a Head & Shoulders pattern right on the resistance trendline of a descending channel—this combination significantly increases the probability of a sharp move to the downside.
💎PIUSDT breaks below the neckline and closed a candle which validates the bearish setup, increasing the likelihood of further downside.
💎However, We have to wait for the proper retest of the neckline, patience is key for the right entry.
💎On the flip side, if PIUSDT breaks above the resistance zone and closes candle above it, the bearish setup will be invalidated.
Stay disciplined and wait for confirmation, Paradisers. A fakeout could trap impatient traders—don’t be one of them! 🎖
MyCryptoParadise
iFeel the success 🌴

Pi has broken an important TLPi has broken an important TL
where is PI going from here?
Do you see $1.22 coming to reality?

PIUSDT Price ActionPIUSDT is trading in a descending trendline and bounced off from a psychological level and major support. Wait for a retest of the trendline & confirmation of breakout. Not an investment advise.

Pi o PiResistance Zone: Identified between $1.75 and $1.90.
Support Level: Strong support near $1.20.
Projected Upside: Potential rally towards $2.50.

Is PI Network About to Reclaim $3 Again ?Hello Traders 🐺
In this idea, I want to talk about the PI coin, which, in my opinion, is the best mobile mining app so far. I've been mining PI coins for at least 4 years and still holding them. PI Network has a solid team behind it and a strong community!
If you're still holding or planning to buy some for the upcoming Altcoin Season, I'm here to break down the chart and show you what's happening right now. So stay tuned until the end, and don't forget to like and follow for more support! 🌟
Chart Analysis 📈
As you can see, we have a strong downward-sloping blue trend line. Currently, the price seems to be forming an Inverse Head and Shoulders Pattern, which is a bullish signal. 🎯
However, make sure to wait for the breakout and retest as new support, at least on the 1H time frame. Regarding the price target of this pattern, I personally believe the next major resistance to the upside is the current all-time high around $3. 💰🔥
I hope you enjoy this idea! 💡
🐺 KIU_COIN 🐺

The market is consolidating into a triangle patternThe market is creating triangle pattern. The better way to trade is let the triangle to be brake either up or down before entry the trade

New PRZ area to buy PIThe price failed to break the major sell trendline and has broken support, moving downward. Based on my analysis, wave C is complete, and the price is now ready to go up again. This is a shared idea, not a buy call. Thanks

PI...Hello friends
Given the good growth we had, we now have the opportunity to buy in the pullback...
You can buy in steps within the limits we have specified for you with capital management...
*Trade safely with us*
Updated PI analysisPI is still going in a down trend for now. Unless a confirmation happens things remain bearish. My assumption is that only after breaking down below 1$ and lengthy accumulation, the major remaining exchanges will be going to list PI. And if any bad news comes before that no more listing will happen.
NASDAQ:PI CRYPTOCAP:USDT #Crypto #Pi

PI/USDT to Skyrocket this yearI have been watching this asset for a long time.
Since its launch early this year, its been accumulating
and liquidating. Keep the patience. Keep holding.
It will go bullish soon this year.
Picoin short back to $1.35 tonight or lowerJust now opened a short on Picoin. I saw it late so didn't get best entry but I think my stop is at a good point where its less likely to get hit before tp.
Falling wedge on the 4hr.Looks like a potential retest of the falling wedge and key $1.50 support.
If this fails we are likely to retest the $1.25 range.

PIUSDT on lead for his ATH?!Founda: On 03.14 (PIDay) an important announcement is planned (Listing on Binance? / End of the KYC dateline...)
Technique:
-Formation of a bullish flag H2
-Sup and Resistance Zone $1.60
-RSI.Stoch D1 in oversale
A bullish signal will probably lead to the ATH or the $5🚀📈
PI

cup and handle ? sharing an idea .. not an advise
Pi did form a cup and handle.
Fibo target 1.618 at 2.484 usdt

Projection Price for PiMy analysis shows that the PI price can go up to the (X and Y) area. In that area (X and Y), there may be a retracement after completing the five-wave pattern.

Pi Network Bullish Part.2The token is trading around $1.66, showing a 20% gain in the last 24 hours. It has been fluctuating between $1.00 and $2.00, with key resistance at $1.502.
Anticipation of a potential Binance listing has fueled interest. A recent community vote showed strong support for listing Pi on Binance, which could significantly impact its price3.
The Pi Network's sixth anniversary on March 14 and developments like KYC completion and migration deadlines are driving demand.
The Relative Strength Index (RSI) and Chaikin Money Flow (CMF) suggest bullish momentum, indicating potential for further price gains if the trend continues.

PI/USDTStrength
PI/USDT looks good from the current price b/c it retraced from fib golden numbers as well as created a proper AB: CD pattern.
We can expect a good.
Weakness
The super trend is still bearish in the daily time frame.

PI/USDT (UPDATE)Hello friends
Given the price drop, now with the formation of a triangle and the price compression, we will probably have a good pump, so we have determined the entry point and price targets for you to enter with risk and capital management.
*Trade safely with us*
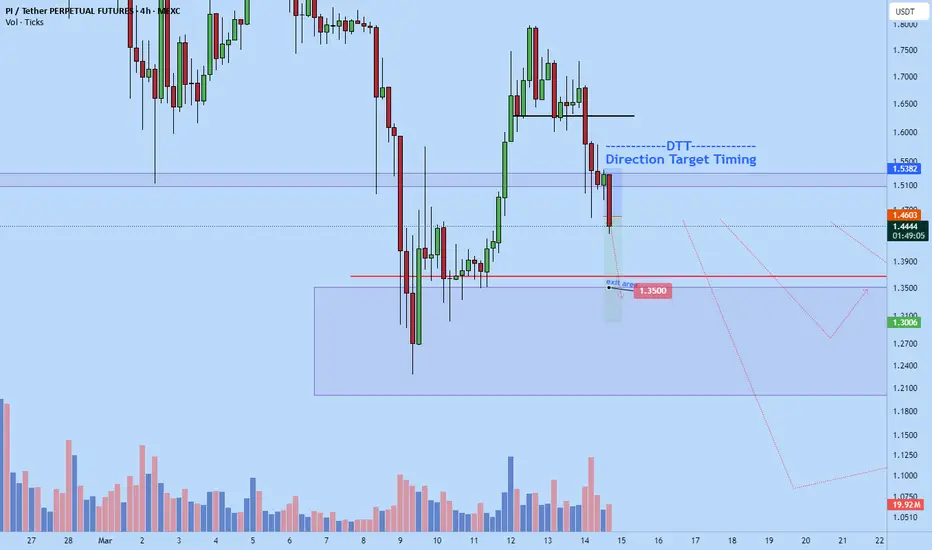
Pinetwork to collapse more to $0.7124I just now entered a pi-network short.
It looks primed for another massive dump. Initially it wasn't correlating with btc but looks like it kinda is now. Market a bit scared.
Setting 80% Tp at $0.7125
Setup is in alignment with my DTT trading strategy
