PIXELUSDT is BullishPIXEL is currently in an uptrend printing a series of higher highs and higher lows, the trend is more likely to continue. Targets are mentioned on the chart.
PIXELUSDT trade ideas

Recently Listed Games: Pixels (PIXEL)What is Pixels (PIXEL)?
Pixels is an immersive blockchain-based farming and exploration game where players gather resources, develop skills, and embark on quests in an open-ended universe.
Pixels (PIXEL) is a social casual web3 game powered by the Ronin Network, It involves a mesmerizing open-world game that revolves around farming, exploration, and creation.
PIXEL is the native utility and governance token in the Pixels ecosystem, and used in the following functions:
In-game currency:
NFT Minting: All future NFT mints from Pixels will be in $PIXEL.
VIP Membership: Users will be able to purchase VIP Battle Passes in $PIXEL.
Guilds: Users will be able to join a new social-fi feature (Guilds) by using $PIXEL.
Quality of Life Upgrades: Premium in-game features will be sold in $PIXEL.
Governance: NGM:PIXEL will eventually be used to govern a community treasury.
Private/Pre-sale Price: $ 0.005
....................................................................................................................
We are not registered or licensed in any jurisdiction whatsoever to provide investing advice or anything of an advisory or consultancy nature.
and are therefore are unqualified to give investment recommendations.
Always do your own research and consult with a licensed investment professional before investing.

Pixel with high growth potentialThis currency has a high growth potential due to its small cap market and high volume of transactions with an excellent rank, and the Fibonacci numbers of this chart should be taken seriously.
My personal target is 4.236 Fibonacci number which means $2.2863
If you come with me, hit the fly button, let's travel to the moon together

Shorter term $Pixel Idea! 25%+Hello Traders,
I have been keeping eye on this coin for few days. Charts does not have much information but this gaming coin gaining so much attention as of late. Binance also promoting it and also gamer's and trader's interest is off the charts. Great looking game combined with web3 access quite promising. Daily Volume(200mil usd+) is also very high end comparing the current market cap size(*395million usd). So I am expecting quick 25% gains. If Btc crashes or skyrockets this number could change greatly! This idea only focusing on short term play!

PIXEL Surges and May Keep Rising if Investors Don’t Take ProfitOver the last few hours, the hourly closing prices for BINANCE:PIXELUSDT have exhibited an upward trajectory, moving from $0.5984 to $0.6325. This has resulted in the formation of a short-term positive price channel.
The 9 EMA and 20 EMA have been on a steady incline, with the former moving from $0.5768 to $0.6015 and the latter from $0.5606 to $0.5793. The EMAs serve as dynamic support levels, and their upward movement suggests a bullish trend. The Pixels price consistently closing above these EMAs indicates strong buying interest and potential for further upside.
The Moving Average Convergence Divergence (MACD) values have shown progressive increases as well, with the MACD line moving above the signal line, indicating bullish momentum.
The Relative Strength Index (RSI) has also been in the spotlight, with values ascending from 69.31 to 77.08. These figures suggest that the Pixels price is currently in overbought territory, which typically signals strong buying pressure. However, traders should also be cautious of potential reversals, as overbought conditions can sometimes precede price pullbacks.
Regarding support levels, the Pixels price has established key supports at $0.6111, $0.5885, and $0.5646. These levels are critical for traders to monitor, as a break below these could signal a shift in market sentiment and potentially offer entry points for short positions. Conversely, as long as the price remains above these supports, the bullish outlook could remain intact.
A potential long entry could be when the Pixels price closes an hourly candle above $0.6306. This will be a key level to watch, as a rejection from this price point could signal the start of a temporary price pullback.
The technical analysis of the Pixels price points towards a bullish trend, supported by key indicators like EMAs, MACD, and RSI. However, the overbought conditions signaled by the RSI suggest that traders should proceed with caution and closely monitor support levels for potential shifts in market dynamics.

PIXELUSDT - LONG 22 - 24 FEB 2024Attention!
This technical analysis is for informational and educational purposes only. It does not constitute financial advice. Remember to always research and consult with a professional before making investment decisions. Good luck!

PIXELUSDT DOUBLE TOP FAILURE If double top fail then we can take long side trade.
But wait for the levels don't hurry.
Take trade according to your risk management.
PIXEL Forms Bullish Channel and May Break $0.5574Over the past few hours, the BINANCE:PIXELUSDT has shown some intriguing movements, with closing prices oscillating between $0.5321 and $0.549, before slightly inching up to $0.5439. This fluctuation has caught the eye of market watchers, prompting a deeper dive into its technical indicators and potential future movements.
The 9 Exponential Moving Average (EMA) has seen a gradual increase from $0.5376 to $0.5393, closely followed by the 20 EMA which moved from $0.5342 to $0.5361. This convergence of the EMAs suggests a building momentum, albeit with caution, as the market navigates through its phases of consolidation and potential breakouts.
The Moving Average Convergence Divergence (MACD) values have shown a slight uptick, with the signal line closely trailing. This indicates a narrowing gap between the MACD and its signal line, hinting at a potential shift in momentum. However, the histogram values, which have remained negative, suggest a cautious approach as the market decides its next direction.
The Relative Strength Index (RSI), a key indicator of the asset's momentum, has shown a gradual increase as well. This upward trend in RSI points towards increasing buying pressure, yet it remains below the overbought threshold, indicating that there is room for growth before any potential pullback.
As we look ahead, the resistance and support levels provide critical markers for potential movements. The immediate resistance level at $0.5574 poses the first challenge for bulls, followed by more formidable barriers at $0.6111 and $0.6306. A break above these levels could signal a strong bullish momentum, potentially setting the stage for further gains.
Conversely, support levels at $0.5353, followed by $0.5232 and $0.516, will be crucial for the Pixels price to maintain its current trajectory. A breach below these levels could indicate a shift towards bearish sentiment, potentially leading to further declines.

PIXELUSDT - LONG Good luck to everyone! This analysis is for educational purposes only and does not constitute financial advice. Conduct your own analysis before making trading decisions.

SHORT #PIXELUSDT We expect active sales in the order bookSHORT #PIXELUSDT from $0.4815 stop loss $0.4935
5m TF. The instrument is moving in a downtrend. Now we are witnessing a preload to the cascade of horizontal support levels. This level is 1 day old and there is a high probability that the stop losses of participants who opened their long positions have accumulated behind it. We expect a smooth approach to the level and active sales in the glass for a good true breakdown of the level.

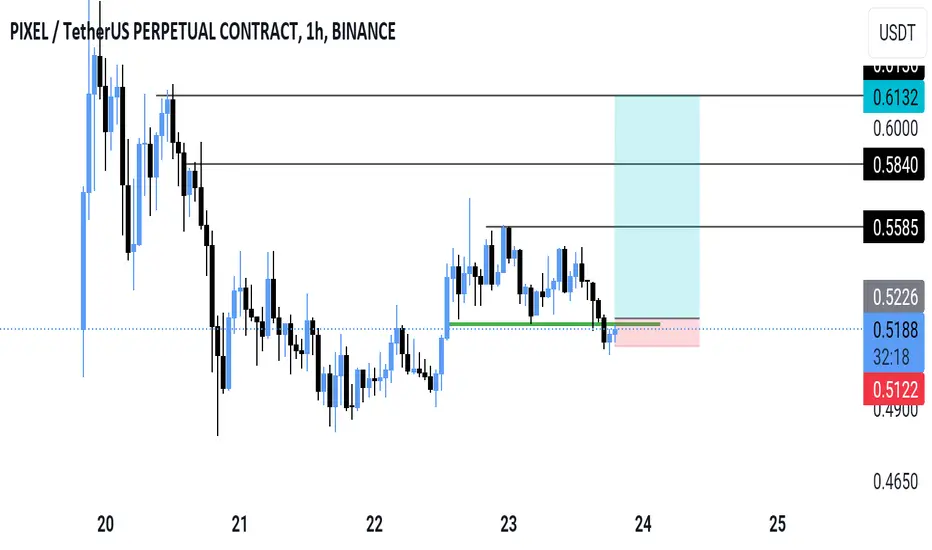
Technicals Flag Bearish For PIXEL Amidst Market FluctuationsThe closing prices for BINANCE:PIXELUSDT on the 1-hour chart have shown a slight downward trend, moving from a high of 0.5206 to lows around 0.5094, before a minor recovery to 0.5197. This recovery, while positive, does not fully offset the preceding declines, suggesting that the bearish momentum may not have fully abated.
The Exponential Moving Averages (EMAs) offer a clearer picture of this bearish sentiment. The 9-day EMA has consistently trended below the 20-day EMA, with both indicators moving downwards. This crossover and the direction of the EMAs are classic bearish signals, indicating that the momentum could be shifting towards a downtrend. The latest readings, with the 9 EMA at 0.518000 and the 20 EMA at 0.527435, reinforce the presence of bearish pressure.
The Moving Average Convergence Divergence (MACD) further corroborates this outlook. The MACD line has remained below the signal line over the last couple of hours, with histograms consistently in negative territory. Although there was a slight improvement in the histogram, indicating a reduction in bearish momentum, the overall MACD trend remains negative, suggesting that the bearish sentiment is still predominant.
The Relative Strength Index (RSI), hovering around the mid-40s and showing a slight rebound to 46.89, indicates that the Pixel price is neither oversold nor overbought. However, the RSI's position closer to the lower end of the spectrum hints at a lack of strong buying pressure, aligning with the bearish sentiment suggested by other indicators.
Looking forward, the Pixel price faces immediate resistance levels at 0.5338 . This mark represents a significant barrier that the pair would need to overcome to shift the current bearish narrative. The ultimate resistance at 0.6111 stands as a distant target, requiring a substantial shift in market dynamics to achieve. On the downside, support levels at 0.516 and 0.4965 are critical. A breach below these levels could exacerbate the bearish trend, while holding above them might offer a foundation for potential stabilization or a cautious reversal.

PIXEL (NEW) VOLUME INCREASEThanks for reading this update.
PIXEL(NEW COIN) seems to enter new volume trend.
We will follow the coin to see if its able to get confirmations.
Remember that new coins can have high risk.
Trading should be only done with right riskmangement.
