#Platinum - Looking bullish if it holds.Platinum breaking out from small bull flag and also re-claiming TL support currently.
PLATINUM trade ideas

Major bull flag in PlatinumPlatinum is breaking out of a 5-6 week bull flag after tagging its 50 day moving average and reversing from major structure. Precious metals seem to be breaking out in general, but I particularly like the pattern in platinum. I am long all three (gold, silver and platinum).

PLATINUM Long term buy Hi everyone:
XPTUSD long term analysis and approach.
We see price had a massive dropped from mid February, and have since made several bull run to recover much of the price.
The current price action is showing a larger continuation structure, indicating more bull momentum could come in once the correction finishes.
I would go down to the lower time frame to look for breakouts and continuation structures to go long.
This could be a long term buy to the top of the higher time frame structure, and we can monitor to see further upside.
Traders, if you like my analysis, please like, follow, and comment. I welcome all kinds of feedback, suggestions and opinions, thank you.

There is possibility for the beginning of an up trend in XPTUSDTrading suggestion:
. There is a possibility of temporary retracement to suggested support line (797.31). if so, traders can set orders based on Price Action and expect to reach short-term targets.
Technical analysis:
. Platinum/ USDollar is in a range bound and the beginning of uptrend is expected.
. The ascending flag taking shape suggests we will soon see another leg higher.
. Price is above WEMA21, if price drops more, this line can act as dynamic support against more losses.
. Relative strength index ( RSI ) is 50.
Take Profits:
TP1= @ 837.90
TP2= @ 863.15
TP3= @ 894.75
TP4= @ 957.25
TP5= @ 1029.55
TP6= @ 1089.20
TP7= @ 1194.50
❤️ If you find this helpful and want more FREE forecasts in TradingView
. . . . . Please show your support back,
. . . . . . . . Hit the 👍 LIKE button,
. . . . . . . . . . . Drop some feedback below in the comment!
❤️ Your Support is very much 🙏 appreciated! ❤️
💎 Want us to help you become a better Forex trader ?
Now, It's your turn !
Be sure to leave a comment let us know how do you see this opportunity and forecast.
Trade well, ❤️
ForecastCity English Support Team ❤️

There is possibility for the beginning of an up trend in XPTUSDTrading suggestion:
. There is a possibility of temporary retracement to suggested support line (797.31). if so, traders can set orders based on Price Action and expect to reach short-term targets.
Technical analysis:
. Platinum/USDollar is in a range bound and the beginning of uptrend is expected.
. The ascending flag taking shape suggests we will soon see another leg higher.
. Price is above WEMA21, if price drops more, this line can act as dynamic support against more losses.
. Relative strength index ( RSI ) is 50.
Take Profits:
TP1= @ 837.90
TP2= @ 863.15
TP3= @ 894.75
TP4= @ 957.25
TP5= @ 1029.55
TP6= @ 1089.20
TP7= @ 1194.50
❤️ If you find this helpful and want more FREE forecasts in TradingView
. . . . . Please show your support back,
. . . . . . . . Hit the 👍 LIKE button,
. . . . . . . . . . . Drop some feedback below in the comment!
❤️ Your Support is very much 🙏 appreciated! ❤️
💎 Want us to help you become a better Forex trader ?
Now, It's your turn !
Be sure to leave a comment let us know how do you see this opportunity and forecast.
Trade well, ❤️
ForecastCity English Support Team ❤️

Platinum powerful buy signalsPlatinum, monthly chart: 11 years long(!) support zone + Triple divergence + Morning Star

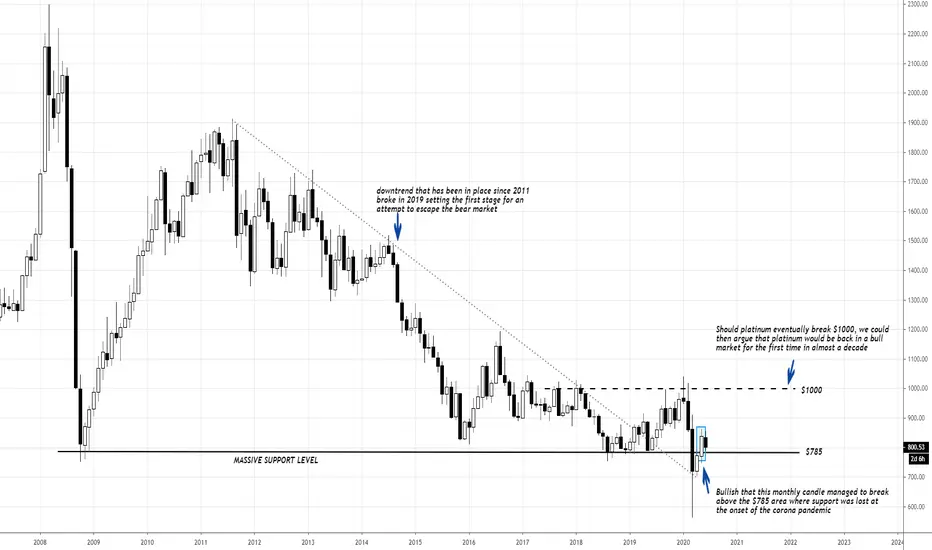
#Observation - Platinum longer term chart looking positiveAs per observations on the chart, the Spot price of Platinum does not look bad at all and seems to be setting up to break the bear market that we have witnessed over the last decade. Still lots of work to do, but early signs are there as per the chart. Above $1000 and we could then argue that the bull market in platinum has once again began..
The South African Platinum shares have traded extremely positive during this pandemic and could well be giving us an indication that the spot price eventually follows higher..


When Platinum takes off, you want to be in itIn March 2008, Platinum reached just shy of 3000.00. At the same time, Gold was closer to 1000.00. Take a look at Gold now and also this nice flag on Platinum. I posted to buy it at 600.00, but right now it is setting up to produce a very large higher time frame candle. Remember this is for investing, not scalping.

XPTUSD #Platinum #Short #Bearish #Shark #HarmonicA shark pattern is near completion on the 60 minute Platinum chart.
#Sell #Short
T.P @ 813.141
R/R = 2.77%


Platinum for upsideGood risk to reward ratio on this trade. A conservative trade would be the break above the upper boundary of the correction. Trade with care and remember to manage your trades.

XPTUSD Watch for BUYHi traders,
If the price will started to push strongly to the upside watch for your lower time frame buy setups.


XPT USD BUY (PLATINUM - US DOLLAR)Hi there. Price is forming a continuation pattern to the upside. Wait for the price to complete the pattern and watch strong price action for buy.

Potential Bat pattern on Platinum (4H)A metal to watch out for as a harmonic bat pattern is seemingly being formed, however, PA for this commodity is seemingly very nasty.
Any comments welcome as I am relatively new to this... Thanks! :)


XPTUSD Sell SignalPattern: 1D MA200 rejection.
Signal: Bearish as the rejection took place on the RSI support level.
Target: When the RSI hits 33.73.
** Please support this idea with your likes and comments, it is the best way to keep it relevant and support me. **

Platinum short - Daily ChartPrice seems to be obeying previous trendlines (red dotted line & pink line).
As price meets vwap once more, it looks like a good area for shorting.
Wait for an entry reason, what ever you choose on a lower time frame.

