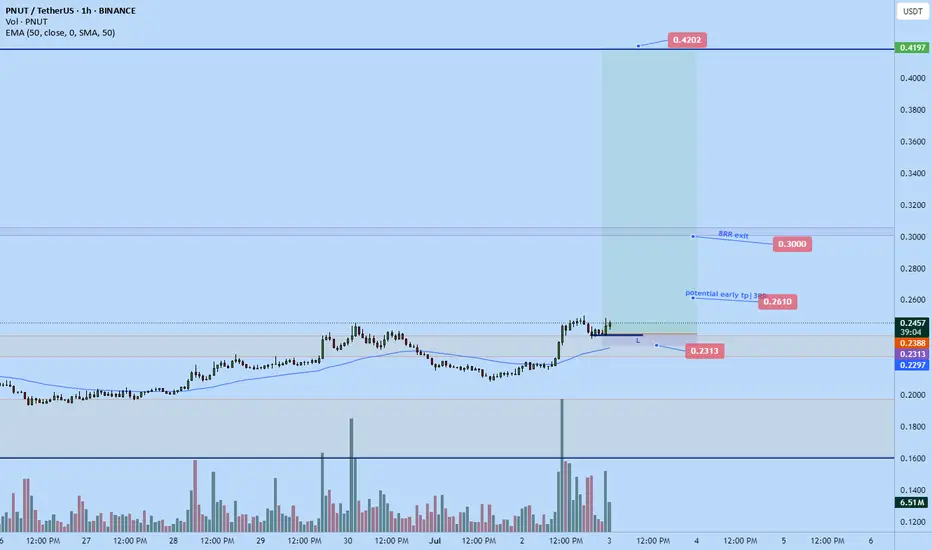
PNUT BIG BIG LONGTIme sensitive. whales are accumulating pnut, about to take off.
Based on my analysis we could pump as high as 0.42 but for today am just aiming for $0.3 which is roughly 8 RR from my entry. More than happy with that
Manage risk if following long though one could size up a little on this setup as
Related pairs
PNUT | Meme Mania Soon?PNUT/USDT presents a compelling bullish setup on the daily timeframe. The price has been consolidating within a strong support zone (green box) and is now approaching two critical breakout levels:
Key Technical Factors:
- Price trading near descending trendline resistance
- 90-day VWAP (red line)

PNUT/USDT +150%PNUT has completed a breakout and successful retest of its sloping downtrend line from the previous leg, which delivered a +200% move. After a healthy 60% retracement, price action is stabilizing at a key support previous major resistance.
This is a prime opportunity to fill your bags and begin DCA

Falling Channel Breakout on PNUT/USDT – Next Stop: $0.76?📊 Pattern Analysis:
Falling Channel (Descending Channel): PNUT formed a clear falling channel from early May to late June 2025. This pattern typically signals a potential bullish reversal once a breakout occurs.
Confirmed Breakout: The price has successfully broken above the upper boundary of the

PNUT/USDT – Bullish Rebound from Channel Support | Long SetupPNUT/USDT is currently respecting the ascending parallel channel on the 4H timeframe. Price bounced off the lower boundary of the channel, showing signs of a potential bullish continuation. A long position is entered near support, with a target toward the upper range of the channel and a tight stop

$PNUT Bull Flag in Play, Breakout Loading?$PNUT is forming a clean bull flag on the 12H chart after a strong move up in early May.
Price is respecting the flag structure and just bounced from the lower boundary.
A breakout above $0.238 could trigger the next leg toward $0.35, nearly 60% potential upside.
Momentum building.
Flag breakout in

PNUTUSDT Forming Falling Wedge — Breakout Incoming?NUTUSDT is forming a falling wedge pattern, a classic bullish reversal setup. Price action is tightening, and if momentum builds, a breakout to the upside could follow. Traders are watching closely to see if PNUT can break resistance and push toward higher targets, signaling a potential trend shif

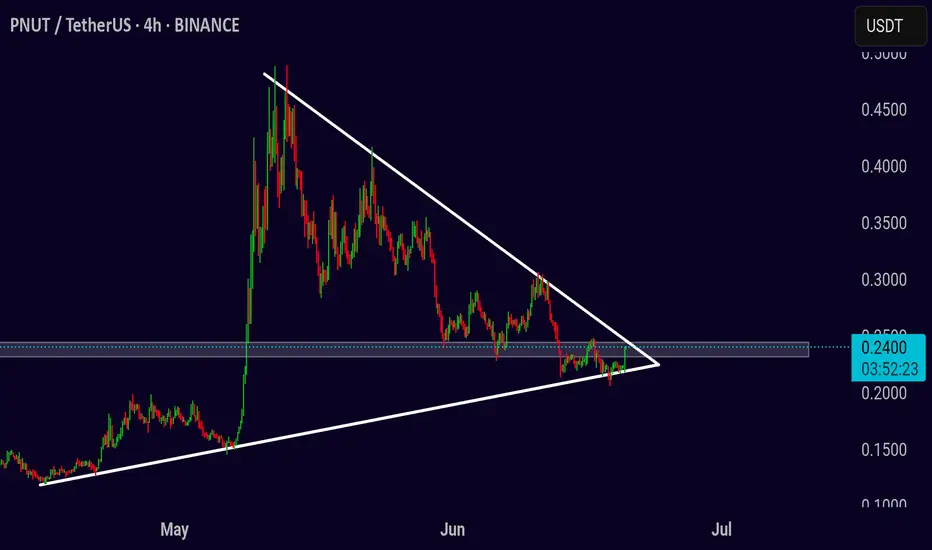
PNUT/USDT – Breakout Watch from Symmetrical TrianglePNUT/USDT – Breakout Watch from Symmetrical Triangle
Chart pattern: Symmetrical Triangle
Timeframe: 4-Hour
Published: June 20, 2025
PNUT/USDT is nearing the apex of a symmetrical triangle that has been forming over several weeks. The price is tightening between rising support and descending resista
PNUTUSDT UPDATEPattern: Falling Wedge
Current Price: $0.2276
Target Price: $0.42
Target % Gain: 80.64%
Technical Analysis: PNUT is forming a falling wedge on the 1D chart, showing signs of a potential breakout. A breakout above the wedge resistance could trigger an 80% move. Monitor volume and candle structure

PNUTUSDT Forming Falling WedgePNUTUSDT is presenting a compelling falling wedge pattern, signaling a high-probability bullish reversal. This technical formation typically occurs after a sustained downtrend and is characterized by converging trendlines sloping downward. In the case of PNUTUSDT, the wedge is nearing its apex, indi

See all ideas
Summarizing what the indicators are suggesting.
Oscillators
Neutral
SellBuy
Strong sellStrong buy
Strong sellSellNeutralBuyStrong buy
Oscillators
Neutral
SellBuy
Strong sellStrong buy
Strong sellSellNeutralBuyStrong buy
Summary
Neutral
SellBuy
Strong sellStrong buy
Strong sellSellNeutralBuyStrong buy
Summary
Neutral
SellBuy
Strong sellStrong buy
Strong sellSellNeutralBuyStrong buy
Summary
Neutral
SellBuy
Strong sellStrong buy
Strong sellSellNeutralBuyStrong buy
Moving Averages
Neutral
SellBuy
Strong sellStrong buy
Strong sellSellNeutralBuyStrong buy
Moving Averages
Neutral
SellBuy
Strong sellStrong buy
Strong sellSellNeutralBuyStrong buy
Displays a symbol's price movements over previous years to identify recurring trends.
Frequently Asked Questions
The current price of PNUT / TetherUS (PNUT) is 0.2359 USDT — it has fallen −0.38% in the past 24 hours. Try placing this info into the context by checking out what coins are also gaining and losing at the moment and seeing PNUT price chart.
PNUT / TetherUS price has fallen by −7.86% over the last week, its month performance shows a −19.38% decrease, and as for the last year, PNUT / TetherUS has increased by 125.31%. See more dynamics on PNUT price chart.
Keep track of coins' changes with our Crypto Coins Heatmap.
Keep track of coins' changes with our Crypto Coins Heatmap.
PNUT / TetherUS (PNUT) reached its highest price on Nov 14, 2024 — it amounted to 2.5000 USDT. Find more insights on the PNUT price chart.
See the list of crypto gainers and choose what best fits your strategy.
See the list of crypto gainers and choose what best fits your strategy.
PNUT / TetherUS (PNUT) reached the lowest price of 0.1047 USDT on Nov 11, 2024. View more PNUT / TetherUS dynamics on the price chart.
See the list of crypto losers to find unexpected opportunities.
See the list of crypto losers to find unexpected opportunities.
The safest choice when buying PNUT is to go to a well-known crypto exchange. Some of the popular names are Binance, Coinbase, Kraken. But you'll have to find a reliable broker and create an account first. You can trade PNUT right from TradingView charts — just choose a broker and connect to your account.
PNUT / TetherUS (PNUT) is just as reliable as any other crypto asset — this corner of the world market is highly volatile. Today, for instance, PNUT / TetherUS is estimated as 13.93% volatile. The only thing it means is that you must prepare and examine all available information before making a decision. And if you're not sure about PNUT / TetherUS, you can find more inspiration in our curated watchlists.
You can discuss PNUT / TetherUS (PNUT) with other users in our public chats, Minds or in the comments to Ideas.