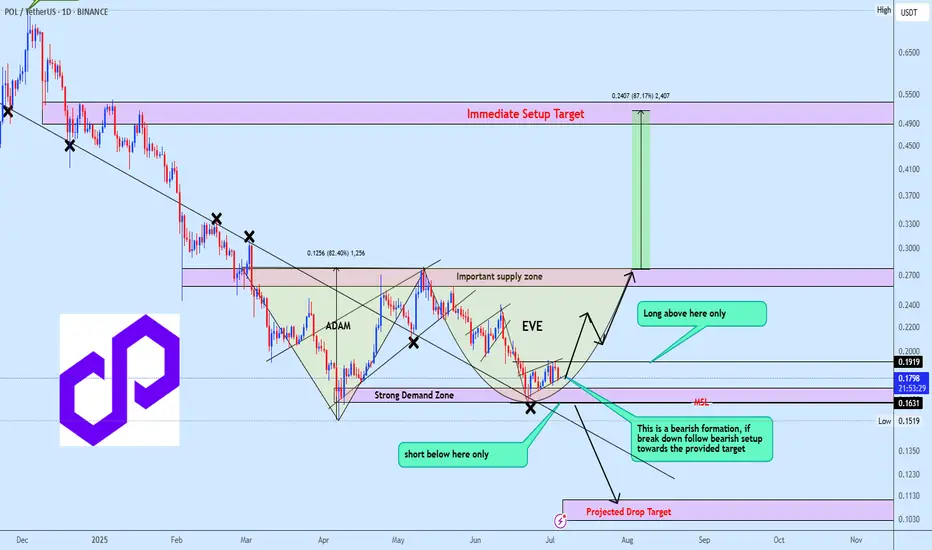
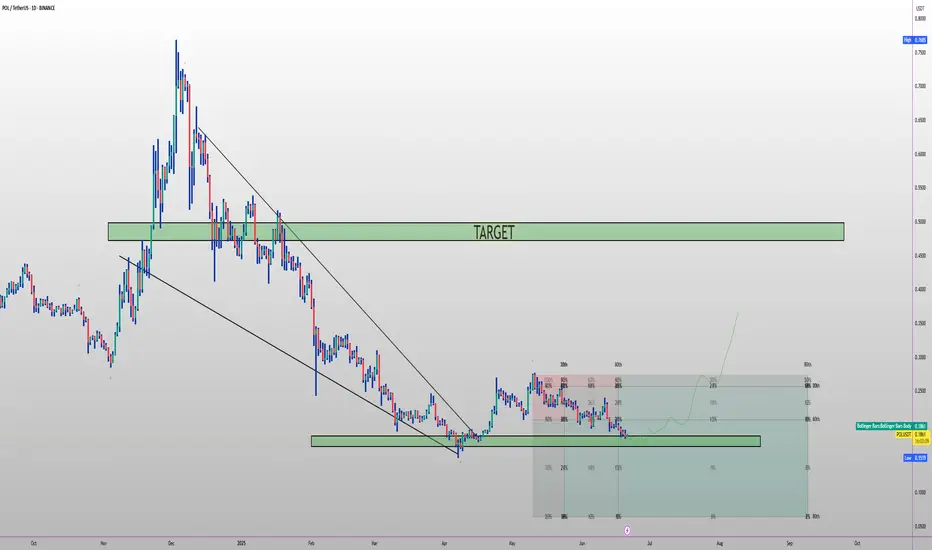
POLUSDT reversal time or bearish ContinuationPOLUSDT is currently shaping a potential Adam and Eve formation, with price consolidating inside a mini bearish flag. A breakdown from the flag would invalidate the bullish setup and likely trigger a continuation toward the projected downside target.
However, if the strong demand zone holds, we could see a bullish reversal unfold, confirming the Adam and Eve structure and opening the path toward the upside projection highlighted on the chart.
At this stage, the focus is on confirmation, not speculation. Waiting for price to validate direction will be key to positioning correctly in this setup.
POLUSDT trade ideas
Polygon (POL): Loading For Breakout | Good Momentum After 200EMAPolygon has formed a decent bullish trend here where price is looking for a potential breakout, which would give us a very good opportunity for a long position so that's what we are looking for.
A break of 200 EMA is where buyers should establish dominance and then lead the price to upper zones!
Swallow Academy

polusdtThe pol currency is suspected of forming a twin bottom on the daily timeframe and has a triangle on the 4-hour timeframe that could be directed upwards. We will see if it can form this twin bottom or not (this is a personal opinion) Good luck
POLPSX:POL has a potential 100% gain from the current price. Right now it is trading inside a horizontal channel which signals accumulation. Expect a strong breakout soon.

Polygon (POL): Good Long Opportunity | May 2025Polygon has done a nice 10% movement since last time, where currently we are seeing yet again the dominance from the buyers. It will be an interesting opportunity that we might be taking soon!
More in-depth info is in the video—enjoy!
Swallow Academy

Trading plan for Polygon this weekLet's try a new format for ideas. If you like it, I'll post my ideas more often.
BINANCE:POLUSDT This week, we might see a breakout of the local low and a retest of the weekly pivot point, after which we could expect a rise toward resistance number 2
Consider your risks
Wish you successful trades ! mura
Polygon (POL): Seeing Opportunity For Long Position | Good R:RPolygon coin is showing a strong buy zone for us where we are looking for a buy entry near the current region, which could give us a nice 25% of market price movement from here.
More in-depth info is in the video—enjoy!
Swallow Academy

Polygon (POL): Caught 3 Good Potential Trades That Can Be Taken!POL coin will most probably see a breakout soon but we are seeing 2 more trades that can be taken before the breakout happens!
More in-depth info is in the video—enjoy!
Swallow Academy

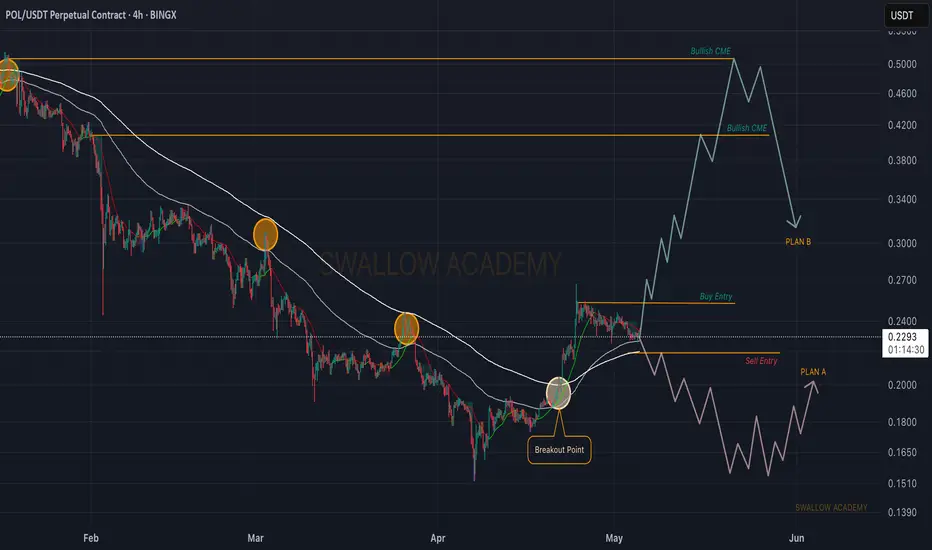
Polygon (POL): Reaching Re-Test Area | Looking For Sharp MovePolygon coin (previously MATIC) might be in some trouble, where we are seeing high chances of volatile movement to come in the next days. While price is seeing a decline and approaching the retest zone, we are looking for a possible downward movement from here.
Seeing historically how CME gaps have been ignored on the POL coin, we might ignore the most recent one as well so let's wait for a sell entry and we are going into short here.
But if we see that buyers overtake the retest zone, we are going to wait for a proper break of structure at our buy entry area.
Swallow Academy
POLUSDT 1D AnalysisPOL ~ 1D Analysis
#POL This coin is currently at its lowest support. Buy if you still have confidence in this coin with a short term target of at least 15%+ from this support.

Pol targets for 2025🔥 PSX:POL long setup (1D) 🚀
✅ Entry: $0.16 – $0.18 (launch-base demand)
🎯 Targets
• TP-1: $0.45
• TP-2: $0.58
⛔ Stop-Loss
1 d Close < $0.14
📊 Thesis
Polygon 2.0 migration ✔️. AggLayer mainnet (Feb-25) + Breakout Program → airdrops for POL stakers. Gigagas upgrade aims 1 k + TPS. 2 % annual emission = staking yield. zkEVM sunset frees resources for PoS & AggLayer. 🔥 risk-reward.
#POL/USDT#POL
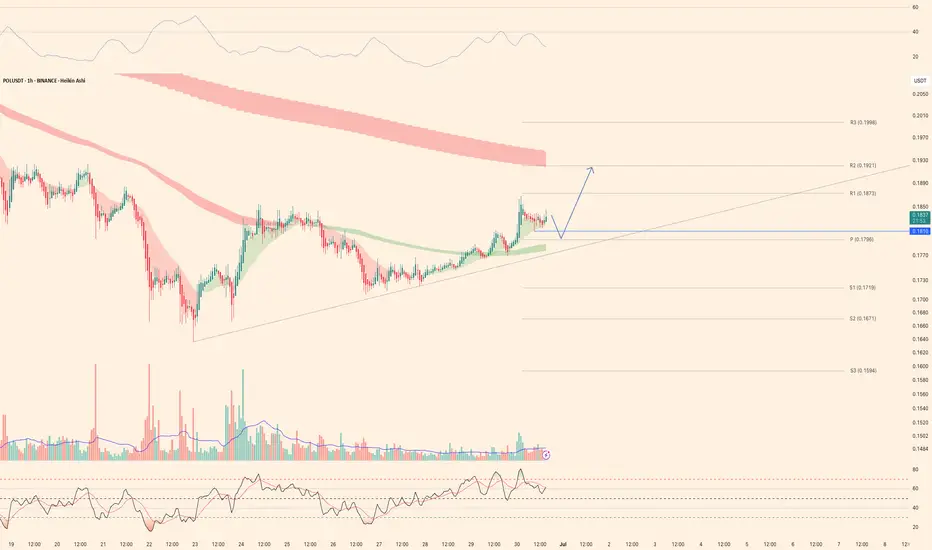
The price is moving within a descending channel on the 1-hour frame and is expected to break and continue upward.
We have a trend to stabilize above the 100 moving average once again.
We have a downtrend on the RSI indicator, which supports the upward move by breaking it upward.
We have a support area at the lower limit of the channel at 0.2000, acting as strong support from which the price can rebound.
Entry price: 0.2023
First target: 0.2053
Second target: 0.2091
Third target: 0.2134

POL Coin Alert: Big Move Incoming!As an analyst, I've identified the completion of Waves 1 & 2 of a major uptrend. Get ready for an explosive Wave 3 in POL!
This looks like a prime accumulation zone, with profit targets eyeing $0.80 to $1.00. My invalidation for this count is $0.15.
Disclaimer: This is my personal Elliott Wave analysis and not financial advice. Cryptocurrency markets are highly volatile. Always do your own research (DYOR) before investing.
#POL #Polygon #ElliottWave #Wave3 #Crypto #TechnicalAnalysis #PricePrediction #Bullish #MATIC #CryptoCurrency #MarketAnalysis #Trading #Invest #LongTerm #SwingTrading #Blockchain #DeFi #Altcoin #TechnicalChart

POLUSDT: Trend in daily timeframeThe color levels are very accurate levels of support and resistance in different time frames, and we have to wait for their reaction in these areas.
So, Please pay special attention to the very accurate trend, colored levels, and you must know that SETUP is very sensitive.
Be careful
BEST
MT

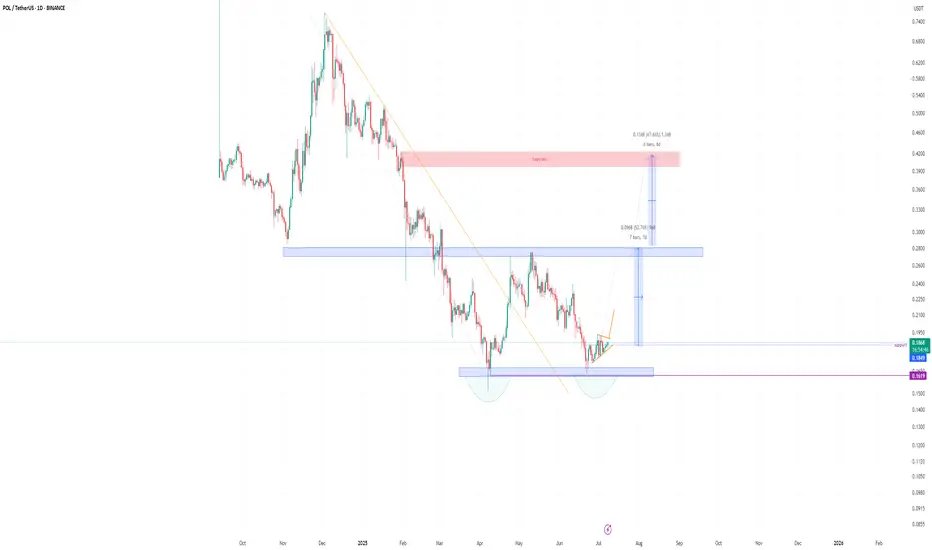
POLUSDT 1D#POL — Bullish Setup on Watch 🔍
#POL is currently moving inside a Descending Broadening Wedge on the daily chart, signaling a potential bullish reversal.
A breakout above the wedge resistance and the daily MA50 could spark a strong upward move. Key targets after breakout:
🎯 $0.2867
🎯 $0.3709
🎯 $0.4374
🎯 $0.5048
⚠️ Always use a tight stop-loss to manage risk and protect your capital.

Polygon (POL): Entering Good Buying Opportunity | June 2025POL coin is entering a good buying opportunity area where we are looking for some good R:R trades that can be taken both on Daily and Hourly timeframes.
More in-depth info is in the video—enjoy!
Swallow Academy

Polygon, Higher Low? Easy 1,000% Profits PotentialFour weeks red! Do you really believe the market will continue moving lower? If the answer is yes; think twice, stop! Think again.
Four weeks red is all that you will get you bearish bastard.
Your time is over. We are taking over, the bulls are entering the game.
You had your fun, you had it for a few days.
You can't have it anymore, I am calling my friends.
Friends, look at Polygon (POLUSDT), the chart looks great.
Whenever there is a retrace within a bull market, this is an opportunity to enter again.
Great timing, great prices; the start of a new bullish wave.
Prices are about to grow... Everything is about to grow... Crypto is going up. Are you in or are you out? Did you miss the initial bullish breakout? That's ok. The next bullish wave will 4-6 times bigger than the previous one for this pair. Sometimes even more. Here we have 1,000% profits potential as an easy target.
Get ready and be sure to be prepared.
Start buying like the world is about to end. Why?
Because there will be so much growth in the coming days, that you want to profit all the way. To profit you need to be in, you have to buy when prices are low.
You cannot wait for the green candle, the best time is now.
Thanks a lot for your continued support.
Namaste.

POL: Ideal Bullish SetupDuring early April to mid-May, #POL had one of the strongest bullish rises among top-tier projects.
The ongoing correction appears to be a healthy pullback before the next major leg up.
Holding above $0.15 keeps the setup valid. Passing $0.257 confirms a new rally.
#Polygon

PoL - Long Set-UPBINANCE:POLUSDT
Current Price: ~$0.2207
Support Zone: $0.18 – $0.20 (highlighted in orange)
SL Below: 0.16
Target - 0.22 , 0.25++
Structure: Price recently broke below a trendline and retested a previous support-turned-resistance (green zone).
Volume: Decreasing, suggesting weakening bearish momentum

POL USDT SHORT TRADE SETUPPOL/USDT is currently testing a strong resistance zone , with a high probability of a downward price move. Additionally, the 100 EMA is acting as a significant resistance.

POL/USDT Potential UpsidesHey Traders, in today's trading session we are monitoring POL/USDT for a buying opportunity around 0.2200 zone, POL/USDT is trading in an uptrend and currently is in a correction phase in which it is approaching the trend at 0.2200 support and resistance area.
Trade safe, Joe.

POLUSDT 1D Analysis POL ~ 1D Analysis
#POL Buy gradually from here if you still have confidence in this coin with a short term target of at least 15%++ from here.

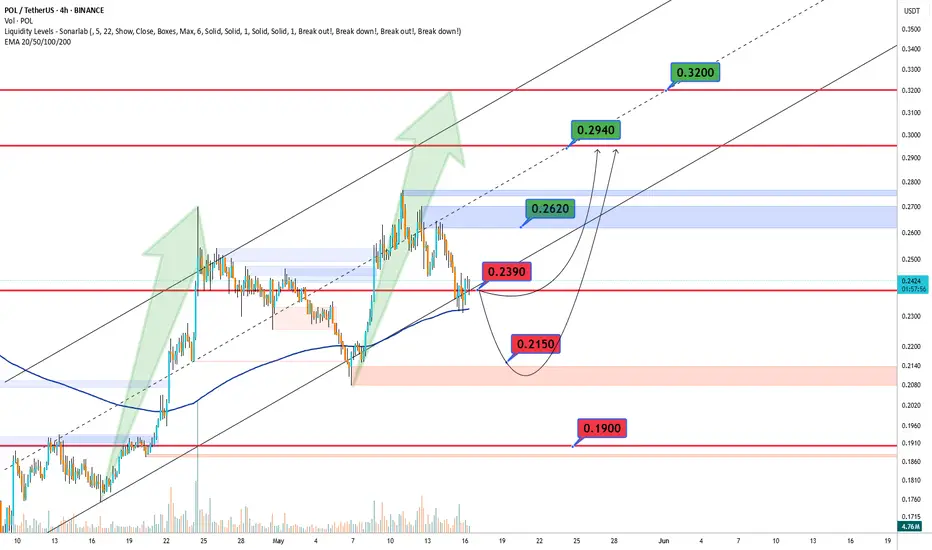
POLUSDT Bullish🔍 BINANCE:POLUSDT Technical Outlook – May 16 🔍
Bulls are watching the key $0.2390 level! 🔼
If broken, we could see a rally towards $0.2620, then $0.2940, and even $0.3200 if momentum stays strong 🚀
But if price gets rejected... 👀
Watch support at $0.2150 – and if that fails, $0.1900 could be next 🛑
📊 Current zones to watch:
🔴 Resistance: $0.2620 | $0.2940 | $0.3200
🟢 Support: $0.2390 | $0.2150 | $0.1900