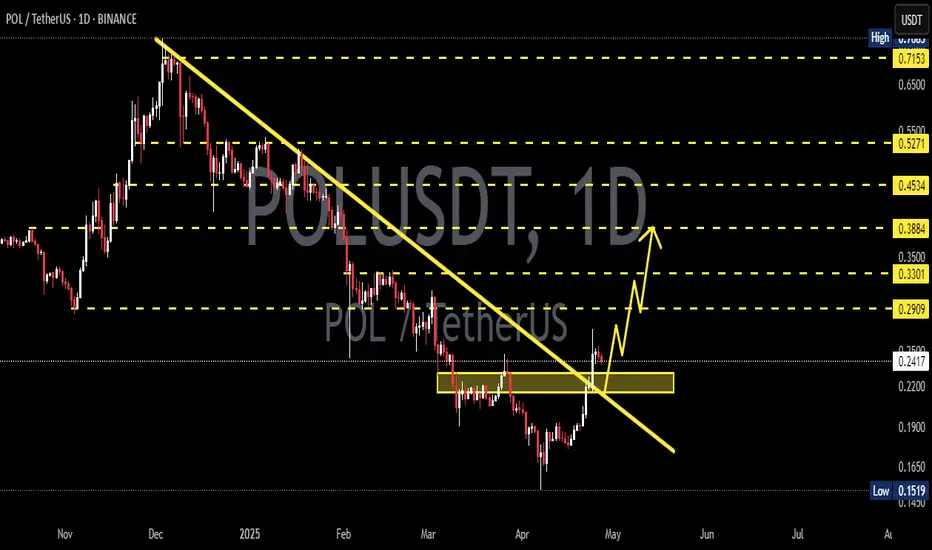
Polygon, Higher Low? Easy 1,000% Profits PotentialFour weeks red! Do you really believe the market will continue moving lower? If the answer is yes; think twice, stop! Think again.
Four weeks red is all that you will get you bearish bastard.
Your time is over. We are taking over, the bulls are entering the game.
You had your fun, you had it for a few days.
You can't have it anymore, I am calling my friends.
Friends, look at Polygon (POLUSDT), the chart looks great.
Whenever there is a retrace within a bull market, this is an opportunity to enter again.
Great timing, great prices; the start of a new bullish wave.
Prices are about to grow... Everything is about to grow... Crypto is going up. Are you in or are you out? Did you miss the initial bullish breakout? That's ok. The next bullish wave will 4-6 times bigger than the previous one for this pair. Sometimes even more. Here we have 1,000% profits potential as an easy target.
Get ready and be sure to be prepared.
Start buying like the world is about to end. Why?
Because there will be so much growth in the coming days, that you want to profit all the way. To profit you need to be in, you have to buy when prices are low.
You cannot wait for the green candle, the best time is now.
Thanks a lot for your continued support.
Namaste.
POLUSDT trade ideas

Polygon (POL): Entering Good Buying Opportunity | June 2025POL coin is entering a good buying opportunity area where we are looking for some good R:R trades that can be taken both on Daily and Hourly timeframes.
More in-depth info is in the video—enjoy!
Swallow Academy

POLUSDT: Trend in daily timeframeThe color levels are very accurate levels of support and resistance in different time frames, and we have to wait for their reaction in these areas.
So, Please pay special attention to the very accurate trend, colored levels, and you must know that SETUP is very sensitive.
Be careful
BEST
MT

POLUSDT 1D#POL — Bullish Setup on Watch 🔍
#POL is currently moving inside a Descending Broadening Wedge on the daily chart, signaling a potential bullish reversal.
A breakout above the wedge resistance and the daily MA50 could spark a strong upward move. Key targets after breakout:
🎯 $0.2867
🎯 $0.3709
🎯 $0.4374
🎯 $0.5048
⚠️ Always use a tight stop-loss to manage risk and protect your capital.

POL Coin Alert: Big Move Incoming!As an analyst, I've identified the completion of Waves 1 & 2 of a major uptrend. Get ready for an explosive Wave 3 in POL!
This looks like a prime accumulation zone, with profit targets eyeing $0.80 to $1.00. My invalidation for this count is $0.15.
Disclaimer: This is my personal Elliott Wave analysis and not financial advice. Cryptocurrency markets are highly volatile. Always do your own research (DYOR) before investing.
#POL #Polygon #ElliottWave #Wave3 #Crypto #TechnicalAnalysis #PricePrediction #Bullish #MATIC #CryptoCurrency #MarketAnalysis #Trading #Invest #LongTerm #SwingTrading #Blockchain #DeFi #Altcoin #TechnicalChart

#POL/USDT#POL
The price is moving within a descending channel on the 1-hour frame and is expected to break and continue upward.
We have a trend to stabilize above the 100 moving average once again.
We have a downtrend on the RSI indicator, which supports the upward move by breaking it upward.
We have a support area at the lower limit of the channel at 0.2000, acting as strong support from which the price can rebound.
Entry price: 0.2023
First target: 0.2053
Second target: 0.2091
Third target: 0.2134

POL: Ideal Bullish SetupDuring early April to mid-May, #POL had one of the strongest bullish rises among top-tier projects.
The ongoing correction appears to be a healthy pullback before the next major leg up.
Holding above $0.15 keeps the setup valid. Passing $0.257 confirms a new rally.
#Polygon

PoL - Long Set-UPBINANCE:POLUSDT
Current Price: ~$0.2207
Support Zone: $0.18 – $0.20 (highlighted in orange)
SL Below: 0.16
Target - 0.22 , 0.25++
Structure: Price recently broke below a trendline and retested a previous support-turned-resistance (green zone).
Volume: Decreasing, suggesting weakening bearish momentum

Polygon (POL): Good Long Opportunity | May 2025Polygon has done a nice 10% movement since last time, where currently we are seeing yet again the dominance from the buyers. It will be an interesting opportunity that we might be taking soon!
More in-depth info is in the video—enjoy!
Swallow Academy

POL USDT SHORT TRADE SETUPPOL/USDT is currently testing a strong resistance zone , with a high probability of a downward price move. Additionally, the 100 EMA is acting as a significant resistance.

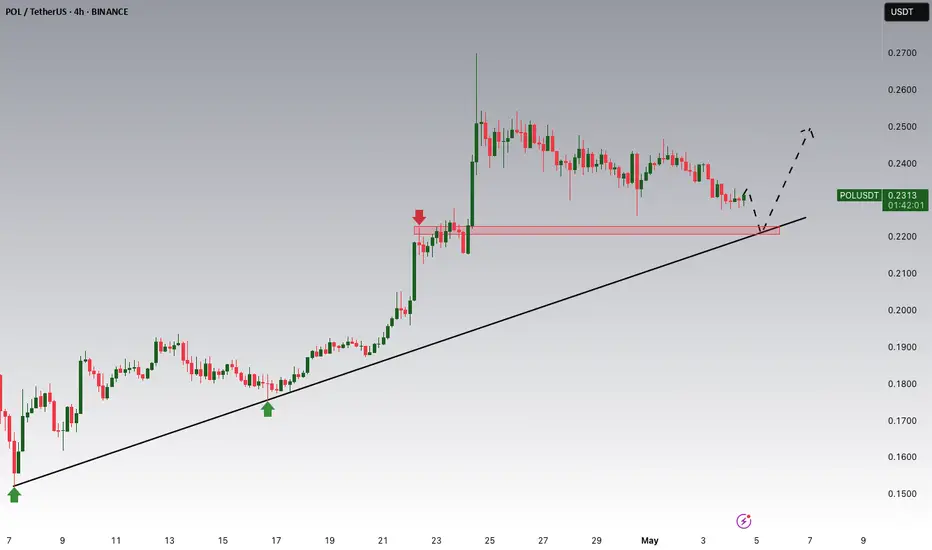
POL/USDT Potential UpsidesHey Traders, in today's trading session we are monitoring POL/USDT for a buying opportunity around 0.2200 zone, POL/USDT is trading in an uptrend and currently is in a correction phase in which it is approaching the trend at 0.2200 support and resistance area.
Trade safe, Joe.

Polygon (POL): Seeing Opportunity For Long Position | Good R:RPolygon coin is showing a strong buy zone for us where we are looking for a buy entry near the current region, which could give us a nice 25% of market price movement from here.
More in-depth info is in the video—enjoy!
Swallow Academy

POLUSDT 1D Analysis POL ~ 1D Analysis
#POL Buy gradually from here if you still have confidence in this coin with a short term target of at least 15%++ from here.

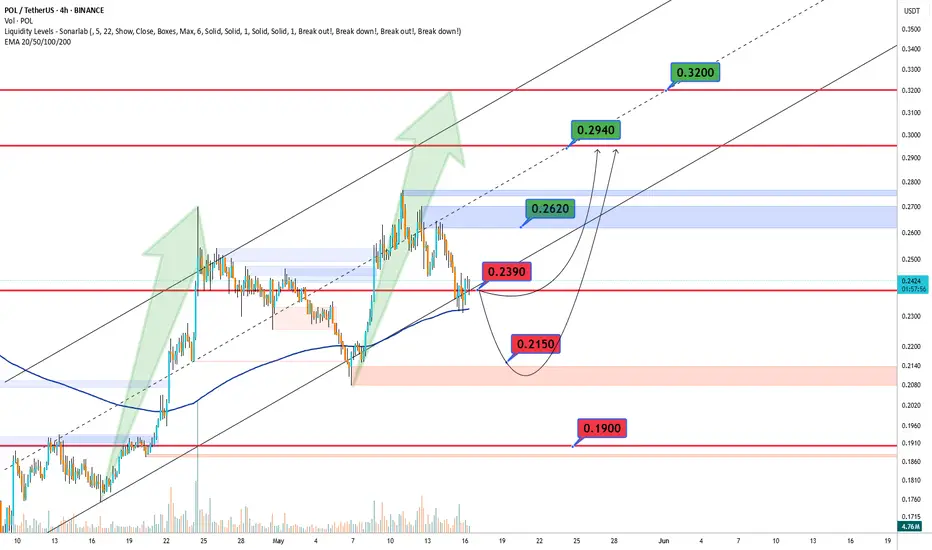
POLUSDT Bullish🔍 BINANCE:POLUSDT Technical Outlook – May 16 🔍
Bulls are watching the key $0.2390 level! 🔼
If broken, we could see a rally towards $0.2620, then $0.2940, and even $0.3200 if momentum stays strong 🚀
But if price gets rejected... 👀
Watch support at $0.2150 – and if that fails, $0.1900 could be next 🛑
📊 Current zones to watch:
🔴 Resistance: $0.2620 | $0.2940 | $0.3200
🟢 Support: $0.2390 | $0.2150 | $0.1900
POL/USDTPOL/USDT looks good at current price, created divergence on daily time frame, broke recent high with good volume currently bounce back from golden number of fib this move make confident to enter in trade.
Trade Plane
Stop Loss 0.1525
01) Short term Target 0.27
02) Short term Target 0.32

POL USDT LONG TRADE SETUPPOL is currently holding a strong support level , with a high probability of the price moving upwards. Additionally, other indicators, such as the 200 EMA, are also acting as support .

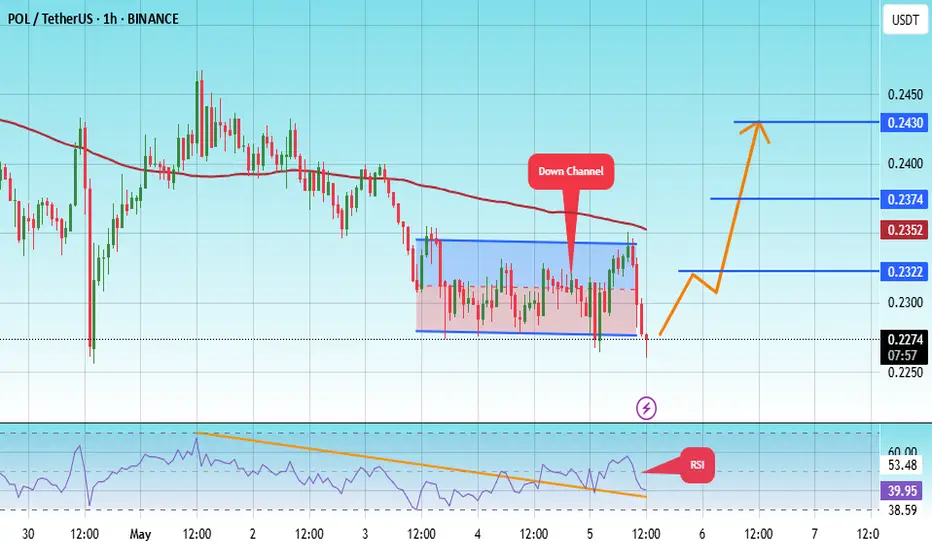
#POL/USDT#POL
The price is moving within a descending channel on the 1-hour frame, adhering well to it, and is on its way to breaking it strongly upwards and retesting it.
We are seeing a rebound from the lower boundary of the descending channel, which is support at 2270.
We have a downtrend on the RSI indicator that is about to break and retest, supporting the upward trend.
We are looking for stability above the 100 moving average.
Entry price: 0.2270
First target: 0.2322
Second target: 0.2374
Third target: 0.2430
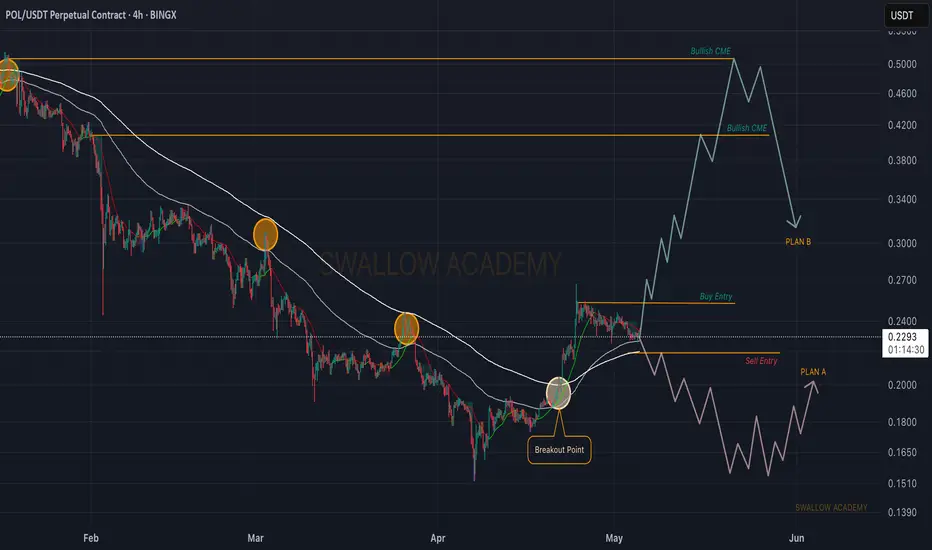
Polygon (POL): Reaching Re-Test Area | Looking For Sharp MovePolygon coin (previously MATIC) might be in some trouble, where we are seeing high chances of volatile movement to come in the next days. While price is seeing a decline and approaching the retest zone, we are looking for a possible downward movement from here.
Seeing historically how CME gaps have been ignored on the POL coin, we might ignore the most recent one as well so let's wait for a sell entry and we are going into short here.
But if we see that buyers overtake the retest zone, we are going to wait for a proper break of structure at our buy entry area.
Swallow Academy
POLUSDT Potential UpsidesHey Traders, in today's trading session we are monitoring POLUSDT for a buying opportunity around 0.2220 zone, POLUSDT is trading in an uptrend and currently is in a correction phase in which it is approaching the trend at 0.2220 support and resistance area.
Trade safe, Joe.
Polygon Ecosystem Token Last Chance, It Is Not Too LateLet's close the day with a classic —RSI bullish divergence.
Polygon Ecosystem Token (POL) has been moving lower and hit bottom on the 7th of April. It's RSI on the other hand isn't doing the same, it bottomed in early July 2024. While POLUSDT went on to produce lower lows, its 3D RSI has been doing higher lows. This is a very strong bullish divergence and also a classic reversal signal.
This signal coupled with volume and marketwide action confirms that the bottom is in.
This pair is going through a pause now, a small one, before additional-huge growth.
The market is giving us one last chance to buy all we want before massive growth.
When the next move starts, there will never be a chance to buy at prices like we have now today. This is good. Cryptocurrency will evolve and the entire world will benefit.
This is a friendly reminder.
Time to work. Wake up!
It is not too late.
Namaste.

POL/USDTKey Level Zone: 0.24200 - 0.24330
HMT v8.1 detected. The setup looks promising, supported by a previous upward/downward trend with increasing volume and momentum, presenting an excellent reward-to-risk opportunity.
HMT (High Momentum Trending):
HMT is based on trend, momentum, volume, and market structure across multiple timeframes. It highlights setups with strong potential for upward movement and higher rewards.
Whenever I spot a signal for my own trading, I’ll share it. Please note that conducting a comprehensive analysis on a single timeframe chart can be quite challenging and sometimes confusing. I appreciate your understanding of the effort involved.
Important Note :
Role of Key Levels:
- These zones are critical for analyzing price trends. If the key level zone holds, the price may continue trending in the expected direction. However, momentum may increase or decrease based on subsequent patterns.
- Breakouts: If the key level zone breaks, it signals a stop-out. For reversal traders, this presents an opportunity to consider switching direction, as the price often retests these zones, which may act as strong support-turned-resistance (or vice versa).
My Trading Rules
Risk Management
- Maximum risk per trade: 2.5%.
- Leverage: 5x.
Exit Strategy
Profit-Taking:
- Sell at least 70% on the 3rd wave up (LTF Wave 5).
- Typically, sell 50% during a high-volume spike.
- Adjust stop-loss to breakeven once the trade achieves a 1.5:1 reward-to-risk ratio.
- If the market shows signs of losing momentum or divergence, ill will exit at breakeven.
The market is highly dynamic and constantly changing. HMT signals and target profit (TP) levels are based on the current price and movement, but market conditions can shift instantly, so it is crucial to remain adaptable and follow the market's movement.
If you find this signal/analysis meaningful, kindly like and share it.
Thank you for your support~
Sharing this with love!
HMT v2.0:
- Major update to the Momentum indicator
- Reduced false signals from inaccurate momentum detection
- New screener with improved accuracy and fewer signals
HMT v3.0:
- Added liquidity factor to enhance trend continuation
- Improved potential for momentum-based plays
- Increased winning probability by reducing entries during peaks
HMT v3.1:
- Enhanced entry confirmation for improved reward-to-risk ratios
HMT v4.0:
- Incorporated buying and selling pressure in lower timeframes to enhance the probability of trending moves while optimizing entry timing and scaling
HMT v4.1:
- Enhanced take-profit (TP) target by incorporating market structure analysis
HMT v5 :
Date: 23/01/2025
- Refined wave analysis for trending conditions
- Incorporated lower timeframe (LTF) momentum to strengthen trend reliability
- Re-aligned and re-balanced entry conditions for improved accuracy
HMT v6 :
Date : 15/02/2025
- Integrated strong accumulation activity into in-depth wave analysis
HMT v7 :
Date : 20/03/2025
- Refined wave analysis along with accumulation and market sentiment
HMT v8 :
Date : 16/04/2025
- Fully restructured strategy logic
HMT v8.1 :
Date : 18/04/2025
- Refined Take Profit (TP) logic to be more conservative for improved win consistency

#POL/USDT#POL
The price is moving within a descending channel on the 1-hour frame, adhering well to it, and is heading for a strong breakout and retest.
We are experiencing a rebound from the lower boundary of the descending channel, which is support at 0.2400.
We are experiencing a downtrend on the RSI indicator, which is about to break and retest, supporting the upward trend.
We are looking for stability above the 100 moving average.
Entry price: 0.2480
First target: 2565
Second target: 0.2645
Third target: 0.2734

POLUSDT 1D AnalysisPOL ~ 1D Analysis
#POL Buy gradually from here if you still have a Conviction on this coin with a short -term target of at least 15%+ from here.